LARGE REGIONAL DISPARITIES IN INFORMALITY
Seyfettin Gürsel, Mine Durmaz**
Executive Summary
Our second research brief studying the problem of informality focuses on regional disparities. There are large differences in regional rates of informal employment. According to 2013 data, while the country’s informality rate of 37 percent is soaring to 70 percent in Southeast region, it recorded about 16 percent in Ankara and Istanbul. The rate of informality for wage earners, which is reported as 20 percent overall, is more than 40 percent in Southeast region and ranges between 10 and 16 percent in highly industrialized western regions. In addition, significant decrease in overall informality at country level in the period 2005-2013 has been unequal through regions. While the overall informality rate decreased by 38 percent, it has been reduced by more than half in western regions. Correspondingly, decreases are more limited in other regions, but also in some regions informality increased.
The main force behind regional disparities in terms of informality is regional differences in structural determinants of informality such as average level of education, average firm size, or sectoral distribution of employment- that affect the level of informal employment. In last eight years, this unequal improvement in informality across regions arises from unequal regional changes in these structural determinants.
Large regional differences in informality
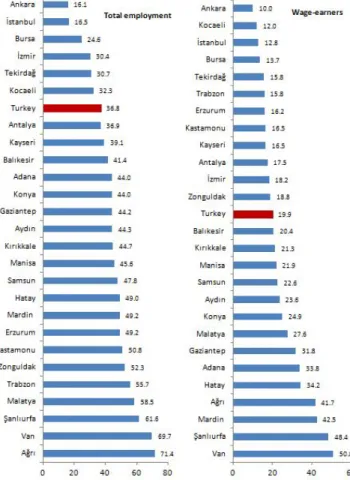
Informality defined by employment of workers not registered with social security institution (voluntarily informality) or of those forced working into informally (involuntarily informality), exhibits large regional differences. Only in two regions, the share of informal workers in total employment is less than Turkey's average rate of 36.8 percent. These regions are Ankara (14.1 percent) and Istanbul (16.5 percent). The regions of Ağrı and Van have the most severe informality rates of 71.4 percent and 69.7 percent respectively. On the other hand, in 20 out of 26 regions the rates of informality exceeds average informality rate in Turkey. Informality is more prevalent particularly in East and Southeast regions. Furthermore, high informality rates in the regions of Trabzon (55.7 percent), Zonguldak (52.3 percent), and Kastamonu (50.8 percent) are remarkable (Figure 1).
Note that regional distribution of informal employment of regular or causal workers (wage earners hereafter) is quite different from regional distribution of total informal employment. The regions of Ankara and Kocaeli have the lowest rates of informality for wage earners with 10 percent and 12
Prof. Dr. Seyfettin Gürsel, Betam, Director, [email protected] ****Mine Durmaz, Betam, Research Assistant, [email protected]
4 September 2014
percent respectively. Istanbul is the third with the rate of 12.8 percent. It is interesting that in the regions of Trabzon, Kastamonu, and Zonguldak, where overall informality rates are quite high, the rates of informality for wage earners are below average wage earners informality rate (19.9 percent). Informality rate for wage earners are below the average rate of Turkey in twelve regions, however total informality is more than average rate of Turkey in only six regions (Figure 1).
Figure 1: 2013 Regional (NUTS 2) Informality Rates (%) 1
Source: TurkStat, 2013 Household Labor Survey micro dataset; Betam
The potential reason for large regional differences in informality rates is unequal distribution of structural determinants that we studied in our previous research brief (see Betam Research Brief 14/171).2 Indeed, largely differentiated informality across regions arises from regional discrepancies
in average level of education, average firm size and sectoral distribution of employment. For instance, the main reason for why Ankara has the lowest informality rate is that the employment in this region consists predominantly of wage earners and a large proportion of these wage earnersare employed
1Cities in the regions: İstanbul (İstanbul), Tekirdağ (Edirne, Tekirdağ, Kırklareli), Balıkesir (Balıkesir, Çanakkale), İzmir (İzmir), Aydın (Denizli, Aydın, Muğla), Manisa (Manisa, Afyonkarahisar, Kütahya, Uşak), Bursa (Bursa, Eskişehir, Bilecik), Kocaeli (Kocaeli, Sakarya, Düzce, Bolu, Yalova), Ankara (Ankara), Konya (Konya, Karaman), Antalya (Antalya, Isparta, Burdur), Adana (Adana, Mersin), Hatay (Hatay, Kahramanmaraş, Osmaniye), Kırıkkale (Nevşehir, Aksaray, Niğde, Kırıkkale, Kırşehir), Kayseri (Kayseri, Sivas, Yozgat), Zonguldak (Zonguldak, Karabük, Bartın), Kastamonu (Kastamonu, Çankırı, Sinop), Samsun (Samsun, Tokat, Çorum, Amasya), Trabzon (Trabzon, Ordu, Giresun, Rize, Artvin, Gümüşhane), Erzurum (Erzurum, Erzincan, Bayburt), Ağrı (Kars, Ağrı, Iğdır, Ardahan), Malatya (Malatya, Elazığ, Bingöl, Tunceli), Van (Van, Muş, Bitlis, Hakkâri), Gaziantep (Gaziantep, Adıyaman, Kilis), Şanlıurfa (Diyarbakır, Şanlıurfa), Mardin (Siirt, Mardin, Batman, Şırnak).
2 Gürsel S. and Durmaz M. (2014) “Informal Employment Decreased in the Last Eight Years”, Research Brief # 171, Bahçeşehir University Center for Social and Economic Research (BETAM)
in the public sector. Therefore, it is not surprising that the regions with the lowest informality rates are the ones with manufacturing-oriented and large-sized firms (Figure 2 and Figure 4). On the other hand, as the share of agriculture in employment increases in a region, the informality rate in this region will be inherently high due to high rate of informality in agricultural sectors.
The impact of structural determinants on informality
In order to have an idea about the impact of regional distribution of structural determinants on regional rates of informality we explore correlations between indicators for these determinants and informality rates. We limit our sample with the wage earners and exclude other employment categories because self-employed and unpaid family workers are mainly working in the sector of agriculture and hence, the rate of informality among them is quite high.
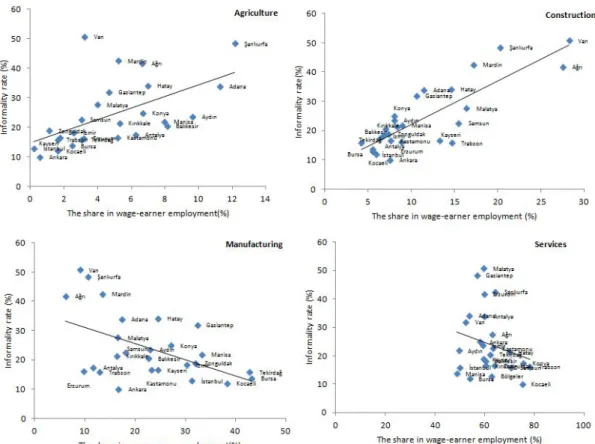
First, we study the effect of sectoral distribution of employment on regional informality rates (Figure 2). As expected, regional informality rate increases along with the employment shares of agriculture and construction, where the rate of informality is 79.5 percent and 38.6 percent respectively. The correlation coefficient for wage earners in agriculture and that in construction computed as 0.55 and 0.83 respectively. The reason for relatively low correlation coefficient computed for the agriculture is that in the regions such as Van, Mardin or Ağrı the rate of informality is high in spite of relatively low share of agriculture in regional wage earner employment.
On the other hand, coefficient on the correlation between the share of manufacturing sector and the rate of informality is negative with -0.51 as we expect. As the regional differences in industrialization will be getting smaller, regional disparities in terms of informality will be reduced. The correlation coefficient for the sector of services is also negative (-0.22) as expected, but it is quite weak. Hence, there is no significant relationship between the rate of informality and the share of services in employment. This fact implies that the regional distribution of informality is determined by other factors regarding the service sector.
Figure 2: The distribution of employment by sectors and informality (2013)
Source: TurkStat, 2013 Household Labor Survey micro dataset; BETAM
The correlation between regional level of education and regional rate of informality is negative and quite strong (-0.88) as expected. It is striking to observe relatively high level of education and hence, low rate of informality in the region of Erzurum (Figure 3). 3 Likewise, there is significant and negative
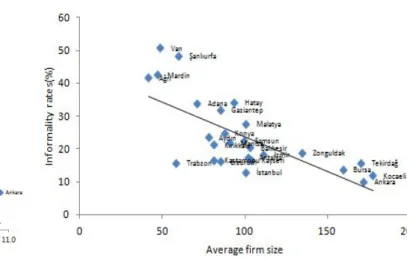
relationship between average firm size and the rate of informality (-0.70 correlation coefficient). It is not surprising that the regions with high average firm size such as Kocaeli, Ankara, Tekirdağ and Bursa are highly industrialized regions (Figure 4). 4
3 In HIA micro dataset, individuals' education level reported as the last education institution they graduated. In micro dataset, "Education" variable has seven categories as follows: below the school age (0), hasn't graduated from any institution (1), primary school (2), Junior high school and vocational junior high school (3), High school (4), Vocational or technical high school (5), University or more (6).We assume that average years of schooling for each category is 0; 3; 5; 8; 11; 11; 15 respectively.
4 Since firm numbers according to size groups in regions are not available, in order to estimate average firm size we make the following estimation. In HLS, TurkStat asks survey participants the number of employees at their current workplaces. In micro dataset, “number of employees” variable has six categories: Less than 10, 10-24, 25-49, 50-249,250-499, and 500 and more workers. In order to obtain a variable of average firm size we rely on two assumptions: 1) Middle-values in the categories of firm size are converging to average number of employees per firm. 2) For each category of firm size, its share in total number firms is approximately equal to its employment share in total employment. Under these assumptions, we can proof that average firm size in a category equals to the multiplication of middle-values and its employment share (employment /number of firms). For first five groups middle-values are 5, 17, 37, 150, and 375. For the 6th category (500+) we assumed that its middle-value is ad hoc 600 (see footnote 4). Afterwards, if we divide employment in a category within a region by total employment in this region we obtain regional share of this category of the firm size and we multiply these shares by converging average number of employees. Then, we sum these factors in order to find the estimated average firm size within a region. For example, average firm size in 2005 and in 2013 for Istanbul province are calculated as follows: In 2005 in Istanbul employment share of categories of firm size are 0.29; 0.14; 0.21; 0.31; 0.03 and 0.03 respectively. When first these weights multiplied by middle-values and then summed within Istanbul, we observe that a representative firm in Istanbul employs 85.3 workers on average. Average firm size in Istanbul increased to 100.5 workers in 2013. Thus, average firm size in Istanbul increased by 18 percent between the years of 2005 and 2013. Since we compute the correlation between changes in average firm sizes and informality rates at regional levels, we may expect that errors resulting from our assumptions are minimized.
Kaynak: 2013 Hanehalkı İşgücü Anketi mikro veri seti ; Beta
The regions with increased and decreased informality
During the period of 2005-2013, we know that overall rate of informality in Turkey decreased from 48.2 percent to 36.8 percent and the rate of informality among wage earners fell from 32 percent to 19.9 percent. While overall informality rate decreased by 23.7 percent in Turkey, it decreased by 37.7 percent for wage earners. As highlighted in previous Betam research brief, the contribution of the decline in the rate of informality for wage earners to overall decrease in informality is quite large. Note also that the distribution of improvement in informality is unequal across regions. In some regions the informality decreased by more than half and in some of them limited improvements, even in a few of them increases are recorded. The overall rate of informality decreased in 23 regions and for wage earners it decreased in 22 regions out of 26 (Figure 5).
The most successful regions at reducing the informality are Istanbul, Ankara, Bursa and Kocaeli. In these regions the rate of informality reduced by more than half. In these four regions, average firm size and average level of education significantly increased and simultaneously, the share of manufacturing in employment decreased due to the increase in the share of services (A. Table 2). Therefore, large decreases recorded in these regions are an expected finding.
Figure 4: Wage-earner informality and firm size by regions (2013)
Figure 3: Wage-earner informality and education by regions (2013)
Source: 2013 Household Labor Survey micro dataset; BETAM Source: 2013 Household Labor Survey micro dataset; BETAM
Figure 5: 2005-2013 Changes in the rate of informality within regions (%)
Source: TurkStat, 2005 and 2013 Household Labor Survey micro dataset; BETAM
The least successful regions at reducing informality among wage earners are Konya, Aydın and Malatya and in these regions the rate of informality decreased by 20.5 percent, 18.8 percent and 12 percent respectively (Figure 5). In these three regions, in these three regions changes in structural features that determine the level of informality are not the same. For example, in the region of Aydın average firm size and the share of manufacturing in employment has reduced and simultaneously the shares of agriculture and construction have increased in this region. Although average firm size has significantly increased in the regions of Malatya and Konya, average level of education has remained constant in Malatya and slightly increased in Konya. On the other hand, the share of manufacturing sector increased in these two regions. While in the region of Malatya significant decreases recorded in the employment share of agriculture, in particular in that of construction sector, in the region of Konya the share of agriculture reduced and the share of construction increased (A. Table 2). As one can observe, opposite effects exist in these two regions. Therefore, limited decreases in the rate of informality are not surprising.
In four regions informality increased: Kastamonu, Mardin, Ağrı and Van. Kastamonu has the largest change in the rate of informality with 46 percent and changes in Mardin, Ağrı and Van recorded 20.4 percent, 10.5 percent and 8 percent respectively. Increased informality in the regions of Ağrı and Van is not surprising. In fact, in Ağrı and Van regions average level of education, average firm size, the employment share of manufacturing decreased slightly and the employment share of construction substantially increased. However, there exists opposite effects in region of Mardin, where informality rate for wage earners increased by 20.4 percent. Indeed, average firm size and average level of
education increased in this region, but the employment share of manufacturing decreased while the shares of agriculture and construction increased. Although large rise in informality in the region of Kastamonu is remarkable, it is worth noting that this region is one the regions having the lowest number of informal wage earners. Indeed, the number of informal wage earners was 9 thousand over 81 thousand (11.1 percent) in 2005. In 2013 the number of wage earners expanded by 40 thousand to 121 thousand while informal wage earners increased by 20 thousand (16.4 percent). The high increase of wage informality in Kastamonu includes, indeed, a strong base effect. (A. Table 2).
Regional priorities in fighting with informality
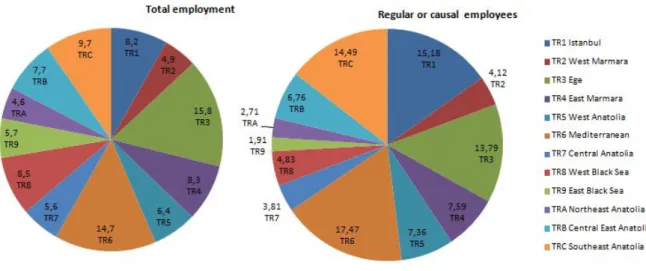
Anti-informality strategies should prioritize reducing informal employment of wage earners (involuntarily informality) for two reasons. First, wage earners constitute almost 65 percent of total employment. At the same time, public authorities' direct intervention tools such as social security contribution incentives and the capabilities of inspecting are effective and significant. In this context, when we examine the regional distribution of informal employment among wage earners, four regions are distinguished Mediterranean, Southeast, Istanbul, and Aegean. The share of these four regions in total informal wage earners reaches 61 percent (Figure 6).
Figure 6: 2013 Distribution of informal employment by regions (%) (NUTS 1)
Source: TurkStat 2005 and 2013 Household Labor Survey micro dataset; BETAM
Conclusion and recommendations
Regional distribution of informal employment is highly unequal. There is a large gap (one to five) between the lowest and the highest rates of informality. In addition, overall improvements in informality, recorded during the period of 2005-2013, are asymmetrically distributed across regions. While in some regions rates of informality reduced by more than half, in some regions deteriorations are recorded.
The main reason behind these regional disparities is that structural determinants -such as share of sectors in total employment, average level of education and average firm size- that affects the level of informal employment are largely unequally distributed across regions. An efficient way of reducing
regional disparities is to eliminate regional inequalities in terms of these structural determinants. To sum up, regional disparities in terms of informal employment will decrease as policies aiming at reducing inequalities in structural determinants across regions would be successful. It is important to design regional-specific policies aiming at reducing informal employment through reduced social security contributions. Furthermore, it is a need to consider region-specific policies aiming at fighting with informality especially in regions of Mediterranean, Istanbul, Southeast, and Aegean where almost two-third of informal wage earners exists.
Additional Tables
A. Table 1: Regional Employment and Informality (2005, 2013)
2005 2013
Regions
TOTAL EMPLOYMENT REGULAR OR CAUSAL EMPLOYMENT
Regions
TOTAL EMPLOYMENT REGULAR OR CAUSAL EMPLOYMENT
Employment (in thousands) Informal employment (in thousands) Distribution of informal employment (%) Informality ratio (%) Employment (in thousands) Informal employment (in thousands) Distribution of informal employment (%) Informality ratio (%) Employment (in thousands) Informal employment (in thousands) Distribution of informal employment (%) Informality ratio (%) Employment (in thousands) Informal employment (in thousands) Distribution of informal employment (%) Informality ratio (%) İstanbul 3708 1234 12.8 33.3 2883 866 23.7 30.1 İstanbul 4658 768 8.2 16.5 3857 494 152 12.8 Tekirdağ 529 230 2.4 43.5 291 79 2.2 27.0 Tekirdağ 692 212 2.3 30.7 456 72 2.2 15.8 Balıkesir 549 306 3.2 55.8 237 87 2.4 36.6 Balıkesir 587 243 2.6 41.4 304 62 1.9 20.4 İzmir 1059 378 3.9 35.7 743 207 5.7 27.8 İzmir 1514 460 4.9 30.4 1064 194 6.0 18.2 Aydın 915 447 4.6 48.8 433 125 3.4 28.9 Aydın 1201 532 5.7 44.3 600 141 4.3 23.6 Manisa 936 480 5.0 51.3 416 129 3.5 31.1 Manisa 1080 493 5.3 45.6 522 114 3.5 21.9 Bursa 1112 450 4.7 40.4 790 237 6.5 30.0 Bursa 1385 340 3.6 24.6 1038 142 4.4 13.7 Kocaeli 804 299 3.1 37.2 532 131 3.6 24.6 Kocaeli 1340 433 4.6 32.3 878 105 3.2 12.0 Ankara 1216 341 3.5 28.1 950 220 6.0 23.1 Ankara 1667 268 2.9 16.1 1369 137 4.2 10.0 Konya 559 245 2.5 43.8 280 88 2.4 31.3 Konya 757 333 3.6 44.0 415 103 3.2 24.9 Antalya 808 339 3.5 42.0 443 123 3.4 27.9 Antalya 1115 411 4.4 36.9 628 110 3.4 17.5 Adana 895 496 5.1 55.4 551 261 7.1 47.5 Adana 1203 529 5.6 44.0 817 276 8.5 33.8 Hatay 706 443 4.6 62.7 350 175 4.8 49.9 Hatay 893 437 4.7 49.0 536 183 5.6 34.2 Kırıkkale 414 230 2.4 55.5 163 51 1,4 31.3 Kırıkkale 510 228 2.4 44.7 261 56 1.7 21.3 Kayseri 593 284 2.9 48.0 308 86 2,4 28.0 Kayseri 762 298 3.2 39.1 414 68 2.1 16.5 Zonguldak 358 198 2.1 55.4 170 45 1,2 26.3 Zonguldak 416 218 2.3 52.3 198 37 1.1 18.8 Kastamonu 190 81 0.8 42.4 81 9 0,3 11.3 Kastamonu 263 134 1.4 50.8 121 20 0.6 16.5 Samsun 984 663 6.9 67.4 322 137 3,7 42.4 Samsun 941 450 4.8 47.8 443 100 3.1 22.6 Trabzon 1088 738 7.6 67.8 333 84 2,3 25.2 Trabzon 958 534 5.7 55.7 393 62 1.9 15.8 Erzurum 365 262 2.7 71.7 99 23 0,6 23.2 Erzurum 313 154 1.6 49.2 150 24 0.7 16.2 Ağrı 312 239 2.5 76.5 85 33 0,9 38.7 Ağrı 385 275 2.9 71.4 153 64 2.0 41.7 Malatya 356 205 2.1 57.6 170 54 1,5 31.6 Malatya 618 362 3.9 58.5 294 81 2.5 27.6 Van 362 275 2.8 76.0 122 56 1,5 45.9 Van 519 362 3.9 69.7 274 139 4.3 50.8 Gaziantep 474 279 2.9 58.9 283 135 3,7 47.7 Gaziantep 707 313 3.3 44.2 459 146 4.5 31.8 Şanlıurfa 477 373 3.9 78.2 248 165 4,5 66.4 Şanlıurfa 664 409 4.4 61.6 416 201 6.2 48.4 Mardin 296 151 1.6 51.1 154 54 1,5 35.3 Mardin 373 183 2.0 49.2 293 125 3.8 42.5 Turkey 20066 9666 100.0 48.2 11435 3658 100,0 32.0 Toplam 25524 9379 100.0 36.8 16353 3258 100.0 19.9
A. Table 2: 2005-2013 Average education, average firm size and shares of sectors in employment by regions
Regions Firm size (workers) Education (years)
Share of manufacturing in wage earner employment (%) Share of agriculture in wage earner employment (%) Share of construction in wage earner employment (%) Share of services in wage earner employment (%) 2005 2013 2005 2013 2005 2013 2005 2013 2005 2013 2005 2013 İstanbul 853 100.5 8.6 9.7 40.8 31.3 0.1 0.2 4.9 5.5 54.2 62.9 Tekirdağ 137.6 170.3 9.0 9.5 37.4 42.7 2.9 3.1 3.7 4.2 55.9 50.0 Balıkesir 66.1 103.1 8.5 9.7 20.1 22.6 13.0 8.1 10.3 7.0 56.6 62.3 İzmir 106.6 111.1 8.5 9.6 37.3 30.2 3.2 2.6 7.3 6.8 52.2 60.4 Aydın 79.7 77.8 8.4 9.0 28.7 23.0 7.6 9.6 7.2 8.0 56.5 59.4 Manisa 95.9 91.0 8.4 8.7 33.9 33.3 7.4 8.0 7.2 9.0 51.4 49.7 Bursa 137.1 159.5 8.5 9.7 50.7 43.2 2.2 2.5 6.4 5.5 40.7 48.8 Kocaeli 137.2 177.6 8.9 10.1 39.0 38.3 0.9 1.6 7.3 6.0 52.8 54.0 Ankara 130.1 171.9 10.1 10.9 16.7 16.7 0.7 0.6 7.5 7.5 75.1 75.2 Konya 64.6 87.6 8.9 9.2 23.2 27.1 7.1 6.7 7.1 8.0 62.6 58.2 Antalya 82.6 101.9 9.1 9.7 13.1 11.7 3.6 6.3 9.1 6.4 74.2 75.7 Adana 66.0 71.1 8.2 9.1 21.9 17.3 8.9 11.3 8.6 11.4 60.6 60.0 Hatay 74.0 93.3 8.2 8.7 22.8 24.5 8.9 7.0 9.8 14.6 58.6 53.9 Kırıkkale 67.3 81.2 9.4 9.8 19.5 16.3 6.7 5.3 7.3 8.4 66.5 70.0 Kayseri 101.7 104.0 9.0 10.0 27.8 24.5 2.7 1.7 10.4 13.3 59.1 60.5 Zonguldak 140.2 134.6 8.8 9.4 39.9 31.9 0.8 1.1 7.1 7.4 52.2 59.6 Kastamonu 81.0 81.1 9.4 9.7 21.5 23.2 3.0 5.2 7.2 7.6 68.3 64.0 Samsun 55.4 99.5 8.4 9.2 19.2 18.1 6.0 3.0 9.8 15.5 65.0 63.4 Trabzon 74.4 58.0 9.8 10.1 13.5 13.0 3.4 1.6 9.3 14.7 73.8 70.7 Erzurum 80.2 85.0 9.7 10.4 8.3 9.7 4.8 3.2 5.0 8.9 81.9 78.2 Ağrı 49.9 41.4 8.7 8.4 7.9 6.1 8.3 6.6 6.6 27.5 77.3 59.7 Malatya 80.0 100.5 9.3 9.3 16.3 16.6 3.3 4.0 8.1 16.4 72.3 63.1 Van 88.9 48.6 8.0 8.0 11.6 9.0 5.4 3.2 12.7 28.3 70.3 59.5 Gaziantep 72.8 85.1 7.9 8.7 37.3 32.4 4.0 4.7 12.5 10.6 46.1 52.3 Şanlıurfa 44.5 59.6 6.3 7.9 8.7 10.7 22.6 12.1 14.6 20.3 54.1 56.9 Mardin 44.3 46.7 8.8 8.7 15.5 13.5 4.2 5.2 8.6 17.2 71.6 64.1 Turkey 86.3 97.8 8.7 9.6 30.5 26.1 3.7 3.6 7.4 9.0 58.4 61.3