Physiological Measurement
Model based and experimental investigation of
respiratory effect on the HRV power spectrum
To cite this article: M Yildiz and Y Z Ider 2006 Physiol. Meas. 27 973View the article online for updates and enhancements.
Related content
Beat-to-beatcardiovascular models
Antony M Whittam, Richard H Clayton, Stephen W Lord et al.
-VLF oscillations in the power spectra of HRV during dry supine immersion and exposure to non-hypoxic hypobaria
K K Tripathi
-Quantification of respiratory influence on LV
Enrico G Caiani, Maurizio Turiel, Sabrina Muzzupappa et al.
-Recent citations
Normative Values for Heart Rate Variability Parameters in School-Aged Children: Simple Approach Considering Differences in Average Heart Rate
Jakub S. Gsior et al
-A.P. Carll et al
-Heart rate variability to monitor performance in elite athletes: Criticalities and avoidable pitfalls
Daniela Lucini et al
Physiol. Meas. 27 (2006) 973–988 doi:10.1088/0967-3334/27/10/004
Model based and experimental investigation of
respiratory effect on the HRV power spectrum
M Yildiz1,3and Y Z Ider2
1Department of Electrical and Electronics Engineering, Graduate School of Natural and Applied
Sciences, Selcuk University, Konya, Turkey
2Department of Electrical and Electronics Engineering, Bilkent University, Ankara, Turkey
E-mail:[email protected]@ee.bilkent.edu.tr
Received 30 March 2006, accepted for publication 6 July 2006 Published 1 August 2006
Online atstacks.iop.org/PM/27/973
Abstract
The role of respiration in the genesis of heart rate variability (HRV) has been the subject matter of many experimental and modeling studies. It is widely accepted that the high frequency (HF) peak of a HRV power spectrum, which is centered at the average respiratory frequency, is caused by mechanisms activated by respiration. On the other hand, there is a debate on the possible role of respiration in the genesis of the low frequency (LF) peak which is usually centered around 0.1 Hz. In this study, a comprehensive cardiorespiratory interaction model is used to test various hypotheses regarding the role of respiration in the LF peak of HRV. In this model, chest and abdomen circumference signals and lung volume signal are used as respiratory inputs. Simulations are made for periodic, spontaneous and slightly irregular respiratory patterns, and it is observed that the more low frequency (LF) power there in the respiratory signals, the more LF power there in the model-predicted HRV. Experiments on nine volunteers are also performed for the same respiratory patterns and similar results are observed. Furthermore, the actual measured respiratory signals are input to the model and the model predicted and the actual HRVs are compared both in time domain and also with respect to their power spectra. It is concluded in general that respiration not only is the major contributor to the genesis of the HF peak in the HRV power spectrum, but also plays an important role in the genesis of its LF peak. Thus, the LF/HF ratio, which is used to assess sympathovagal balance, cannot be correctly utilized in the absence of simultaneous monitoring of respiration during an HRV test.
Keywords: autonomic nervous system, baroreflex, computer modeling, heart rate variability, hemodynamics, power spectral density, respiration
3 Vocational School of Technology, Baskent University, Ankara, Turkey.
1. Introduction
Heart rate variability (HRV) analysis is a non-invasive research and clinical tool for indirectly investigating the cardiac and autonomic nervous systems, in both health and disease (ESC/NASPE Task Force1996, Friedman et al 2002, Gang and Malik 2003, Miller et al 2004, Kleiger et al2005). The power spectral density (PSD) of the HRV signal is used to determine the relative powers of sympathetic and vagal autonomic nervous system activities. The power spectrum of a short-term HRV signal usually reveals three spectral components: a very low frequency component (VLF: 0–0.04 Hz) which may be associated with humoral and thermal control or vasomotion; a low frequency component (LF: 0.04–0.15 Hz) associated with sympathetic and vagal activity; and a high frequency component (HF: 0.15–0.4 Hz) associated mostly with vagal activity. The LF/HF ratio which is the ratio of powers in LF and HF regions is used as a measure of sympathovagal balance (ESC/NASPE Task Force1996, Friedman et al2002, Gang and Malik2003, Miller et al2004, Kleiger et al2005).
There are many studies on the role of respiration in the genesis of HRV. Effects of parameters such as respiratory frequency, tidal volume, expiration/inspiration time ratio and respiratory dead space have been studied (Saul et al 1989, Pitzalis et al 1998, Schipke
et al 1999, Strauss-Blasche et al 2000, Bernardi et al2000, 2001, Poyhonen et al 2004,
Tripathi 2004). In general, there is consensus on the idea that respiration is the main contributor to the generation of the HF peak of HRV PSD. On the other hand, these studies indicate that respiratory parameters can also affect the LF peak. In fact, Bernardi et al (2001) have claimed that in the absence of simultaneous analysis of respiration, the changes in the LF/HF ratio should not be taken as a clear evidence of changes in sympathovagal balance. In order to incorporate respiration into the interpretation of HRV PSD, one must look closely into the mechanisms of interaction between respiration and the heart rate control system. Despite many past studies, the precise physiological mechanisms of LF and HF components of HRV and their relation to respiration are still being debated (Bernardi et al2001, Tripathi2004).
Respiration-induced heart rate variation in the respiratory frequency range is called respiratory sinus arrhythmia (RSA). According to some studies, mostly based on evidence from anesthetized animals, RSA originates from respiration-entrained oscillations in medullary neuron firing rates, the so-called central oscillator theory (as reviewed by Bernardi et al (2001), Malpas (2002) and Cohen and Taylor (2002)). Another theory suggests that respiration-synchronous fluctuations in intra-thoracic pressure provoke fluctuations in venous return and stroke volume which contribute to arterial pressure variability at the respiratory frequency. Presumably, these arterial pressure fluctuations provoke parallel changes in arterial baroreflex afferent activity, and thus generate RSA by appropriately increasing and decreasing cardiac vagal outflow (Cohen and Taylor 2002). Additionally, cardiopulmonary or lung stretch receptors which are called low-pressure baroreceptors may contribute to the origination of RSA (Bernardi
et al2001, Cohen and Taylor2002). Thus, it is not surprising that given the almost periodic
behavior of respiration at a frequency in the range of the HF band, an HF peak in the HRV PSD is observed.
Considering the LF oscillations in HRV, the situation is more complicated. LF oscillations in arterial pressure, with a period of about 10 s for human, are called Mayer waves. Mayer waves may exhibit themselves as short damped oscillations as well as in a sustained form. The hypothesis that arterial pressure Mayer waves result from rhythmic, sympathetic vasomotor activity and generate RR interval oscillations at the same frequency through the baroreflex has been widely accepted until recently (Cohen and Taylor 2002). Two other possible
mechanisms have been proposed to explain LF oscillations in arterial pressure and the RR interval. One of them is the central theory according to which a centrogenic rhythm in the brain stem is responsible for them (Seydnejad and Kitney2001, Malpas2002). The other one which is relatively more dominant is often termed the baroreflex feedback theory. In this proposal, a change in blood pressure, due to some perturbation, is sensed by arterial baroreceptors, and accordingly, the central nervous system adjusts the peripheral vascular resistance and the heart rate in order to normalize the pressure back. Peripheral resistance control in response to arterial pressure change is mediated through the sympathetic autonomic outflow which is delayed by about 3–10 s. This delay causes an oscillatory (about 0.1 Hz) normalization of pressure following a perturbation. Control of the heart period is mediated by both vagal and sympathetic pathways, and the vagal response is much faster (<1 s). Therefore, the oscillations in arterial pressure at about 0.1 Hz are also observed in the RR interval.
Baroreflex feedback theory for the generation of LF components in HRV may offer an explanation for the possible role of respiration in the LF band. Average respiratory frequency in a normal resting person is in the HF band. However, it is known that respiration is not perfectly periodic and even a resting person experiences irregular breathing due to several factors (Saul
et al1991, Ecberg2003). Therefore, the influence of respiration on blood pressure and HRV
would not be expected to be only in the HF band but also at other frequencies to be observed in the power spectrum of a recorded respiratory signal, e.g. respiratory volume. Since the baroreflex feedback system has its maximum gain at its natural frequency (Vielle2005), i.e. at about 0.1 Hz, the effect of respiration will be more profound if it has frequency components in the LF band.
Several investigators have included respiratory signals into their models which attempt to explain HRV and blood pressure (BP) oscillations (de Boer et al1987, Madwed et al1989, Ursino and Magosso2003). In these models respiration is taken as a periodic simulated signal, the purpose of which is viewed as generating the HF component in HRV and BP. These models add some extra LF noise sources to BP and/or peripheral resistance to generate LF peaks in the PSDs. Whittam et al (2000) have incorporated measured chest wall movement signal into the beat-to-beat de Boer model, mainly for the purpose of obtaining a correct HF frequency in the PSD of HRV and BP. They have not analyzed the PSD of the respiratory signal that they have input to their model. However, it is evident from the foreground discussion that the PSD of the respiratory signal must also be calculated in order to test any hypothesis regarding the contribution of the respiratory LF power to the HRV LF power. The purpose of this study is to investigate respiratory effects on HRV by comparative analysis of the PSDs of real respiratory and HRV signals and also by a model-based approach incorporating a suitable real measured respiratory signal as model input.
In this study, Ursino and Magosso’s (2003) cardiovascular system (CVS) model, which also includes mechanisms of respiration–CVS interactions, is used to investigate effects of respiration on the power spectrum of HRV. This respiration–CVS model is a very comprehensive differential equation based nonlinear model. Ursino and Magosso have used simulated periodic intra-thoracic and abdominal pressures as the respiratory inputs to their model. In this study, however, chest and abdomen circumference signals are recorded simultaneously with ECG and are incorporated into the Ursino and Magosso model. The predictions of the model regarding HRV are compared with the actual HRV calculated from the ECG, both in time and frequency domains. The effects of respiration on HRV PSD and various hypotheses regarding the mechanisms of interaction are discussed in view of these results.
2. Materials and methods
2.1. Respiration–CVS interaction model
A comprehensive mathematical respiration–CVS model that is developed by Ursino and Magosso (2003) is used in this study. In this model, all model parameters are determined based on physiological data from the literature. Data from humans are used whenever possible. The model has the pulsating heart as modeled by passive atriums and active ventricles. Contraction of a ventricle is simulated by means of a varying elastance in series with a time-varying resistance. It includes the systemic (splanchnic and extrasplanchnic) and pulmonary circulations, arterial baroreceptors and the sympathetic and vagal efferent branches of the autonomic nervous system. In addition, there exists a uniformly distributed low frequency noise below 0.12 Hz (such as those caused by humoral and thermal control or vasomotion) superimposed on the expression of extrasplanchnic systemic resistance. This noise source is not included in our studies when only the effect of respiration is sought for.
In the Ursino and Magosso model, respiration effect on CVS is modeled via two mechanisms. The first one incorporates the mechanical effect of respiration on venous return and cardiac output through intra-thoracic pressure and also on splanchnic circulation through abdominal pressure. The second one incorporates the neural feedback via the lung stretch receptors which controls peripheral resistance and heart period. In the Ursino and Magosso model, simulated periodic intra-thoracic and abdominal pressures are used as respiratory inputs.
Ursino and Magosso (2003) have performed sensitivity analyses on the gains of the feedback mechanisms and suggest that the HF peak on HRV power spectrum is mainly affected by the vagal mechanism and also that the LF peak on the HRV power spectrum is increased by a high sympathetic gain and reduced by a high vagal gain. In addition, they have shown that the LF peak located around 0.1 Hz in the spectrum is the result of the additional noise imposed on extrasplanchnic resistance.
We have implemented the Ursino and Magosso model using Matlab and have used the Euler method for the solution of the differential equations, with a step size of 0.001 s. The sensitivity analyses in the Ursino and Magosso (2003) study are repeated to validate our Matlab codes.
2.2. Recording system and records
To record chest circumference, abdomen circumference, airway flow and ECG, the BIOPAC MP30 Physiological Recording System is used. Circumference signals are measured by respiratory effort transducers which are displacement transducers held by elastic bands which go around the chest and abdomen. Lung volume variation is obtained by integrating airflow transducer output and these data are used to show the relationship between lung volume and chest circumference signals. All signals are sampled at the rate of 1 kHz with an A/D conversion resolution of 12 bits.
Recordings are made from nine healthy volunteers, seven males and two females, with a mean age of 28 years and a mean weight of 72 kg. All recordings are performed between 11:00 and 17:00 h and 3–4 h after the last meal. Each subject is first informed about the experimental procedure, is let to rest for about 10 min in the supine position while the MP30 is attached, and then a 10 min recording is made. Within the 10 min recording period, during the first 5 min the subject experiences spontaneous regular breathing (SRB). During the second 5 min the subject is asked to occasionally breathe irregularly. During this slightly irregular breathing (SIB), the respiratory signals are slightly more non-periodic.
With volunteer 1, paced (periodic) respiration experiments are also performed. The subject is asked to breathe in synchrony with a computer-generated display in which the height of a vertical red bar increases during inspiration and decreases during expiration, with unity inspiration/expiration time ratio.
2.3. Signal processing
The raw HRV signal is obtained from the recorded ECG by finding the QRS positions, using an algorithm known to be immune to noise, to calculate the time variation of the RR interval (Freisen et al1990). The HRV thus obtained is called the ‘real-HRV’. The Ursino and Magosso model finds the heart beat instances by using an integrate-and-fire block in response to efferent vagal and sympathetic inputs. From these heart beat instances, RR intervals are calculated and the ‘model-HRV’ is obtained. Both the real-HRV and model-HRV are then sampled at 2 Hz using linear interpolation.
Yule-Walker autoregressive (AR) method (PYULEAR function of Matlab) with model order of 25 is used to calculate the power spectral estimates of the HRV signals after removing their dc values. Power spectral estimates of the respiratory signals are also obtained using the same AR method after downsampling to 2 Hz and dc removal. Methods of spectrum estimation for HRV signals are reviewed in ESC/NASPE Task Force report (1996). It is stated that for short HRV records parametric spectral estimation methods, such as the AR method used in this study, are advantageous because they yield smoother spectral components and provide easy identification of the central frequency of each component. The basic disadvantage of the parametric methods is the need for the determination of a model order suitable for the data at hand. AR model order of 15 is used in the ESC/NASPE Task Force review, but considering the irregular breathing cases and also the respiratory signals we have found that a model order fixed at 25 yields the best results in terms of smoothness and identification of major peaks.
For finding the cross correlation coefficient between various signals, the CORRCOEF function of Matlab is used after dc removal. For statistical analyses the paired student t-test is used.
3. Results
3.1. Model simulations to assess the relation of respiration to the genesis of the LF component of HRV PSD
The Ursino and Magosso model includes mechanisms to explain respiration–CVS interactions. We first analyzed by simulations whether and to what extent these mechanisms contribute to the LF band of HRV PSD. In the Ursino and Magosso model a 0–0.12 Hz noise source is superposed on the extrasplanchnic resistance to generate the LF component of HRV PSD. In order to assess the influence of respiration alone we have excluded this noise source from the model (if not otherwise mentioned). We have used the basal values for the parameters of the model.
3.1.1. Response of the model to simulated periodic breathing. Ursino and Magosso have
simulated respiration by generating and applying to the model the simulated periodic intra-thoracic and abdominal pressure signals at a frequency of 0.25 Hz. We have applied these same signals for 24 different frequencies from the beginning of the LF frequency region to the end of the HF frequency region.
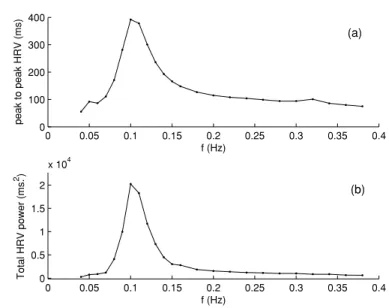
0 0.05 0.1 0.15 0.2 0.25 0.3 0.35 0.4 0 100 200 300 400 f (Hz) peak to peak HRV (ms) 0 0.05 0.1 0.15 0.2 0.25 0.3 0.35 0.4 0 0.5 1 1.5 2 x 10⁴ f (Hz) Total HRV power (ms. 2 ) (a) (b)
Figure 1. Ursino and Magosso model predictions for simulated periodic breathing for 24 different frequencies. (a) Peak-to-peak HRV. (b) Total power of HRV.
Table 1. Ursino and Magosso model predictions for simulated periodic breathing for six different frequencies.
Respiration frequency (Hz)
0.05 0.10 0.15 0.2 0.24 0.3
Peak-to-peak HRV (ms) 92.2 392 166 115 104 94
Total HRV power (ms2) 763 20 236 3031 1567 1225 1013
Total respiration power (mmHg2) 2.76 2.71 2.66 2.64 2.66 2.52
In table1, the applied respiration frequency, peak-to-peak HRV, HRV total power and the total power of thoracic pressure variation are shown. It is observed that while the total power of thoracic pressure remains almost the same for all frequencies, the peak-to-peak HRV and HRV total power depict maximal responses at about 0.1 Hz. The same phenomenon is observed also in the graphs of figure1. While the peak-to-peak HRV is 104 ms at 0.24 Hz which can be viewed as a normal respiration frequency (15 breaths min−1), it is 392 ms at 0.1 Hz. Similarly, the HRV total power is 1225 ms2at 0.24 Hz, and is 20 236 ms2at 0.1 Hz. Thus, at 0.1 Hz, the peak-to-peak HRV is approximately 4 times, and the HRV total power is approximately 17 times that of their respective values at 0.24 Hz.
From table1and figure1it can be speculated that if respiration signals have components around 0.1 Hz, then LF variations in HRV can be observed even in the absence of the 0–0.12 Hz noise source of the Ursino and Magosso model which is meant to represent humoral, thermal and vasomotor variations that effect peripheral resistance and thereby generate the LF component. Next set of simulations investigate this hypothesis.
3.1.2. Response of the model to simulated non-periodic breathing. It is known that normal
(or spontaneous) breathing is not perfectly periodic, and therefore possibly has components covering a certain frequency range. To simulate this situation we produced intra-thoracic and
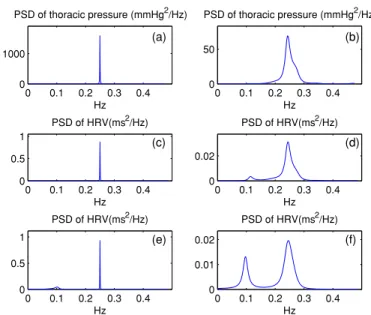
0 0.1 0.2 0.3 0.4 0 0.5 1 PSD of HRV(ms2/Hz) Hz 0 0.1 0.2 0.3 0.4 0 0.02 PSD of HRV(ms2/Hz) Hz 0 0.1 0.2 0.3 0.4 0 0.5 1 PSD of HRV(ms2/Hz) Hz 0 0.1 0.2 0.3 0.4 0 0.01 0.02 PSD of HRV(ms2/Hz) Hz 0 0.1 0.2 0.3 0.4 0 1000 PSD of thoracic pressure (mmHg2/Hz) Hz 0 0.1 0.2 0.3 0.4 0 50 PSD of thoracic pressure (mmHg2/Hz) Hz (a) (b) (c) (d) (e) (f)
Figure 2. (a)–(b) PSD of simulated intra-thoracic-pressure signals for periodic and non-periodic breathing, respectively. (c)–(d) PSD of HRV for periodic and non-periodic breathing, respectively, without extrasplanchnic noise source added. (e)–(f) PSD of HRV for periodic and non-periodic breathing, respectively, with extrasplanchnic noise source added.
abdominal pressures which are not totally periodic but the period of which change randomly between 5 s (0.2 Hz) and 3 s (0.33 Hz). For this purpose at the end of each respiratory period, the value of the next period is calculated by adding a random number, uniformly distributed between−1 and 1, to 4 s. Inspiration and expiration times are kept in proportion during this process. We have named this situation, non-periodic breathing, and have compared its corresponding HRV PSD with that of periodic breathing at 0.25 Hz (normal breathing of 4 s period, or 15 breaths per minute). Results are shown in figure2.
As observed from figures2(a) and (b), while the PSD of intra-thoracic pressure is sharp, narrow and confined to the HF region only for the case of periodic breathing, it is spread out and extends into the LF region for the case of non-periodic breathing. In line with this observation, it is also observed from figures2(c) and (d) that, while the PSD of HRV does not have any LF component in the case of periodic breathing, it has a significant LF component in the case of non-periodic breathing. Thus it can be conjectured that the LF component of HRV PSD arose as a consequence of the LF components of the respiration signal. Although the LF energy of non-periodic breathing is still comparatively low, we know from figure1that the sensitivity of the system to LF energy of respiration is significantly high.
In reality, LF region HRV spectral power cannot arise from respiration effect only. To investigate this condition, and for the sake of completeness, we have repeated the simulations for when the 0–0.12 Hz extrasplanchnic resistance noise is also included. With the addition of this noise source, for the case of periodic breathing an LF component appears, and for the case of non-periodic breathing the LF component is enhanced, as shown in figures2(e) and (f). The HRV PSD obtained with the extrasplanchnic noise together with the effect of non-periodic breathing (figure2(f)) is more realistic in terms of appearance and LF/HF ratio. In any case we draw from figure2 that a significant portion of LF peak on the HRV PSD can arise as a consequence of the LF power of non-periodic breathing which is in fact a more realistic situation as compared to strictly periodic breathing.
3 4 5 6 7 8 9 10 11 x 104 ms – 0.15 – 0.1 –0.05 0 0.05 0.1 0.15
Lung Volume Curve
Respiratory Effort Transducer Output
Figure 3. Comparison of lung volume and chest effort transducer output (arbitrary units).
3.2. Incorporation of chest and abdominal circumference signals into the model
To demonstrate experimentally that the respiration LF component is a significant contributor to the HRV LF component, one needs to look at the PSD of real respiration signals. Furthermore if actual respiratory signals could be measured and used as an input to the model, then the HRV obtained as a model output could be compared with the actual measured HRV to provide further evidence for various hypotheses.
Respiratory signal inputs of the Ursino and Magosso model are intra-thoracic and abdominal pressures. There is no non-invasive and clinically feasible method for measuring these pressures. As to the use of lung volume to monitor respiration, it is well known that the use of an oro-nasal mask or a mouthpiece for spirometric measurement of lung volume can affect the breathing pattern and may also alter the HRV by inducing stress in the patient and also by triggering ventilatory responses to chemostimuli (Hirsch and Bishop1982, Furutani
et al1997). Respiratory monitoring by respiratory effort transducers, on the other hand, is
non-invasive, easy to use and non-stress inducing.
Figure3shows the chest circumference signal and the lung volume variation from the same patient, in which the lung volume variation is obtained by integrating the spirometric transducer output. In figure3, the signals are scaled and offset to fit each other to emphasize the correlation between their temporal variations. Cross correlation between the two signals is found to be 0.96.
Since it is empirically accepted (Ursino and Magosso,2003) that the lung volume and intra-thoracic pressure are related through the equation
VL= 1.9 − 0.1 × PT, (1)
where VLis the lung volume (L) and PT is the intra-thoracic pressure (mmHg), it is concluded
that the chest circumference signal variations can be successfully substituted for intra-thoracic pressure variations. It is known and also expressed by Ursino and Magosso that the intra-thoracic signal varies between−4 mmHg and −9 mmHg during normal breathing. Therefore prior to applying the thoracic circumference signal to the model, we have scaled it and have applied appropriate offset to bring it to the range of intra-thoracic pressure signals. This
scaling and offsetting is applied using a segment of data where respiration appears to be normal without excessive deviations.
Similar relationship may be speculated to exist between abdominal circumference and abdominal pressure signals. We have used the measured abdominal circumference signal as a substitute for the abdominal pressure, with scaling and offsetting to bring it to the normal range of 0 mmHg to−2 mmHg. Although we do not have a method to assess to what extent this procedure is valid, we have nevertheless studied the relative contributions of abdominal pressure and intra-thoracic pressure to the HRV.
The contribution of the intra-thoracic signal alone (while the abdominal pressure is kept at the end-expiration pressure level of 0 mmHg) to peak-to-peak change in HRV amplitude is 103.5 ms, while the contribution of the abdominal pressure alone (intra-thoracic signal is kept constant at the−4 mmHg end-expiratory level) is 20.6 ms. Thus the contribution of the abdominal pressure to peak-to-peak HRV is 20% that of the intra-thoracic signal. Considering the power spectrum, the ratio of these contributions would be 4%. Thus even if our speculation regarding the substitution of abdominal circumference for abdominal pressure is not properly justified, this would not in any case result in significant error in model-HRV.
3.3. Comparison of the real-HRV with the model-HRV obtained using real respiratory signals as input
Chest circumference, abdominal circumference and ECG are recorded from nine volunteers as described in the methods section. The chest and abdominal circumference signals are scaled and offset as explained in section3.2, to obtain the intra-thoracic and abdominal pressure signals. The lung volume is calculated from equation (1). The model-HRV is then derived from the model using these signals as input, and the real-HRV is derived from the recorded ECG.
3.3.1. Paced respiration. Paced respiration experiments at 0.1, 0.15, 0.2 and 0.25 Hz were
performed with volunteer 1. Power spectral densities of real-HRV, model-HRV, and intra-thoracic pressure for 0.1 Hz and 0.25 Hz paced respirations are shown in figure4.
It is observed that both HRVs have well-defined single spectral components at exactly the respiration frequency. Real and model HRV powers are given in table2. Total powers of both HRVs are maximum at 0.1 Hz, and they decrease as the respiratory frequency is increased. The dependence of the model-HRV power to respiration frequency is similar to what is observed for simulated periodic breathing in section3.1.1. The real-HRV power also has a similar frequency dependence, except that the gain of the real system to respiratory input is lower around 0.1 Hz compared to the gain of the model.
3.3.2. Spontaneous regular and slightly irregular breathing. The Model-HRV and real-HRV
of one volunteer are compared in figure 5(a) for a 100 s interval during which the person experiences spontaneous regular breathing. The measured chest circumference signal is also sketched with appropriate offset on the same figure for comparison. The two HRV signals are seen to be correlated temporally with the chest circumference signal especially with respect to fast variations (HF); both HRV signals fall during inspiration and rise during expiration. Both HRVs do not have significant LF components. However during another 100 s which is selected from the second half of the 10 min recording, respiration is ‘slightly irregular’, as shown in figure5(b). Respiration therefore has frequency components at lower frequencies as well. Again the model and real HRVs are temporally correlated and not only in terms of HF variations but also in terms of LF variations. For the waveforms in figure5, the cross
0 0.1 0.2 0.3 0.4 0.5 0 0.1 0.2 0.3 0.4 PSD of real HRV(s2/Hz) 0 0.1 0.2 0.3 0.4 0.5 0 0.1 0.2 0.3 0.4 PSD of model HRV(s2/Hz) 0 0.1 0.2 0.3 0.4 0.5 0 100 200 300 PSD of Resp.(mmHg 2/Hz) freq.( Hz ) 0 0.1 0.2 0.3 0.4 0.5 0 0.5 1 PSD of real HRV(s 2 /Hz) 0 0.1 0.2 0.3 0.4 0.5 0 2 4 6 PSD of model HRV(s 2/Hz) 0 0.1 0.2 0.3 0.4 0.5 0 100 200 300 PSD of Resp.(mmHg 2 /Hz) freq.( Hz )
Figure 4. PSDs of real-HRV, model-HRV and respiration (intra-thoracic pressure) for volunteer 1 with 0.1 Hz (left column) and 0.25 Hz (right column) paced respiration.
Table 2. Real- and model-HRV powers for paced respiration of volunteer 1. Respiration frequency (Hz)
0.1 0.15 0.2 0.25
Real-HRV power (ms2) 9194 4294 2690 1131
Model-HRV power (ms2) 22 204 3839 1484 894
Total respiration power (mmHg2) 3.44 3.28 2.93 2.35
correlation between real-HRV and model-HRV waveforms is 0.88 and 0.8 for SRB and SIB, respectively. When all nine volunteers are considered, the same cross correlation is 0.75± 0.1 (sd) for SRB, and 0.69± 0.09 (sd) for SIB. Thus the respiration–CVS interaction mechanisms, incorporated into the model, appear to account for the LF variations in HRV to a significant degree.
To more quantitatively analyze the effect of respiration, the PSDs of model-HRV, real-HRV and the intra-thoracic pressure signal are calculated for two 150 s periods for each volunteer. One 150 s period is selected from the SRB region and the other is selected from the SIB region. PSDs for two volunteers are drawn in figure6, and LF and HF powers obtained from the PSDs of all volunteers are given in tables3and4.
It is observed in general that during SRB the intra-thoracic pressure signal has a significant and sharp HF peak in the spectrum, while its LF power is small. However during SIB the HF peak gets blunted and a significant power leaks into the LF region. Thus, on the average, during
150 160 170 180 190 200 210 220 230 240 600 650 700 750 800 850 900 950 1000 1050 1100 Time (s) (a.u) Real HRV Model HRV Intra-thoracic Pressure (a) 350 400 450 650 700 750 800 850 900 950 1000 1050 1100 1150 Time (s) (a.u) Real HRV Model HRV Intra-thoracic Pressure (b)
Figure 5. (a)–(b) Comparison of 100 s model-HRV (dashed line), real-HRV (thin continuous line) and intra-thoracic pressure (thick continuous line) derived from the chest circumference signal, with regular spontaneous, and slightly irregular respiration, respectively. (Unit of the vertical axis scale is ms for the model-HRV. Otherwise the units are arbitrary (au).)
SRB, the HF power of respiration (PHF-Resp) is 1.97 mmHg2, and its LF power (PLF-Resp) is 0.038 mmHg2, while during SIB P
HF-Resp= 1.95 mmHg2and PLF-Resp= 0.355 mmHg2. Thus, PHF-Respis not different between SRB and SIB (p= 0.47), and PLF-Respincreases significantly during SIB as compared to SRB (p= 0.004). In parallel to these observations the LF/HF ratio for respiration increases from 0.021 to 0.20 when respiration is slightly irregular as compared to being spontaneous regular (p= 0.003).
In parallel to the appearance of some respiratory signal power in the LF region, we observe similar changes in both the model-HRV and real-HRV power spectra. In the power spectra of real-HRVs, PLFis 467 ms2during SRB, and is 1122 ms2during SIB, on the average
0 0.1 0.2 0.3 0.4 0 0.02 0.04 0.06 Volunter1 RSB 0 0.1 0.2 0.3 0.4 0 50 100 0 0.1 0.2 0.3 0.4 0 0.02 0.04 0.06 Volunter1 SIB 0 0.1 0.2 0.3 0.4 0 50 100 0 0.1 0.2 0.3 0.4 0 0.05 Volunter4 RSB PSD of HRVs PSD of HRVs 0 0.1 0.2 0.3 0.4 0 20 40 PSD of PT PSD of PT f (Hz) 0 0.1 0.2 0.3 0.4 0 0.05 Volunter4 SIB 0 0.1 0.2 0.3 0.4 0 20 40 f (Hz) (a) (h) (g) (f) (e) (d) (c) (b)
Figure 6. (a) Model (dashed thick line) and real (solid line) of HRV PSDs of volunteer 1 for regular spontaneous breathing (RSB). (b) Same as in (a) for slightly irregular breathing (SIB). (c) PSD of intra-thoracic pressure (PT) of volunteer 1 for RSB. (d) Same as (c) for SIB. (e)–(h)
Same as (a)–(d) for volunteer 4.
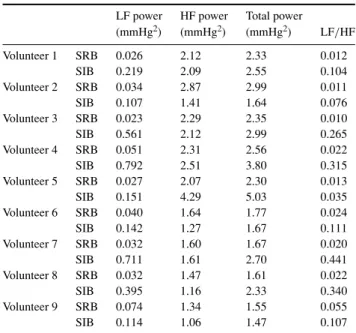
Table 3. Intra-thoracic pressure PSD parameters.
LF power HF power Total power
(mmHg2) (mmHg2) (mmHg2) LF/HF Volunteer 1 SRB 0.026 2.12 2.33 0.012 SIB 0.219 2.09 2.55 0.104 Volunteer 2 SRB 0.034 2.87 2.99 0.011 SIB 0.107 1.41 1.64 0.076 Volunteer 3 SRB 0.023 2.29 2.35 0.010 SIB 0.561 2.12 2.99 0.265 Volunteer 4 SRB 0.051 2.31 2.56 0.022 SIB 0.792 2.51 3.80 0.315 Volunteer 5 SRB 0.027 2.07 2.30 0.013 SIB 0.151 4.29 5.03 0.035 Volunteer 6 SRB 0.040 1.64 1.77 0.024 SIB 0.142 1.27 1.67 0.111 Volunteer 7 SRB 0.032 1.60 1.67 0.020 SIB 0.711 1.61 2.70 0.441 Volunteer 8 SRB 0.032 1.47 1.61 0.022 SIB 0.395 1.16 2.33 0.340 Volunteer 9 SRB 0.074 1.34 1.55 0.055 SIB 0.114 1.06 1.47 0.107
SRB= spontaneous regular breathing, SIB = slightly irregular breathing.
(significantly different with p < 0.001), indicating a 3.03-fold increase (pairwise). HF power does not change much between SRB and SIB being 840 ms2 and 997 ms2, respectively
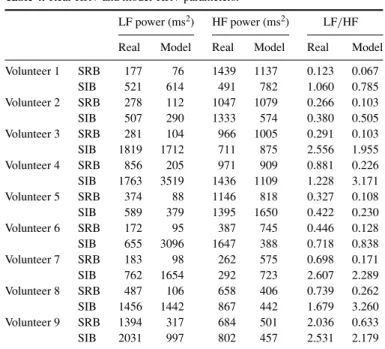
Table 4. Real-HRV and model-HRV parameters.
LF power (ms2) HF power (ms2) LF/HF
Real Model Real Model Real Model
Volunteer 1 SRB 177 76 1439 1137 0.123 0.067 SIB 521 614 491 782 1.060 0.785 Volunteer 2 SRB 278 112 1047 1079 0.266 0.103 SIB 507 290 1333 574 0.380 0.505 Volunteer 3 SRB 281 104 966 1005 0.291 0.103 SIB 1819 1712 711 875 2.556 1.955 Volunteer 4 SRB 856 205 971 909 0.881 0.226 SIB 1763 3519 1436 1109 1.228 3.171 Volunteer 5 SRB 374 88 1146 818 0.327 0.108 SIB 589 379 1395 1650 0.422 0.230 Volunteer 6 SRB 172 95 387 745 0.446 0.128 SIB 655 3096 1647 388 0.718 0.838 Volunteer 7 SRB 183 98 262 575 0.698 0.171 SIB 762 1654 292 723 2.607 2.289 Volunteer 8 SRB 487 106 658 406 0.739 0.262 SIB 1456 1442 867 442 1.679 3.260 Volunteer 9 SRB 1394 317 684 501 2.036 0.633 SIB 2031 997 802 457 2.531 2.179
SRB= spontaneous regular breathing, SIB = slightly irregular breathing.
(p = 0.22). Similarly the LF/HF ratio increases 3.37-fold in real-HRVs during SIB as compared to SRB (p= 0.007).
In the power spectra of model-HRVs, PLFis 134 ms2during SRB, and is 1523 ms2during SIB, on the average (significantly different with p= 0.003), indicating a 12.7-fold increase (pairwise). The HF power does not change much between SRB and SIB being 797 ms2and 778 ms2, respectively (p= 0.44). Similarly the LF/HF ratio increases 9.7-fold in model-HRVs during SIB as compared to SRB (p= 0.0015).
4. Conclusions and discussion
The results that we have presented in figure1regarding the dependence of HRV peak-to-peak value and HRV total power to the frequency of breathing, obtained using the Ursino and Magosso model, are parallel to several earlier experimental studies. Angelone and Coulter (1964) have obtained a similar graph between respiratory frequency and peak-to-peak HRV in their paced respiration experiments. They have shown that the peak–peak HRV increases from 133 ms to 416 ms when the respiratory frequency is decreased from 0.2 Hz to 0.1 Hz, respectively. This 3.12-fold increase is close to the 3.4-fold increase we have found from model simulations. Similarly the results of experimental transfer function studies of Saul
et al (1989) using broadband respiratory input yield a very similar dependence of HRV to
respiratory frequency both in pattern and quantitative values. Similar results are obtained by Brown et al (1993) and Ritz et al (2001). We have also performed paced respiration experiments with volunteer 1. For this particular subject, in going from 0.2 Hz to 0.1 Hz, the p–p HRV increased roughly 2-fold.
In figure 2 we have shown that, if the 0–0.12 Hz LF noise source is excluded, with periodic breathing the model does not yield the HRV LF power, whereas the LF
power appears when respiration is slightly non-periodic. Similarly in SRB and SIB experiments we observed an increased LF in both real- and model-HRVs in parallel with the LF power increase in respiration. We therefore maintain the idea that irregularities in respiration are significant contributors to the HRV LF power in addition to possible LF perturbations due to humoral, thermal and vasomotor factors. Although previous experimental studies (Saul et al1989, Pitzalis 1998, Schipke et al1999, Strauss-Blasche et al 2000, Bernardi et al2000, 2001, Poyhonen et al 2004, Tripathi 2004) have also reported that respiration contributes to the HRV LF power, our study shows in addition that the mechanisms of interaction between respiration and the cardiovascular system as included in the Ursino and Magosso model are strong contributors to the respiration-induced LF power in HRV.
We have observed that measurements of chest and abdominal circumference signals do not induce stress in the volunteers. Bernardi et al (2000) have used an inductive pneumograph to monitor respiration in their experimental studies. Saul et al (1989) have used two-belt chest-abdomen inductance plethysmograph for respiratory measurement. They have converted this signal to lung volume through a calibration procedure, and have used this signal for their transfer function study. Blasche et al (2000) have also used respiratory effort transducers similar to those we have used. They have used these signals to determine respiratory frequency and relative timing of inspiration and expiration. Whittam et al (2000) have used chest wall movement using a magnetometer, and they have incorporated their beat-to-beat measurements (at each heart beat) into the beat-to-beat de Boer model of CVS. To our knowledge there is no previous study in which a continuous respiratory signal is incorporated into a continuous model which has detailed mechanistic components to explain the respiratory influence on HRV.
The Ursino and Magosso model uses respiration as an input, thus implicitly assuming that the coupling between respiration and cardiac oscillatory activity is unidirectional. The direction of cardiorespiratory coupling has been studied by Rosenblum et al (2002) and Stefanovska (2002). They have shown that although there is a symmetric bidirectional interaction between the two systems within the first 6 months of life, the coupling is nearly unidirectional (from respiration to the cardiovascular system) in a conscious healthy adult at all respiration frequencies. The close similarities we have observed in our studies between the real-HRV and model-HRV, are further supportive evidence that cardiorespiratory interaction is indeed unidirectional.
We have used the chest signal to obtain the intra-thoracic pressure using gain and offset adjustments, and then the lung volume from the intra-thoracic pressure using an empirical relation. As a result, errors are inevitable in both the intra-thoracic and lung volume signals for a particular volunteer. However we have based our conclusions not on absolute values of various parameters such as LF, HF powers of HRV and respiration, but we have been careful to base our conclusions on relative comparisons such as comparing results from the same person during regular and irregular breathing the recordings for which are obtained in a single session.
Our results indicate strongly that the generation of RSA is via the mechanisms in the Ursino and Magosso model and not due to a central oscillator. The high correlation we have observed in real- and model-HRVs in relation to respiration, as shown in figure5, is a strong support for the non-central oscillator for the generation of RSA.
In real-HRVs we have also observed a VLF component in the spectrum. In model-HRVs we do not observe such a spectral component. This is a consequence of the Ursino and Magosso model that does not have a mechanism for VLF generation if the 0–0.12 Hz noise source is excluded.
We have observed that the LF/HF ratio in respiration is much smaller than the LF/HF ratio in HRV (tables3and4). One of the reasons for this may be due to the fact that the respiration–HRV interaction system has a much higher gain in the LF region as shown in figure1. Also the various nonlinear interactions between the vagal and sympathetic pathways in the model may contribute to such an observation. In particular as shown by Ursino and Magosso (2003) in their sensitivity analyses, vagal and sympathetic contributions in HRV adversely effect each other.
The Ursino and Magosso model is a comprehensive one and has many parameters such as gains, delays and component values. We have used the basal parameter values specified by Ursino and Magosso (2003). It is of interest to adjust the parameters of the model for a specific person so that experimentally observed waveforms and spectra fit model-predicted waveforms and spectra better. For example the LF power of model-HRV is much larger than the LF power of real-HRV for volunteer 4 as seen in figure6. By decreasing the sympathetic gains in the model it was possible to decrease the LF power while not changing the HF power much. As a result, the model LF/HF ratio decreased from 3.17 to 1.71 which is closer to the real LF/HF ratio which is 1.22. In doing so we also observed that the cross correlation between real-and model-HRV waveforms increased from 0.64 to 0.72. In general, however the ‘parameter identification’ problem is not easy to tackle; theoretical identifiability of the parameters must be studied and measurement of other system signals such as several pressure waveforms, sympathetic discharge, etc may be necessary. Although it may not be possible to exclusively identify all parameters of the model, one may still undertake a focused investigation to develop methods for the identification of some key quantities of clinical importance, such as ‘baroreflex gain’.
In general we conclude that the use of HRV PSD and the LF/HF ratio for clinical diagnosis will be incomplete if the PSD of a respiratory signal is not simultaneously observed. Even in spontaneous breathing respiration may have a significant LF power the effect of which will be accentuated by the high gain of the baroreflex feedback loop at around 0.1 Hz. In fact any external or internal stimulus which induces arterial pressure perturbations in the LF region may cause a LF power in HRV.
References
Angelone A and Coulter N A 1964 Respiratory sinus arrhythmia: a frequency dependent phenomenon J. Appl. Physiol. 19 479–82
Bernardi L, Leuzzi S, Radaelli A, Passino C, Johnston J A and Sleight P 1994 Low-frequency spontaneous fluctuations of RR interval and blood pressure in conscious humans: a baroreceptor or central phenomenon? Clin. Sci. 87 649–54
Bernardi L C, Porta A, Gabutti L, Spicuzza and Sleight P 2001 Modulatory effects of respiration. Auton. Neurosci. Basic and Clin.90 47–56
Bernardi L, Wdowczyck-Szulc J, Valenti C, Castoldi S, Passino C, Spadacini G and Sleight P 2000 Effects of controlled breathing, mental activity and mental stress with or without verbalisation on heart rate variability J. Am. Coll. Cardiol.35 1462–9
Cohen M A and Taylor J A 2002 Short-term cardiovascular oscillations in man: measuring and modelling the physiologies J. Physiol.542 669–83
de Boer R W, Karemaker J W and Strackee J 1987 Hemodynamic fluctuations and baroreflex sensitivity in humans: a beat-to-beat model Am. J. Physiol. 253 680–9
Ecberg D L 2003 The human respiratory gate J. Physiol. 548 339–52
ESC/NASPE (European Society of Cardiology/North American Society of Pacing and Electrophysiology)Task Force 1996 Heart rate variability: standards of measurements, physiological interpretation, and clinical use Circulation 93 1043–65
Fowler A C and McGuinness M J 2004 A delay recruitment model of the cardiovascular control system J. Math. Biol. 51 508–26
Freisen G M, Jannett T C, Jadallah M A, Yates S L, Quint S R and Nagle H T 1990 A comparison of the noise sensitivity of nine QRS detection algorithms IEEE Trans. Bio. Med. Eng.37 85–98
Friedman B H, Allen M T, Christie I C and Santucci S K 2002 Validity concerns of common heart-rate variability indices IEEE Eng. Med. Biol.21 35–40
Furutani Y et al 1997 Influence of the dead space induced by the face mask on the measure of heart rate variability J. Cardiol. 29 171–6
Gang Y and Malik M 2003 Heart rate variability analysis in general medicine Indian Pacing Electrophysiol. J. 3 34–40
Hirsch J A and Bishop B 1982 Human breathing patterns on mouthpiece or face mask during air, CO2 or low O2 J. Appl. Physiol. 53 1281–90
Kitney R I 1979 A nonlinear model for studying oscillations in the blood pressure control system J. Biomed. Eng. 1 89–99
Kleiger R E, Stain P K and Bigger J T 2005 Heart rate variability: measurement an clinical utility Ann. Nucl. Eng. 10 88–101
Madwed J B, Albrecht P, Mark R G and Cohen R J 1989 Low frequency oscillations in arterial pressure and heart rate: a simple computer model Am. J. Physiol. 256 H1573–1579
Malpas S C 2002 Neural influence on cardiovascular variability: possibilities and pitfalls Am. J. Physiol. Heart Circ. Physiol. 282 H6–20
Miller I F, Yeates D B and Wong L B 2004 Heart rate variability analysis—promise and fulfillment Business Briefing: Global Healthcare—Advanced Medical Technologies http://www.touchbriefings.com/pdf/950/bio_tech.pdf Pitzalis M V et al 1998 Effect of respiratory rate on the relationships between RR interval and systolic blood pressure
fluctuations: a frequency-dependent phenomenon Cardiovasc. Res.38 332–9
Poyhonen M, Syvaoja S, Hartikainen J, Ruokonen E and Takala J 2004 The effect of carbon dioxide, respiratory rate and tidal volume on human heart rate variability Acta Anaesthesiol. Scand.48 93–101
Rosenblum M G et al 2002 Identification of coupling direction: application to cardiorespiratory interaction Phys. Rev. E 65 041909
Saul J P et al 1991 Transfer function analysis of the circulation: unique insights into cardiovascular regulation Am. J. Physiol. 261 H1231–45
Saul J P, Ronald D B, Mind H C and Cohen R J 1989 Transfer function analysis of autonomic regulation II. Respiratory sinus arrhythmia Am. J. Phyiol. Heart Circ. Physiol. 256 H153–61
Schipke J D, Pelzer M and Arnold G 1999 Effect of respiration rate on short-term heart rate variability J. Clin. Basic Cardiol. 2 92–4
Seydnejad S R and Kitney R I 2001 Modeling of mayer waves generation mechanisms, determining the origin of the low-and very low frequency components of BPV and HRV IEEE Eng. Med. Biol. Mag. 20 92–100
Stefanovska A 2002 Cardiorespiratory interactions Nonlinear Phenom. Complex Syst. 5 462–9
Strauss-Blasche G, Moser M, Voica M, McLeod D R, Klammer N and Marktl W 2000 Relative timing of inspiration and expiration affects respiratory sinus arrhythmia Clin. Exp. Pharmacol. Physiol.27 601–6
Tripathi L C K 2004 Respiration and heart rate variability: a review with special reference to its application in aerospace medicine Indian J. Aerosp. Med. 48 64–75
Ursino M 1998 Interaction between carotid baroregulation and the pulsating heart: a mathematical model. Am. J. Physiol. Heart Circ. Physiol. 275 H1733–H1747
Ursino M and Magosso E 2003 Role of short term cardiovascular regulation in heart rate variability: a modeling study Am. J. Physiol. Heart Circ. Physiol. 284 H1473– 94 (http://ajpheart.physiology.org/cgi/content/ full/284/4/H1479)
Vielle B 2005 Mathematical analysis of Mayer waves J. Math. Biol.50 595–606
Whittam A M, Clayton R H, Lord S W, McComb J M and Murray A 2000 Heart rate and blood pressure variability in normal subjects compared with data from beat-to-beat models developed from de Boer’s model of the cardiovascular system Physiol. Meas.21 305–18