A SERVICE QUALITY MEASUREMENT FRAMEWORK FOR MOBILE BETTING:
AN ASSESSMENT OF THEORY AND PRACTICE
ALİ İLHAN TİRELİ
IŞIK UNIVERSITY 2008 A. T İREL İ Ph.D. Thesis 2008
A SERVICE QUALITY MEASUREMENT FRAMEWORK FOR MOBILE BETTING:
AN ASSESSMENT OF THEORY AND PRACTICE
ALİ İLHAN TİRELİ
B.A., Marmara University, International Relations & Political Sciences, 1999 M.A., Bilgi University & Manchester Business School, Management, 2001
Submitted to the Graduate School of Social Sciences in partial fulfillment of the requirements for the degree of
Doctor of Philosophy in
Contemporary Management
IŞIK UNIVERSITY 2008
SERVICE QUALITY MEASUREMENT FRAMEWORK FOR MOBILE BETTING
Abstract
Since year 2000 Mobile Services or in other words Value Added Services are continuously growing. Business priority at the emergence of these services has been to launch as many services as possible, regardless of the profits or perfect functionality. However today, as users are becoming experienced and more conscious and competition is getting tough, service quality is becoming more important. The study proposes a quality measurement framework for mobile content services with specific reference to mobile betting, which is one of the highest growing sector in mobile. The scope has been limited specifically with Mobile Internet or wap based sports betting services however can be easily adapted to other content types or access channels. Development of the measurement scale is based on extensive literature review, as well as interviews with professional Web designers, service users and visitors. Previous research based on different measurement frameworks like SERVQUAL, SERVPerf, WebQual, WebQual™, Web Site Quality Model and E-S-QUAL among others have been compared and contrasted extensively. The study proposes 8 core dimensions to measure the quality of mobile betting sites: Assurance, competence, ease of use, flexibility, fun, information quality, privacy and responsiveness. The instrument was refined using a web based questionnaire 4 times and final survey was conducted with 260 mobile betting users.
MOBIL BAHISTE SERVIS KALITE ÖLÇÜM ÇERÇEVESI
Özet
2000 yılından bu yana mobil, bir başka deyişle katma değerli servisler hızla büyümekte. Başlangıçta strateji henüz tüm hatalar giderilmemiş olsa da, hatta kar etmeyeceği bilinse de olabildiğince çok yeni servisleri pazara sunmak iken günümüzde kullanıcıların bilinçlenmesi ve rekabetin artması sonucu servis kalitesi önem kazanmaktadır. Bu çalışma özellikle mobilde en hızlı gelişen ikinci sektör olan bahis örneğinden yola çıkarak mobil içerik servisleri için kalite ölçüm çerçevesi oluşturmayı hedeflemektedir. Kapsam özellikle mobil Internet ya da Wap kanalı ile erişilebilen sabit ihtimalli futbol ve at yarışları üzerine müşterek bahisler ile sınırlanmakla birlikte kolaylıkla diğer içerik tipleri ve erişim kanallarına da uyarlanabilir. Yöntem geliştirilirken elektronik servis kalitesi ile ilgili literatür kapsamlı olarak incelenmiş en çok kullanılan SERVQUAL, SERPERF, WebQual, WebQual™, Web Site Quality Model ve E-S-QUAL gibileri detaylı incelenerek karşılaştırılmış, bunun yanısıra profesyonel grafik tasarımcıları, bahis oyuncuları ve site ziyaretçilerinin görüşlerine başvurulmuştur. Çalışma sonucunda mobil bahis örneğinde 8 ana boyutta servis kalitesinin ölçülebileceği önerilmiştir. Bunlar güven (assurance), yeterlilik (competence), kullanım kolaylığı (ease of use), esneklik (flexibility), eğlence (fun), bilgi kalitesi (information quality), gizlilik (privacy) and yanıt alabilme (responsiveness). Çalışmada web tabanlı bir anket uygulaması ile anket soruları revize edilmiş ve son çalışmada 260 mobil bahis oyuncusu ankete katılmıştır.
Acknowledgements
After three years of work with this thesis, I feel happy and proud that the process is at this stage however, I am still not completely satisfied since the research opened new dimensions to work further in the future, maybe in ergonomics, information systems or even economics. German style education creates people who continuously question. And someone who is born curious and persistent becomes skeptical and never satisfied after 8 years of German school. When I started to work on my thesis I could not imagine that advancements in technology would make my life more difficult. Each and every day new articles and research, which have not been accessible via library research, became available on Google Scholar and other web based sources.
First of all I would like to thank my advisor Professor Emre Gönensay for his support and encouragement during the process. Our discussions about the dimensions helped to reshape the subject and discover alternative paths. Also, I want to thank Associate Professor Mehmet Emin Karaaslan, who reviewed the manuscripts twice and helped reshape the questionnaire; Professor Toker Dereli for his valuable comments and corrections starting from the proposal; Associate Professor Bülent Bali for his attention and contribution regarding the methodology and Associate Professor Ensar Yılmaz for his contribution especially on the data analysis.
Apologies and thanks go to my friends and relatives whom I could not meet or visit as frequent for the last three years.
And most of all, I would like to thank my wife Ebru for her emotional support and understanding during the whole process. Without her help I could not be at this stage.
Table of Contents
Abstract ... ii Özet ... iii Acknowledgements ... v Table of Contents ... vi List of Tables ... ix List of Figures ... xiList of Abbreviations ... xii
1 Introduction ... 1
1.1 Why is the Subject Worth a Thesis? ... 1
1.2 Research Problem ... 3
1.3 Purpose of the Study ... 5
1.4 Research Questions ... 6
1.5 Structure of Thesis ... 7
1.6 Significance and Contribution of the Study ... 9
1.7 Delimitations ... 9
2 Literature Review ... 12
2.1 Evolution of Betting ... 12
2.1.1 Gambling, Betting and Gaming ... 12
2.1.2 Gambling Industry ... 13
2.1.3 Games of Luck in Turkey ... 15
2.1.4 Legal Environment ... 17
2.1.5 Gaming Limitations ... 18
2.2 Service Quality ... 21
2.2.1 Quality ... 21
2.2.2 E-Service Quality ... 22
2.2.3 Service Quality and Customer Satisfaction ... 22
2.3 Measurement Framework Models ... 23
2.3.1 SERVQUAL ... 23
2.3.2 SERVPERF ... 29
2.3.3 WebQual or WebQual/M ... 30
2.3.4 WebQual™ ... 31
2.3.5 Web Site Quality Model ... 33
2.3.6 E-S-QUAL ... 34
2.3.7 Quality of Service-related Technical Standards ... 35
2.3.8 Other Methods ... 36
2.4 Summary and Critical Review ... 37
3 Research Methodology ... 39
3.1 Pre-understanding ... 39
3.1.1 Traditional Ways of Betting ... 39
3.1.2 Interactions in Mobile Betting ... 40
3.1.3 Research Approach ... 47
3.2 Design ... 50
3.2.1 Independent Variables ... 50
3.2.2 Dependent Variables ... 51
3.3 Conceptual Framework in Depth ... 51
3.3.1 Empirical Setting ... 51
3.3.2 Pilot Survey Questions ... 52
3.3.3 Survey Questions in Depth ... 53
3.3.4 Choice of Respondents for the Final Survey ... 57
3.4 Research Findings ... 58
3.4.1 Analysis of Demographics and the Relation with Satisfaction .... 58
3.4.2 Analysis of Answers ... 72
4 Conclusion and Discussion ... 80
4.1 Summary of the Study ... 80
4.2 Theoretical Implications/Contribution ... 82
4.3 Comparison with Similar Studies ... 83
4.4 Research Limitations ... 85
4.5 Suggestions for Future Research ... 87
4.6 Managerial Implications ... 88
References ... 89
Appendix A1:22 statements of the SERVQUAL instrument – (E) ... 95
Appendix A2:22 statements of the SERVQUAL instrument- (P) ... 96
Appendix B:WebQual Dimensions by Construct ... 97
Appendix C: E-S-QUAL and E-RecS-Qual Dimensions and Items ... 98
Appendix D: WebQual Items by Construct ... 100
Appendix E:Dimensions of Mobile content ... 102
Appendix F:First Pilot Survey Questions ... 103
Appendix G:Second Pilot Survey Questions ... 104
Appendix H:Final Survey Questions and Dimensions ... 105
Appendix I:Questionnaire Screen ... 106
Appendix J:Reasons for preferring Internet gambling versus gambling at a land-based venue ... 108
List of Tables
Table 2.1 Share of Internet Sales of Betting in 2008 in some European Countries ... 14
Table 2.2 Tax Distribution Table of Fix-Odds Betting Revenues (June 2007) ... 20
Table 3.1 Model of User Interactions ... 41
Table 3.2 Demographics of Participants ... 59
Table 3.3 Cities of Participants ... 60
Table 3.4 Gender and Satisfaction ... 60
Table 3.5 Age Distribution ... 61
Table 3.6 Age and Satisfaction ... 61
Table 3.7 Employment and Education ... 62
Table 3.8 Distribution of Education ... 63
Table 3.9 Education and Satisfaction ... 63
Table 3.10 Distribution of Employment ... 64
Table 3.11 Employment and Satisfaction ... 64
Table 3.12 Monthly Income and Employment Status ... 65
Table 3.13 Monthly Income and Satisfaction ... 65
Table 3.14 Distribution of Marital Status ... 66
Table 3.15 Marital Status and Satisfaction ... 66
Table 3.16 Membership Age ... 67
Table 3.17 Membership Age and Satisfaction ... 68
Table 3.18 Membership Age and Perceived Speed ... 68
Table 3.19 Payout Distribution ... 69
Table 3.20 Payout and Satisfaction ... 69
Table 3.21 Budget Shares ... 71
Table 3.22 Share of Online Betting in Declared Budget and Satisfaction ... 71
Table 3.24 Summary Weighted Quality Scores ... 73
Table 3.25 Weighted Quality Scores of Dimensions ... 74
Table 3.26 Pearson's Correlation Matrix ... 76
List of Figures
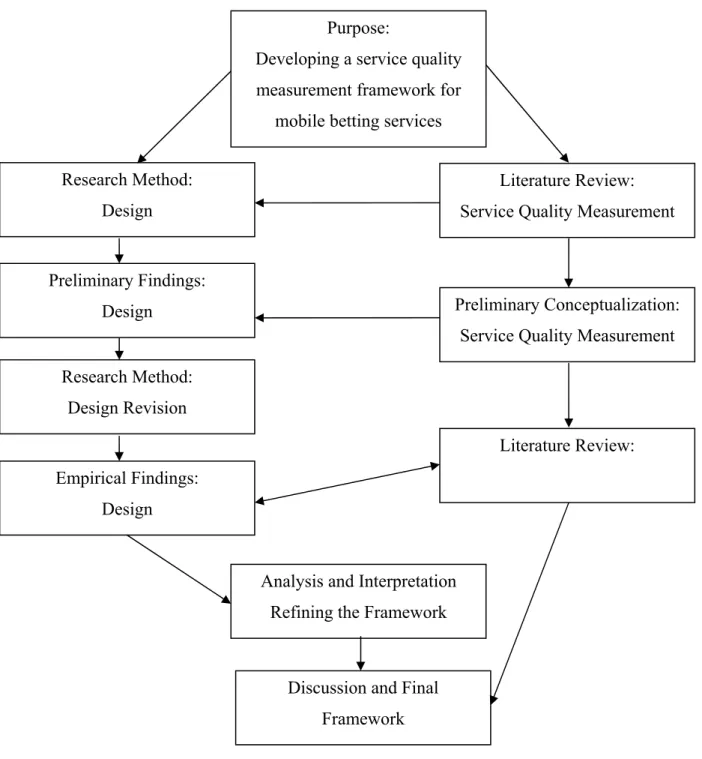
Figure 1.1 Research Strategy ... 8
Figure 2.1 Disconfirmation Paradigm ... 24
Figure 2.2 Service Quality Model ... 25
Figure 2.3 Determinants of Perceived Service Quality ... 26
Figure 2.4 Development of Determinants of Service Quality ... 28
Figure 2.5 Theory of Reasoned Action ... 31
Figure 2.6 Technology Acceptance Model ... 31
Figure 2.7 WebQualTM Model ... 32
Figure 2.8 Kano Model ... 33
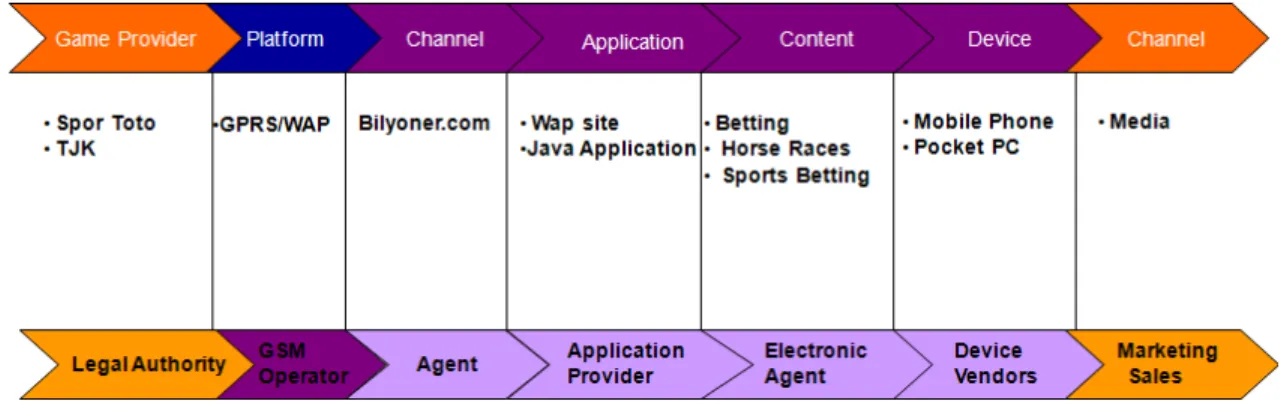
Figure 3.1 Mobile Betting Business Flow ... 46
Figure 3.2 Model of Service Quality Framework ... 48
Figure 3.3 Dimension and Related Questions ... 49
List of Abbreviations
ADSL Asymmetric Digital Subscriber Line is a data communications technology that enables faster data transmission over copper telephone lines
ASP Active Server Pages, a web-scripting interface by Microsoft
Dial-up Dial-up Internet Access is a form of Internet access via telephone lines EDGE Enhanced Data Rates for GSM Evolution enables higher speed data
transmission
GPRS General Packet Radio Service
GSM Global System for Mobile communications ISO International Standardization Organization ITU International Telecommunication Union
ITV Interactive television, allows viewers to interact with television content as they view it
IVR Interactive voice response technology that allows a computer to detect voice and touch tones using a normal phone call
MVNO Mobile Virtual Network Operator
Operator The GSM/GPRS Network operator (Turkcell, Vodafone, AVEA) QFD Quality Function Deployment
QoS Quality of Service SMS Short Message Service
TAM Technology Acceptance Model TRA Theory of Reasoned Action
WAP Wireless Application Protocol, open international standard that enables access to the Internet from a mobile phone or PDA.
Chapter 1
Introduction
“We must measure what can be measured, and make measurable what cannot be measured.” Galileo Galilee, 1610
1.1 Why is the Subject Worth a Thesis?
In 1997 when I started to work for Superonline, number of dial-up Internet subscribers in Turkey was less than 10.000. I started as an Editor and then was responsible for several services from design to development and operations. Service quality was not the priority; primary objective was to roll out before any other competitor, like all over the world, during those years. And when the service is on production, the main measurement scale to evaluate a service has been the number of users.
With the growing number of users and Internet penetration in Turkey in year 2000 (dial-up Internet subscribers reached 2.000.000) service quality became a hot topic. After the launch of services, standard monitoring measures have been taken. However those were mostly technical criteria which were not directly measuring quality from end-user’s perspective. Other research, like focus groups, was useful; however could not easily lead to product improvements or enhancements.
Millennium’s Eve has not only been a major milestone for Internet. GSM operators around the world started to offer non-voice services to their subscribers. Most of them were free of charge and aimed to create a sense of familiarity among users. Later, when mobile services were charged, new preventive measures became necessary to ensure quality. There were several reasons for this, but major ones are still the same,
difficulties and costs of fixing a problem and customer dissatisfaction which leads to cease of service usage.
Controlling the technical aspects has always been the easier part: Even a smart junior programmer could find some simple tools on Internet modify those and could check several aspects automatically on wap and web. SMS services were just developing in 2002 and even technical control mechanisms were not available worldwide. So we started to design a new Service Quality Control Mechanism: This tool should both check technical and non-technical aspects. Designing the software was easy; however the main question was still not answered: How can we measure from the customer’s point of view? Using focus groups was too expensive and not feasible to utilize on a continual basis. We could also start simply by using experts’ opinion, but to what extent do they reflect end users’ perception?
For editorial content services the classic way of taking a quality measure was simple, to put a second step in the workflow who shall edit what is being written. A redactor shall read and approve all the content. However, since these services were offered to customers as they are produced all people shall work simultaneously. That has been the way we worked for a long time even if this could never be financially feasible. There are several difficulties; a news item which can place a page on web should fit into 160 characters (limit of 1 short message [SMS]), the content shall be entered, approved and delivered to consumers as soon as possible and before any other media since the main reason for consumers to pay for the service instead of reading news or watching TV, is the time constraint.
To make the business operate financially successful, some steps had to be eliminated. Instead of many Quality Controls, some Quality Assurance steps were added which should create continuous feedback for improvement. Certainly these controls also included manual periodic checks on several dimensions of the content depending on the nature of the content.
Even if there are several common denominators like response time or accuracy, each content type has different characteristics and the customer profile also varies. For some content types time is not a critical issue since static content is provided for leisure.
So I decided to work on the subject not only as a business professional, and started to research in university libraries, since there was almost nothing available via Internet. When I discovered that research is only limited to Internet usability and quality, I decided to work on it on an academic level. This is the answer to the important question, why is this subject worth a thesis? I thought to be the first one to work on the subject and still today, there is nothing published around the subject yet. Nowadays, much research is published online faster than before and other than various academic reference listings, Google enables us with Google Scholar, which was not on production when I started to work on my thesis, to search within several online libraries and academic listings online. Therefore it is easier to say that, nothing has been published around the subject of this thesis.
1.2 Research Problem
Since year 2000, GSM operators continuously tried to introduce new mobile services into the markets. Nowadays many content, service or business owners move their offerings into the mobile platform. In Turkey, during the development phases, only a few utilize benefits from usability labs or professional testing companies. And once a service is in production most of the services are not monitored during the life cycle from service owners.
Mobile operators on the contrary strictly monitor all voice services or in other words elements of their core business. Quality of Mobile Services is mostly being measured from a technical standpoint; standards are set by International Telecommunications Union or GSM Association. It is a fact that technical quality leads to success but is not
Current focus in research on mobile service quality is again mostly on the technical side of especially emerging services like Mobile TV. Although service researchers studied technology-based or in other words e-service quality, few studies have been conducted that focus on mobile Internet. Barnes and Vidgen (Barnes and Vidgen 2001) evaluated mobile Internet news sites using the so-called WebQual-M instrument, to assess the quality from the perspective of the ‘voice of the customer’ via an online questionnaire comparing three England based wap news sites. Limited with web quality, (Loiacono et.al 2002) WebQual™ was developed to measure the quality of a Web site. There are several researches on web site quality however, except the WapQual-M, none aims to measure the quality of a wap site.
Other Ph.D. level research closely related to mobile service quality concentrates on usability issues (McMahon, 2005) or online value perceptions (Broekhuizen, 2006). On wap usability, Jakob Nielsen also has published several articles or papers (Ramsay, M & Nielsen, J 2000).
On the other side, especially operator and vendors work hardly on service quality measurement and standard setting. The Wireless Service Measurements Handbook (TeleManagement Forum, 2004) provides in depth measurement models for mobile services which include section for user perception; besides technical criteria like speed (download, access or response times) and availability, accuracy rates are evaluated. However this handbook also lacks several criteria which will be included in this research.
In this thesis, the research problem has been how to measure Quality of Mobile Services, specifically Mobile betting, from the user point of view including constructs such as assurance, competence, ease of use, flexibility, fun, information quality, privacy and responsiveness.
1.3 Purpose of the Study
The main purpose of the intended study is to establish a quality measurement framework specifically suitable for mobile betting services and test this model with real service users. The scope is limited with the non-technical aspects of the business, which means the network operator business will not be covered in detail but only mentioned whenever necessary. The research aims to build a model which is practically applicable. Quality of Service is still a very hot topic in service industry and among academic circles and almost every day a new research is being published. Most of the research is based on the SERVQUAL methodology developed by Parasuraman, Zeithaml, and Berry (Parasuraman et al, 1985). During the preparation phase, no research or publication has been found addressing either content or in general non-voice services.
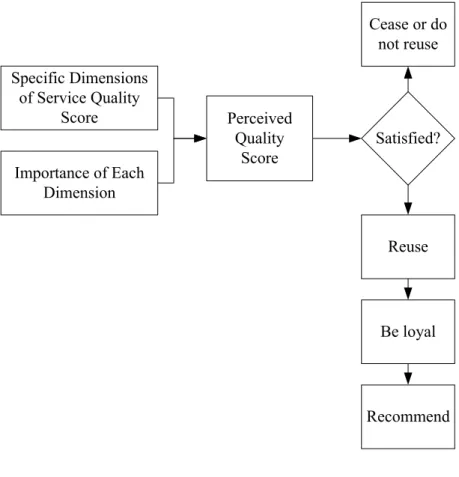
Developing a model requires a deep understanding of user behavior and user – service provider interactions. Why do customers re-use a service or cease service usage after certain experiences? SERVQUAL defines the service quality score as the difference between expected and perceived quality, however the interaction between user and service provider or the post purchase behavior is missing. A complimentary analysis is required to understand satisfied and unsatisfied user behavior.
1.4 Research Questions
This research does neither offer any recommendations for problem solving, nor measures to be taken even if these are presented as natural extensions of the research results. The main aim is to measure the quality of mobile betting services from end user’s perspective. Therefore, factors that consumers consider when making choices between alternative service providers is an important criteria.
• Which dimensions of service quality shall be included?
Previous research clearly shows the importance of weighted scores in such an evaluation.
• Which are the most important ones?
One of the main reasons for this research is to fill a gap in theory and practice, none of the existing models can extensively measure mobile service quality, and all of the research emerged from web usage. It might be possible to work on the models or merge underlying factors for further research.
• Can existing models be modified?
WebQual, WebQual-M, SERVQUAL, SERVPERF, Normed Quality, Two-Way, QUALITOMETRO or ITU/ISO standards may be modified to measure the level of mobile content service quality perceived by the consumer.
1.5 Structure of Thesis
During the preparation phases, several changes were employed in research strategy. After deciding on the purpose, a deep literature review has been conducted in University libraries, Internet and among professional whitepapers and documents (like Gartner, Informa Telecoms, International Betting consultants) accessible via personal connections. Since the research interest focuses on service quality, theoretical literature review concentrates on service management research with particular reference on service quality. Existing models were compared and contrasted in brief and dimensions and relevant items were identified most of them based on SERVQUAL. With this preliminary analysis, a simplified pilot study was conducted to explore the significance and compliance of the dimensions in the betting environment and to determine bettors’ behavior towards attending such an online questionnaire.
At the same time all customer inquiries with e-mail or using a web form or via call center agents for more than one year (more than 50.000 messages), have been filtered and major issues have been listed. That empirical study contributed to refine the dimensions and to shape the final conceptualization and form the new detailed questionnaire accordingly. Additional literature review especially using Internet, since most of the research is online, has been conducted and some other or revised service quality measurements techniques like WebQual 4 or e-TailQ have been evaluated.
The final conceptualization offers a tool to measure mobile betting quality from an end user perspective which defines the level of quality of the service, shows strengths and weaknesses and therefore areas of improvement in practice as well.
Figure 1.1 Research Strategy
Purpose:
Developing a service quality measurement framework for
mobile betting services
Research Method: Design
Literature Review: Service Quality Measurement
Preliminary Findings:
Design Preliminary Conceptualization: Service Quality Measurement
Literature Review:
Analysis and Interpretation Refining the Framework
Discussion and Final Framework Research Method:
Design Revision
Empirical Findings: Design
1.6 Significance and Contribution of the Study
There is much research conducted on different areas for creating a quality measurement framework, however, there is none made yet on mobile content services. This makes the study an original one from the start on.
This research will not only be a theoretical framework, but the outcome will be easily applicable in businesses. According to Gartner Group (www.gartner.com, 2006), all over the world, mobile content services will generate a large portion of operator revenues by 2010. Especially in Turkey, in year 2008 Higher Board of Telecommunications of Turkish Republic will adjudicate MVNO licenses and mobile number portability is finally issued (11.11.2008) which has been the major barrier for subscribers to switch operators (mobile subscribers will be able to carry their mobile numbers from one operator to another). Another important factor is the 3G license tender which has been postponed to November 2008.
Another important factor is the growing share of mobile in betting industry. A research by Informa Telecoms predicts that 200.000.000 mobile gamblers will spend USD 7.6 billion by year 2010 (Informa Telecoms, 2005).
1.7 Delimitations
The study proposes a service quality measurement framework for mobile betting services. Quality even if there is no consensus on a single definition, includes “value” as a dimension from end user perspective. However, value research is closely related to psychology (as well as socio-economic and cultural studies) and is not included in the current study.
Usability is another key technical concept which needs further attention, however in this research only user’s perception under “ease of use” dimension is considered. A research about usability in mobile services shall include ergonomics which is a part of computer science engineering or graphical design.
In mobile communications, several factors influence user-provider interactions. These include mobile network coverage, data connection speed, download speed, drop ratio and similar which are technically measureable. As mentioned above, there are several guidelines and standards issued by ITU or Telecommunications Union addressing that type of measureable elements, however in this research speed is an element valued from customer’s point of view and evaluated under “competence” dimension.
Betting traditionally takes place in betting shops (stationary agents). Another alternative for over a century has been telephony. Today alternative channels include world wide web, mobile, interactive television (iTV), interactive voice recognition systems (iVR) and some type of standalone interactive machines connected to internet. Mobile betting can be placed via a WAP site, short messaging (SMS) or an application (Java or similar) which connects through mobile network. If the players use a mobile device to connect to Internet or the typical stationary agents and or stand alone machines are connected via mobile is not in the scope of this research. By mobile betting it should be understood that the only device to put a bet through is the mobile phone’s graphical interface, therefore the scope is limited with wap or mobile application usage. Theoretically the relationship can be defined as technology based self-service.
Another major constraint in mobile services is still device compatibility. Major mobile device producers (Nokia, Sony Ericsson, Samsung, Siemens, Motorola) traditionally developed their own operating systems which as a result caused difficulties for application developers in adopting services for each device. Today the two market leading platforms are Symbian, Linux and Microsoft Mobile followed by J2ME, Palm and BlackBerry. Android developed and launched by Google (November 2007) will be in competition as well. During the survey, different Operating systems were not taken
into consideration since the sample population consists of bettors who already benefit from the service.
Chapter 2
Literature Review
The subject of the thesis requires deep understanding of several theoretical concepts as well as major socio-economic issues. What is betting, what is the difference from gambling? How does the industry grow, are there any limits? What kinds of differences exist between service quality and electronic (in general) and mobile (in specific) service quality? Do user perceptions differ from service to service and how can it be valued? There are several models developed and applied to measure traditional and also electronic service quality; how can this thesis benefit from the findings? What are the dimensions of mobile betting quality, how can this be measured? As stated in the above paragraph, the literature review covers a very wide range of topics and in this section these topics will be elaborated one by one.
2.1 Evolution of Betting
2.1.1 Gambling, Betting and Gaming
Gambling is wagering money or something of material value on an event with an uncertain outcome with the primary intent of winning additional money and/or material goods (Wikipedia, 2007). Typically, the outcome of the wager is evident within a short period of time. Or in other words, according to dictionary “gambling is playing games of chance for money”. Betting is “an agreement between two sides that one proved wrong about the outcome of an event and will pay a stipulated sum of money to the other” (Lubet 2006, pp20). All gambling involves betting but not every bet is a gamble, there is a clear distinction between two terms. Another important term, gaming, refers to
instances in which the activity has been specifically permitted by law. Since the subject of the thesis is legal betting, it will be dealt in depth. The types of bets available in Turkey today include sports events such as horse racing and soccer matches. Both types offer some predictability according to bettors’ knowledge which will have an advantage over others.
2.1.2 Gambling Industry
Online gaming is still a comparatively young industry, the first online gaming offerings date back to 1996. According to a survey published by Global Betting and Gambling Consultants in 2005 (GBGC, 2005), gross gaming revenues (defined as betting stakes less customer winnings) totaled ca. USD 247 billion worldwide of which only 3,9% coming online ca. USD 9,6 billion. There are several reasons for the rapid increase in the share of online gaming. First of all Internet connection speed is increasing whereby prices decrease. In year 1997 in Turkey, dial-up Internet connection only offered a speed of 56 kb/sec for 30 TL a month. Today, for the same price, ADSL connection with a speed of 2 MB/sec is offered. The penetration rate is still increasing, according to International Telecommunications Union, as of March 2008 number of people connected to Internet in Turkey is about 26,500,000 with a penetration rate of 36.9% (ITU, 2008). Penetration of mobile phones is 72,6% in 2007 which makes Turkey one of the leading countries in Europe (TURKSTAT, 2008).
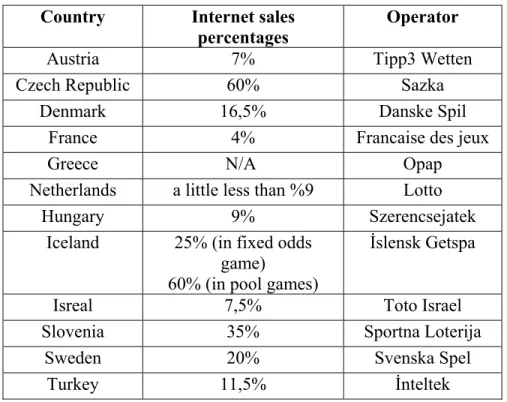
In the next page, a recent survey (2008) conducted online asking representatives from different betting operators about their shares in online market. Figures about mobile share are not displayed since most of the countries either do not provide mobile betting or did just start this business. The online shares are as follows:
Table 2.1 Share of Internet Sales of Betting in 2008 in some European Countries
Country Internet sales
percentages
Operator
Austria 7% Tipp3 Wetten
Czech Republic 60% Sazka
Denmark 16,5% Danske Spil France 4% Francaise des jeux
Greece N/A Opap
Netherlands a little less than %9 Lotto
Hungary 9% Szerencsejatek
Iceland 25% (in fixed odds game)
60% (in pool games)
İslensk Getspa
Isreal 7,5% Toto Israel Slovenia 35% Sportna Loterija
Sweden 20% Svenska Spel
Turkey 11,5% İnteltek
Source: Compiled through personal communication with the commissioned operators of related countries.
There are some interesting findings. In Czech Republic, Internet is still banned, Sazka is offering Internet betting via phone, by which customers prepare their bets in Internet and then confirm their tickets by the phone or through a printed barcode on any stationary agent. In Greece as well betting via Internet is not offered even if it is not prohibited by law.
In Netherlands, it has gone a little down from 10% probably as a result of growth of the turnover realized in the stationary agents. Hungary represents the opposite, it was 1,9% last year. However increasing the payout rate 6% in the first Quarter of 2008 and launching a new fixed odds game at the end of April only for the Internet bettors the share increased very rapidly.
According to Gartner Group (Gartner, 2005) gambling and pornographic material generates large revenues on Internet and is expected to create similar revenues on the mobile. Service providers have to deal with security and regulatory risks like in Internet; however it is worth to deal with. Informa Telecoms predicts, 200.000.000 mobile gamblers will spent USD 7,6 billion by year 2010 worldwide (Informa Telecoms, 2005). There are three key types of mobile gambling - sports betting, lotteries and casino-gaming (including poker and bingo) which will generate this large volume.
2.1.3 Games of Luck in Turkey
In Turkey betting, gambling or in general games of luck or chance have a relatively short history compared to England or other European countries. Today there are three authorities organizing games of luck, namely Milli Piyango İdaresi Teşkilatı, Türkiye Jokey Kulübü and Spor Toto Teşkilatı.
Oldest document found dates back to late 18th century mentioning of lotarya. In year 1856 a lottery among non-Muslim in İstanbul –Yeşilköy was organized distributing houses, fields and money. In 1857 first a foreign lottery tickets were banned and later in the same year there was an attempt to ban lotteries at all. It is understood that there were more than 300 people who were authorized by the police (Bab-ı Zaptiye) to organize lotteries. In 1887 state officially organized a lottery called promise or “Şark Demiryolları Tahvilleri Piyangosu” to finance the European railway project.
In 1887 Izmir Ottoman Lottery and in 1888 Bulgarian Lottery started authorized by the state and continued until 1914. Between 1906 and 1909 Ziraat Bankası lottery was organized to finance immigrants from Caucasia and Balkans.
First state organized lottery dates back to 1926 called Tayyare Piyangosu organized by Türk Hava Kurumu in order to finance education of pilots, buying new aircraft and later to build aircrafts. The General Directorate had 425 agents all over Turkey. To increase
costs and build a dedicated organization in year 1939 Milli Piyango İdaresi Teşkilatı (General Directorate for National Lotteries) was founded.
First horse races in Turkey were organized by Symrna Racing Club in İzmir in 1856. In 1909 Ottoman Racing Club was founded however there is not much information about the activities. In 1913 Sipahi Ocağı Binicilik Kulübü, in 1926 Yüksek Yarış ve Islah Encümeni and finally in 1950 Jockey Club was founded.
Spor Toto Teşkilat Başkanlığı was founded in 1959 after much debate in the parliament. It has been offering only the typical match result estimation (Spor Toto) until “iddaa” the fixed odds betting has been launched in 2004.
Inteltek Internet Teknoloji Yatırım ve Danışmanlık Ticaret A.Ş. has become the preferred bidder through direct provision and continues the betting game called iddaa. Under this income based subcontracting agreement, Inteltek conducts not only corporate communications and marketing operations of iddaa and Spor Toto games but also manages sales and distribution network including all technical and logistics requirements. More importantly risk management is run by Inteltek.
Risk management is the most important element of fixed-odds betting operations, the total amount players can win by a single coupon is limited with 500.000 YTL, however theoretically there is no limit on the number of winners. With more than 50% tax burden, there a great disadvantage compared to international operators. The income share ratio has been 11,4% before the recent tender, now Inteltek will continue with 1,4 %. In March 2009, basketball and other sports will be added to iddaa menu.
In 2007 total revenues of the three authorities is around YTL 6 billion. All the three organizations have a typical stationary agent network. Since 2005 Spor Toto and since 2006 TJK and Milli Piyango have electronic agents offering different types of games via alternative channels like Internet, mobile and digital TV, although there is not a real competitive environment. Spor Toto and iddaa, games offered by Spor Toto Teşkilatı,
are accessible via two e-agents namely Bilyoner and Nesine. However TJK and Milli Piyango games are only offered by Bilyoner as of October 2008.
Milli Piyango privatization is the next hot topic in the industry not only in Turkey but also in international arena. The population of Turkey and the current offering attracts major players of the industry.
2.1.4 Legal Environment
In the previous section, all the legal gaming activities are summarized. As an addition to legal betting in Turkey, illegal activities shall also be emphasized. Especially from late 90’s with the increasing penetration rate of Internet, until Spor Toto tender, online sports betting have been very popular in Turkey. Even after iddaa, several companies have conducted Turkey operations, with either a localized web page or a new brand for their Turkish customers. Some of them even launched Liaison Offices to run their marketing activities. Even if all activities were illegal, there have been gaps in laws and regulations. According to Sportingbet Annual Report of 2007, its’ Turkish Marketing Partner Superbahis’ 2007 turnover amount to £127 million.
In Turkey, online gambling and betting activities are regulated under several laws and regulations (Official Gazette Numbers 25772, 25611, 26530, 26108, 10201, and 26448):
1. Misdemeanors Law, 2. Turkish Criminal Code,
3. Law No. 5651 on the Regulation of Publications on the Internet and Suppression of Crimes Committed by means of Such Publications,
4. Online Gaming Regulation
5. Law No. 7258 on Betting Activities Related to Soccer and other Sports Matches recently amended by Law No. 5583.
All the recent laws and regulations passed by the parliament are as a result of the high tax income generated by iddaa and the continuing off-shore betting activities. It is assumed that almost half of sports betting originating from Turkey are placed in illegal channels. There has been a huge loss of tax revenue and therefore several measures have been taken.
All online gaming is monitored by a body formed under the Gaming Directorate of Milli Piyango. Inspectors sent results of such investigations to the legal department of the Gaming Directorate. Legal department may open a case by the relevant courts, and initiate criminal proceedings against the operators. If the relevant court decides to suspend activities of the operator, the judgment is sent to the Telecommunications Authority to halt the publication of the web page by the internet service provider. Even if the service is provided outside of Turkey, the responsible of these entities may be sentenced to imprisonment up to five years and may be subject to monetary fines as well. The same penalties also apply for legal entities that offer advertising opportunities or allow money transfer to illegal betting companies. Of course it is practically impossible to implement any penalty to those individuals or legal entities unless they have a presence in Turkey.
2.1.5 Gaming Limitations
From end user perspective, there are important advantages of the above mentioned illegal channels for fixed-odds sports betting. The possible payout ratio cannot be over 50% at any period. On the other hand, most of the major international betting companies are running their operations in so-called tax-free grounds such as Malta, Gibraltar, Alderney, Guernsey or Isle of Man where the total tax ratios is between 1%-2,5%. The officially declared payout ratios from such companies are varying between 85%-93%. High taxes still build a barrier for a more successful betting environment in Turkey and bettors still try and find a way to play overseas. The advantages are as follows:
1. Single match: Bettors can place a bet on a single event at any time. For iddaa, this is one of the most important disadvantages; the risk is so high that offering single event bets is very seldom.
2. Odds: The odds are considerably higher (1,45 compared to 1,65). Again an issue related to high taxes applied in Turkey.
3. Live betting: Most of the currently banned betting operators, are offering live betting on a single event. So members can bet during a game at any minute about several different options. This is also not offered yet in Turkey by iddaa. 4. Variety of events: Today, iddaa is still limited with soccer, however other sport
types will be added as of March 2009 as mentioned above.
Today it is still a fact that millions of Liras are bet on off-shore operators either via phone or even terminals placed in Turkey.
2.1.6 Economic Contribution
In Turkey everyone who plays any type of games of chance, should know that the odds declared as a result of high taxes and therefore the payout ratio is maximum 50%. The rest besides service provider and agency fees, is distributed among several state institutions.
There are 2 tax types applied in general: Value Added Tax (KDV, Katma Değer Vergisi) and Tax on Games of Chance (ŞOV, Şans Oyunları Vergisi). Entertainment Tax (Eğlence Vergisi) is only applied to Horse Races.
It is a fact that Turkish football teams continuously increase their budgets as a result of high iddaa revenues generated in the last 4 years. 9,7% of overall iddaa sales are supporting clubs’ budgets and this result in higher transfer budgets or other investments. Today even average Turkcell Super League clubs can utilize most of the foreign player quotas which has not been imaginable 5 years ago.
A sample distribution table of betting revenues is provided in Table 2.2 below. The total contribution to state organizations, sports clubs or other contribution in form of tax revenues are presented in this table. Even if it is subject to change, total payout can never be over 50 % at a period.
Table 2.2 Tax Distribution Table of Fix-Odds Betting Revenues (June 2007)
Source: www.sportoto.gov.tr (June 2007)
Tax or State Institution Share
Tax on Games of Luck 3,00 %
Value Added Tax 13,32 %
Sports Clubs 9,70 %
Social Services and Child Protection Agency 0,84 % Defense Industry Support Fund 0,07 % National Olympic Committee 0,01 % General Directorate of Higher Education Credit and Hostels Institution 0,04 % Turkish Promotion Fund 0,02 %
2.2 Service Quality
2.2.1 Quality
The Quality Vocabulary (American Society for Quality, 2007) defines quality as “a subjective term for which each person has his or her own definition”. In technical usage, quality can have two meanings: the characteristics of a product or service that bear on its ability to satisfy stated or implied needs and product or service free of deficiencies. Juran (Juran, 1988) defines it as “fitness for use”, Philip B. Crosby (Crosby, 1979) as “conformance to requirements”. H. James Harrington (Harrington, 1987) says “Quality is meeting or exceeding customer expectations at a cost that represents value to them”. A. V. Feigenbaum (Feigenbaum, 1990) defines quality as “the total composite product and service characteristics of marketing, engineering, manufacturing, and maintenance through which the product and services in use will meet the expectations of the customer”, Kaoru Ishikawa in Japan Industrial Standards (Ishikawa, 1985) defines as “a system of production methods which economically produces quality goods or services meeting the requirements of consumers”
All definitions above were general statements for products not specifically services. Especially mobile content service or in specific mobile betting has different characteristics. The typical service characterization of Kotler (Kotler, 2001) as intangible, inseparable, variable and perishable fits to some extent but beyond this classic definition, today in a new era when most people are getting mobilized it becomes a life style.
2.2.2 E-Service Quality
When mobile content services are considered, all of the definition fully applies with management implications. The nature of mobile content services from Kotler’s marketing perspective mentioned in previous section can be categorized as hybrid or major service with accompanying goods and services. The quality of the service, on the contrary to products, is not only judged on the evidence of the outcome itself, but also the aspect of the way in which it was produced (Slack et.al 2000). Slack creates a unified view from the operational and customers’ perception and defines quality as “the degree of fit between customers’ expectations and their perception of the product or service”. Therefore the approach used in this research will be instead of a transcendent or manufacturing, a user (fit for its purpose)-product (measurable set of characteristics)-value based (cost-and-price) approach (Garvin, 1988).
The most important difference between traditional and electronic service quality comes from the actors of interaction. In e-services, a machine is replacing the human interaction. Therefore the typical dimensions and variables also differ. The typical dimensions in traditional service quality are tangibles, reliability, responsiveness, assurance and empathy (Parasuraman et.al 1988).
2.2.3 Service Quality and Customer Satisfaction
In the evolution of service quality concept, one of the major issues has been distinguishing it from the concept of customer satisfaction. There is a consensus that the two are “conceptually distinct, yet empirically overlapping constructs” (Schneider et al, 2003), but there is still debate going on about details. The definitions provided in the previous section all figure that service quality from a user’s perspective is user’s judgment about the service itself, whereas satisfaction is more a judgment on the emotional effects of the service perceived by the user. Quality perception develops
before personal experience even by advertisement and word of mouth communication, however satisfaction, consumer has personally experience the service.
Next is a more important question which will directly affect the questionnaire and the model to be established: Does satisfaction cause quality judgments or vice versa? There is a consensus on this: quality judgments cause satisfaction. (Schneider et al 2003).
As a summary of different definition, service quality can be best described as judgment of customers on different levels of service characteristics which lead to customer satisfaction.
2.3 Measurement Framework Models
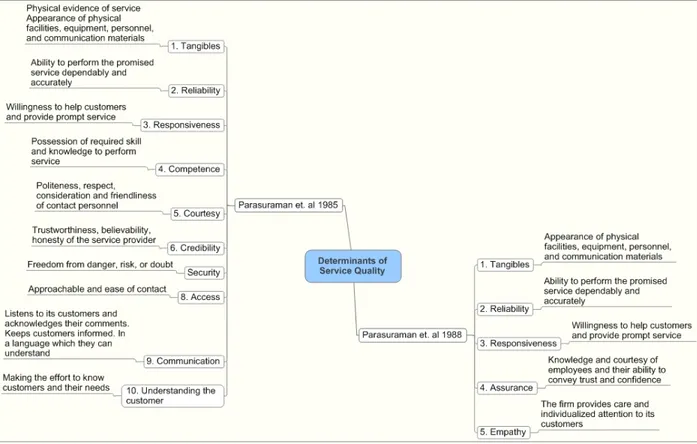
Quality has been a topic researcher deal for a century however models for measuring quality of services developed date back to late 80s. There are several methods some of which will be studied in detail. SERVQUAL is the most important one and much research conducted has been based on this model. Therefore this section starts with a comprehensive analysis of the research conducted by Parasuraman, Zeitahml and Berry.
2.3.1 SERVQUAL
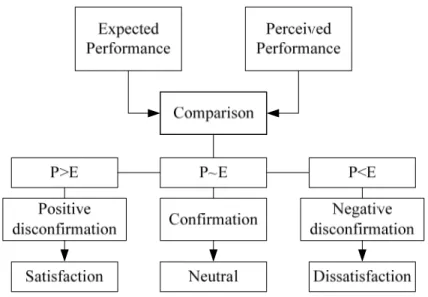
The last service quality definition is in parallel with the SERVQUAL model which measures the difference between customer expectations of service and perceived service. Its foundations lie back in the gap model presented by Parasuraman, Zeitahml and Berry (1985, 1988) with roots in disconfirmation paradigm1 (Walker, 1995).
Source: Walker (1995) Journal of Services Marketing, pp 6.
In the first research in 1985 there has been limited literature on service quality measurement and therefore the authors started with an exploratory qualitative study to investigate the concept. They conducted focus group interviews with consumers and in-depth interviews with executives from different departments (Customer Relations, Marketing, Operations and Senior Management) of 4 well recognized service companies to find answers to the following questions:
• What do managers of service firms perceive to be the key attributes of service quality? What problems and tasks are involved in providing high quality service?
• What do consumers perceive to be the key attributes of service quality? • Do discrepancies exist between both perceptions?
• Can both perceptions be combined in a general model that explains service quality from the consumers’ standpoint?
They chose 4 service categories for investigation, retail banking, credit card, securities brokerage and product repair and maintenance. 3 focus groups for each sector were
conducted with recent male and female customers of each company. As a result of focus groups and in-depth interviews commonalities among industries prevailed. However, they also identified 5 gaps presented in Figure 2.2 below.
Figure 2.2 Service Quality Model
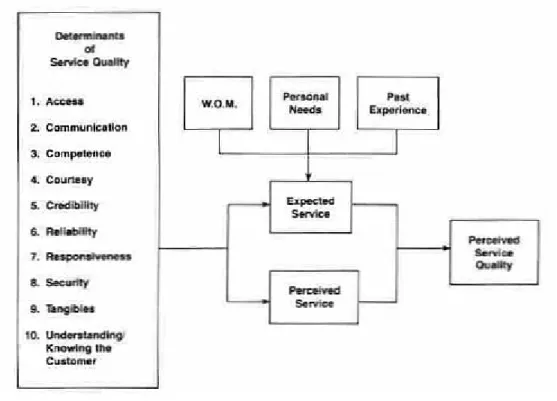
They proposed regardless of the service, consumers used similar criteria to evaluate services, which fall into 10 key categories labeled as “service quality determinants” shown in figure 2.3 below.
Figure 2.3 Determinants of Perceived Service Quality
Source: Parasuraman et.al (1985) Journal of Marketing, Fall 85, pp 48
If the expectations are higher than the perceived performance perceived quality is not satisfactory. The SERVQUAL technique is the mostly used method for measuring service quality.
In 1988 they focused on the 10 determinants of the service quality and after a two-step scale purification, they reduced the number to 5 ranked in order of importance: reliability, assurance, tangibles, responsiveness and empathy.
This technique consists of three sections, and is based on the above shown gap analysis which is conducted measuring the discrepancies of a providers’ service quality performance against customer service quality expectations or needs. This empirical technique can be used in any traditional service organization to increase performance and improve quality. In this method to understand the needs and expectations of target or existing customers a questionnaire is run. In the original research data was collected from 2 banks, 2 telephone companies and 2 insurance companies and questionnaires were dispensed using mail. Sample size differed between 290 and 487. The first questionnaire consisted of 22 items.
The second questionnaire is provided to see the existing level of service quality perceived by the usage of the service again including 22 items. In both, customer is asked to rate expectations / perceptions on a seven point Likert scale (1 strongly disagree, 7 strongly agree). The result of the gap analysis is Perceived Performance- Expectations. In the 3rd stage level of importance of five key determinants/dimensions are measured to weight the final service quality score. Data analysis included factorial analysis followed by oblique rotation. Reliability declared (Cronbachs’s alpha coefficient) was between 0.8 and 0.93. Dimensions are shown in Figure 2.
where:
SQi = perceived service quality of individual ‘i’ k = number of service attributes/items
P = perception of individual ‘i’ with respect to performance of a service firm attribute ‘j’
E = service quality expectation for attribute ‘j’ that is the relevant norm for individual ‘i’
The SERVQUAL scale has been criticized on various grounds. Major critics concentrate on the length of the questionnaire, the use of (P-E) gap scores, predictive power of the instrument, and validity of the five-dimension structure (e.g., Babakus and Boller, 1992; Cronin and Taylor, 1992).
Development of determinant of service quality by Parasuraman et al. can be seen below in Figure 2.3.
2.3.2 SERVPERF
Since the ground-breaking introduction of SERVQUAL method in 1988, discussions are still going on the concept, and validity. Cronin and Taylor (1992) were amongst the critics who developed a new scale called SERVPERF. The new model excluded E, the expectation component, and instead P, performance component be used alone; so service quality is evaluated by perceptions only, without expectations and without importance weights. Higher perceived performance means higher service quality.
They provided empirical evidence to prove the superiority of the new instrument over the SERVQUAL in several industries (namely banks, pest control, dry cleaning, and fast food). They used very similar methodology during the research; the response scale is a seven point Likert scale, questionnaires dispensed via mail and data analysis again included factorial analysis followed by oblique rotation. Reliability declared was between 0.63 and 0.98.
where:
SQi = perceived service quality of individual ‘i’ k = number of attributes/items
P = perception of individual ‘i’ with respect to performance of a service firm on attribute ‘j’
It is a fact that service quality attributes are not equally important among different sector, for this reason, Cronin and Taylor included important weights in the formula (Zeitahml et al did the same later in 1998):
Zeithaml in a study admitted that “…Our results are incompatible with both the one-dimensional view of expectations and the gap formation for service quality. Instead, we find that perceived quality is directly influenced only by perception (of performance).” (Boulding et al., 1993). This confession alone may proof the superiority of the SERVPERF scale.
2.3.3 WebQual or WebQual/M
Barnes and Vidgen developed the model based on Quality Function Deployment (QFD), “structured and disciplined process that provides a means to identify and carry the voice of the customer through each stage of product and or service development and implementation” (Slabey, 1990). The process starts with capturing the “voice of customer” turning them into business / software development requirements and offer as quality of service. All qualitative customer assessments are turned into quantitative metrics which offer a tool for managerial decision making. The tool is used in two separate ways; either to compare sites in the same sector or reevaluate the same site over a time period to observe changes and take necessary measures.
In the survey users are asked to rate target web/wap sites for each quality against a 5 point scale and also appoint importance to each of the qualities.
The three main dimensions customer perceived quality in the model are information quality, interaction quality and Web site design quality. Information quality is based on the communications theory of the information systems literature and is therefore more suitable for information intensive sites like news. Interaction quality is derived from SERVQUAL, and Web site design is based on usability or ergonomics literature.
WebQual is a transaction specific assessment of a web site. It does not offer a tool to measure the quality of a web site, rather provides a comparison or improvement framework for web designers.
2.3.4 WebQual™
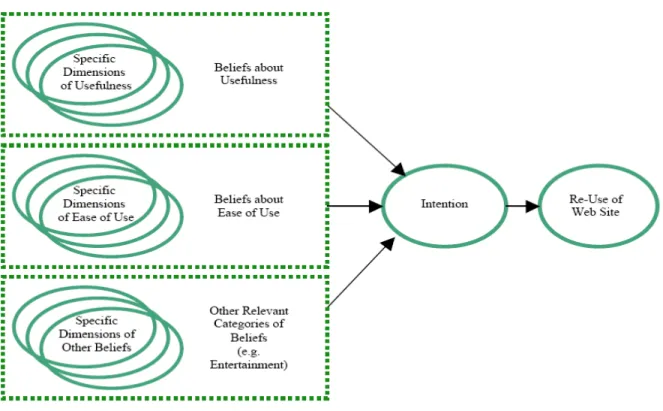
This model Loiacono et.al (2002) is based on Theory of Reasoned Action (TRA) (Fishbein and Ajzen, 1975), Technology Acceptance Model (TAM) (Davis, 1989) and develops a measure of Web site quality that predicts customers reuse of the site with 12 core dimensions: informational fit-to-task; tailored communications; trust; response time; ease of understanding; intuitive operations; visual appeal; innovativeness; emotional appeal; consistent image; on-line completeness; and relative advantage.
Source: Fishbein-Aizen (1975), pp 16
The authors believe that while both theories providing a strong conceptual basis, they both have limitations: TAM only identifies two very general beliefs, ease of use and usefulness and TRA does not specify which beliefs are adequate for technology use.
Source: Davis (1989) pp 320
Figure 2.5 Theory of Reasoned Action
Figure 2.6 Technology Acceptance Model
Beliefs and Evaluations
Attitude Towards Behaviour
Normative Beliefs and
Motivation to comply Subjective Norms
Behavioural Intention
Actual Behaviour
Perceived Usefulness
Perceived Ease of Use
Behavioural Intention to
Use
Actual System Use
They argue that web sites are a form of information system and therefore theories related to information systems are appropriate, however, using a website is also a marketing interaction and therefore they utilized from both Marketing and MIS literature. Further they tried to underline multiple distinct dimensions under ease of use or usefulness and any others. So the final model is a composition of both TAM and TRA.
The main purpose of the measurement scale is not measuring the quality, on the other hand generating information for web site designers. Some dimensions of the scale like innovativeness, business processes and relative advantage (substitutability) are not aimed to measure the quality of the service and another very important aspect which is customer service is excluded because the methodology used cannot measure it.
Figure 2.7 WebQualTM Model
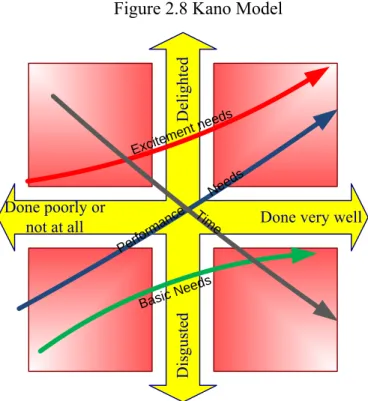
2.3.5 Web Site Quality Model
According to Zhang & von Dran (2002) consumers’ preferences, requirements vary across different e-commerce domains and may change over time. In order to develop their model, they used Kano quality model (Kano et al, 1984) to understand customers’ expected quality factors.
Figure 2.8 Kano Model
Source: www.KanoModel.com
The model can be used as a checklist of quality factors for web site design by web designers. It does not offer a way to measure the quality of the service.
Done poorly or not at all De lighted Dis guste d
Done very well
Excitem ent ne eds Perfo rman ce Ne eds Basic N eeds Tim e
2.3.6 E-S-QUAL
Parasuraman, Zeitahml and Malhotra in 2000 extended SERQUAL to E-S-QUAL (Parasuraman et al, 2005) trying to create a “Multiple-Item Scale for Assessing Electronic Service Quality”. They argue that customers’ assessment of web site quality should not only include aspects during the interaction, but also post interaction. So based on their SERVQUAL methodology, they created a new scale for electronic domain. The dimensions in the new scale are as follows:
Reliability: Correct technical functioning of the site and the accuracy of service promises (having items in stock, delivering what is ordered, delivering when promised), billing, and product information.
Responsiveness: Quick response and the ability to get help if there is a problem or question.
Access: Ability to get on the site quickly and to reach the company when needed. Flexibility: Choice of ways to pay, ship, buy, search for, and return items.
Ease of navigation: Site contains functions that help customers find what they need without difficulty, has good search functionality, and allows the customer to maneuver easily and quickly back and forth through the pages.
Efficiency: Site is simple to use, structured properly, and requires a minimum of information to be input by the customer.
Assurance/trust: Confidence the customer feels in dealing with the site and is due to the reputation of the site and the products or services it sells, as well as clear and truthful information presented.
Security/privacy: Degree to which the customer believes the site is safe from intrusion and personal information is protected
Price knowledge: Extent to which the customer can determine shipping price, total price, and comparative prices during the shopping process.
Site aesthetics: Appearance of the site.
Customization/personalization: How much and how easily the site can be tailored to individual customers’ preferences, histories, and ways of shopping
Working on the new domain, they hired a research firm to conduct the survey to test the new dimensions. After several iterations they finalized two different scales, one for the assessment of the site’s quality during the interaction and one for the post interaction. The final E-S-QUAL scale they formed consists of 22 items on the following 4 dimensions:
Efficiency: The ease and speed of accessing and using the site.
Fulfillment: The extent to which the site’s promises about order delivery and item availability are fulfilled.
System availability: The correct technical functioning of the site.
Privacy: The degree to which the site is safe and protects customer information.
As mentioned above, the scale only includes the constructs during the interaction with the website. For the post interaction process (or in their own words the “recovery service provided by the websites”) they created a scale called as e-recovery service quality; E-RecS-QUAL including 11 items on the following 3 dimensions:
Responsiveness: Effective handling of problems and returns through the site. Compensation: The degree to which the site compensates customers for problems. Contact: The availability of assistance through telephone or online representatives.
2.3.7 Quality of Service-related Technical Standards
The International Telecommunication Union (ITU) created a set of recommendations in the area of QoS covering areas of general QoS frameworks-management and measurement. Most of them are also adopted and issued by the International Standardization Organization (ISO).
ITU-T E.800: A thorough survey of the QoS concept is found in the ITU-T standard E.800 from 1994 relating QoS and network performance and providing a set of performance measures especially for telecommunication networks.
Lack in those recommendations is simply the user perception and end-to-end service experience since all concentrate to issues only from a technical point of view. Also those are all about QoS for voice services, but not for non-voice services.
2.3.8 Other Methods
Yoo and Donthu developed a nine-item web site quality measurement scale called SITEQUAL (Yoo and Donthu, 2001). The scale uses four dimensions: ease of use, aesthetic design, processing speed and security. It only covers some of the aspects of quality and is therefore not a comprehensive assessment.
Szymanski and Hise studied the role that user perceptions play in e-satisfaction assessments (Szymanski and Hise, 2000) using an online survey. The dimensions included were online convenience, merchandising, site design and financial security. This study measured customer satisfaction rather than service quality.
There are several other methods developed based on SERVQUAL method such as Normed Quality by Teas in 1993, Two-Way proposed by Schvaneveldt, Enkawa, and Miyakawa in 1991 and QUALITOMETRO proposed by Franceschini and Rossetto in 1997 (Franceschini et al., 1998).
2.4 Summary and Critical Review
There are several critics about the use of SERVQUAL instrument especially in the use of Information Systems or electronic services. “The perception component of the difference score exhibits better reliability, convergent validity, and predictive validity than the perception-minus-expectation difference score” says Van Dyke (Van Dyke 2000, pp 205) and offers to use Perceived Quality score instead of Expected Quality-Perceived Quality.
SERVPERF which is derived from SERVQUAL and proofs to be superior to it eliminated the Expectation level and included the weight factor however, the quality dimensions remained the same and applications in electronic services are not found during the literature review.
WebQual is mostly criticized on theoretical level for its validity and reliability. It also lacks the post purchase steps of the customer life-cycle. Even if it overall focuses to help web designers to build better sites, it lacks to provide specific guidance on how to develop.
The most recent research by Zeitahml and Parasuraman is superior to all the other previously mentioned methodologies from several aspects:
1. It aims to measure the service quality instead of providing a guideline for web designers or measure overall satisfaction.
2. It has been tested with real customers who match several criteria for being respondents unlike others which have only been tested by convenience samples (most of them were tested in university classrooms by students and stuff) who have been directed to visit some websites and fill in the questionnaires accordingly.
There are also some deficiencies in the final version. Some dimensions and items although evaluated in previous research by the same authors were not included in E-S-QUAL:
1. Customization or personalization is not evaluated in depth. Even if these functions do not belong to basic functionality since year 2000, it has been provided in Internet. Therefore customers are used to it and it became a necessity for much users.
2. Flexibility or providing alternative ways for completing transactions is neither included among dimensions nor among the questions asked. Even it is again not a must during a single transaction; subsequent usage makes it more and more important.
3. Graphical interface or Site aesthetics is not included which not only makes users’ first interaction friendlier but also drives users to visit more frequently when offers a nice look and feel and is updated regularly. Appearance of the site has also an effect besides easy navigation when online users have to choose among alternatives.
4. Relative advantage which has been emphasized by Loiacono et al is a construct which the authors claim to be irrelevant with quality measurement. Loiacono used this construct to compare electronic service with traditional or conventional ways of completing transactions. From customers’ point of view even this does not directly reflect quality, disregarding substitutability as a quality dimension is in contradiction with their own definition of e-service quality: “The extent to which a Web site facilitates efficient and effective shopping, purchasing, and delivery.”
Chapter 3
Research Methodology
This chapter presents the theoretical and methodological considerations related to the research process. Starting with the structure of the thesis, development of the research design, empirical setting and choice of the respondents are reflected
3.1 Pre-understanding
To understand mobile betting behavior in Turkey, first of all, traditional ways of betting should be summarized.
3.1.1 Traditional Ways of Betting
Not only in Turkey, but all over the world traditional ways of gaming is standard: Who wants to play iddaa or Altılı goes to a nearby stationary agent with cash in pocket, places a bet, pays for the approved ticket and with the ticket either leaves the shop or waits to see the results on television. (In some countries like Sweden, ready coupons for horse racing filled in by the machine called Quick Pick are sold like Milli Piyango tickets on the street.)
If the bettor becomes a frequent visitor, there is an unofficial credit offered and so it becomes possible to play without pre-paying. Placing bets via phone is also a natural result of being a frequent visitor.
In both cases, if a person wins, there are two ways of withdrawing the prize money. The winner goes to the shop with the ticket and receives the payment. If the prize is a high amount (differs among game types) the person either has to go to a bank or to the premises of the central authority to withdraw money. The risk of carrying the ticket or money is something people do not want to take.
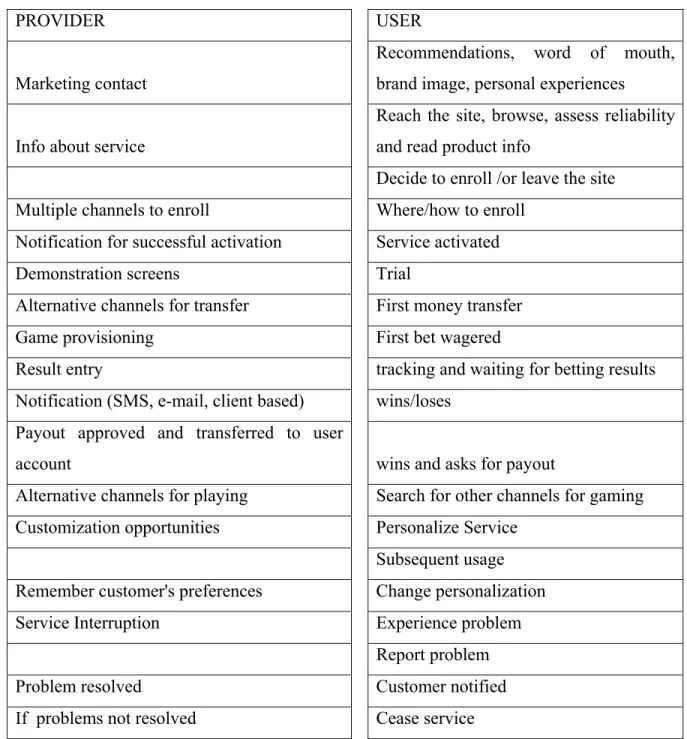
3.1.2 Interactions in Mobile Betting
The model of customer interactions below shows the steps of user-provider relations in detail, including alternative decisions players may take. Previous research mostly focus on a single interaction level, however, pre and post interactions shall be examined in detail for a better understanding of the interaction as a whole and development a complete measure for quality measurement:
Table 3.1 Model of User Interactions
PROVIDER USER
Marketing contact
Recommendations, word of mouth, brand image, personal experiences
Info about service
Reach the site, browse, assess reliability and read product info
Decide to enroll /or leave the site Multiple channels to enroll Where/how to enroll
Notification for successful activation Service activated Demonstration screens Trial
Alternative channels for transfer First money transfer Game provisioning First bet wagered
Result entry tracking and waiting for betting results Notification (SMS, e-mail, client based) wins/loses
Payout approved and transferred to user
account wins and asks for payout
Alternative channels for playing Search for other channels for gaming Customization opportunities Personalize Service
Subsequent usage
Remember customer's preferences Change personalization Service Interruption Experience problem
Report problem
Problem resolved Customer notified If problems not resolved Cease service