ÇATALHÖYÜK Uluslararası Turizm ve Sosyal Araştırmalar Dergisi Yıl: 2016, Sayı: 1 – Sayfa: 251‐269 ÇATALHÖYÜK International Journal of Tourism and Social Research Year: 2016, Issue: 1 – Page: 251‐269
EFFECT OF MEASURED PERCEİVED SERVICE QUALITY ON CUSTOMER SATISFACTION WITH HOTELZOT MODEL
Hotelzot Yöntemiyle Ölçülen Algılanan Hizmet Kalitesinin Müşteri Memnuniyeti Üzerine Etkisi
Şafak ÜNÜVAR* Simge TOKAY** ABSTRACT The main condition is quality service for businessess in tourism with intense competition to continue their existence. However, the parties are touristic consumers to assess the quality. The aim of this research is to evaluate perceived service quality levels of domes‐ tic and foreign tourists who visited Antalya‐Kaş district and to measure the impact of these perceptions on satisfaction. In order to measure the perceived service quality, HO‐ TELZOT scale by Nadiri and Hussain (2005) is used. The study in which goal directed sampling from non‐random sampling method was preferred includes customers (n=435) of Tourism Licensed Facilities at Antalya‐Kaş district. All of the scale, which customers evaluated the service quality of hotel business they accommodated, and reliability and validity for each factor (Confirmatory Factor Analysis) were tested. In order to determine the effect of perceived service quality on satisfaction; regression, to determine the diffe‐ rence between groups; Independent samples t‐test and ANOVA test were utilized from measures of central tendency as well as the main determinant statistics for the analysis of data. Data were analyzed by using SPSS 21.0 and AMOS 22.0. As a result of data obta‐ ined from the sample, it is seen that the scale consists of two dimensions as tangibles and intangibles, perceived service quality significantly predicts customer satisfaction, there is differentiation between the groups according to some demographic factors. Key Words: Perceived Service Quality, Hotel Businesses, Hotelzot Scale, Customer Satis‐ faction. ÖZ
Yoğun rekabetin yaşandığı turizmde, işletmelerin varlıklarını devam ettirebilmelerinin temel koşulu kaliteli hizmet sunmaktan geçmektedir. Ancak kaliteyi değerlendirecek taraf ise turistik tüketicilerdir. Bu çalışmanın amacı, Kaş‐Antalya bölgesine gelen turistlerin algı‐ lanan hizmet kalitesi düzeyinin belirlenmesi ve bu algılamalarının memnuniyet üzerine etkisinin ölçülmesidir. Algılanan hizmet kalitesini ölçmek amacıyla Nadiri ve Hussain (2005) tarafından geliştirilen HOTELZOT ölçeği kullanılmıştır. Tesadüfi olmayan örnekle‐ me yöntemlerinden amaca göre örnekleme yönteminin tercih edildiği araştırma kapsa‐ mına Kaş‐Antalya bölgesinde faaliyet gösteren turizm işletme belgeli otellerde konakla‐ yan otellerin müşterileri (n=435) dahil edilmiştir. Müşterilerin konakladıkları otel işletme‐ sinin hizmet kalitesini değerlendirdikleri ölçeğin tümüne ve her bir faktörüne yönelik gü‐ * Assoc. Prof. Dr., Şafak Ünüvar, Selcuk University, Tourism Faculty, Department of Tourism Management, [email protected] ** Res. Assist. Simge Tokay, Selcuk University, Beysehir Ali Akkanat Tourism Faculty, Travel Management and Tour Guiding Department, [email protected]
venirlik ve geçerlik (doğrulayıcı faktör analizi) testleri yapılmıştır. Verilerin analizi için mer‐ kezi eğilim ölçülerinden ve temel belirleyici istatistiklerin yanı sıra algılanan hizmet kalite‐ sinin memnuniyet üzerine etkisini belirlemek amacıyla regresyon ve gruplar arasında farklılıkların belirlenmesi amacıyla bağımsız örneklem t‐testi ve anova testinden faydala‐ nılmıştır. Veriler SPSS 21.00 ve AMOS 22.00 kullanılarak analiz edilmiştir. Örneklemden elde edilen veriler sonucunda ölçeğin somut ve soyut olmak üzere iki boyutta oluştuğu, algılanan hizmet kalitesinin müşteri memnuniyetini önemli oranda yordadığı, bazı de‐ mografik faktörlere göre de gruplar arasında farklılaşma olduğu görülmüştür.
Anahtar Kelimeler: Algılanan Hizmet Kalitesi, Otel İşletmeleri, HOTELZOT Ölçeği, Müşteri Memnuniyeti.
INTRODUCTION
A GROWING NUMBER of people join in tourism movements in line with their desire to satisfy a number of needs (recreation, entertainment, sightseeing, edu-cation, culture, sports, health, language, religion and so on) by benefiting from the services offered by the tourism. While the number of people joined in inter-national tourism was 1,138 billion in 2014, this number has reached to 1,180 billion by increasing 4.4 % in 2015. It is expected that the number of people par-ticipating in international tourism will reach 1,8 billion as of 2030. Tourism was started to be discussed scientifically since the impacts of tourism events reflected on the countries’ publics increase depending on its gradual widespread status, and the tourism has taken part in economic and social sciences as a discipline since 1930s (Bayer, 1992).
Tourism can be defined as a travel done by people with no intention of earn-ing money to outside the places where they live for the reasons such as leisure, entertaining, relaxing, and cultural or health for a certain period of time but may not exceed one year. Tourism is an outcome of human needs for whatever pur-pose the people participate in. In parallel to societal and economic development in the world, the increase of personal income level, the enhancement of speeds and capacities of transportation vehicles, the development of information and communication technology, the reduction of working times, the increase of paid holidays are among the most important factors affecting the development of tourism (Göral, Arslan, Tokay, 2014: 2). The number of individuals joining in tourism activities was also positively influenced along with these developments (Halis et al., 2009). When looking at the reflection of this case to the hotel indus-try, it is seen that many hotel services described as luxurious service before have already become a lifestyle for people and a competitive environment has oc-curred globally.
Today hotel managements understand that competition is useless by devel-opment of common hotel products such as rooms or other concrete elements and they see the necessity of defining intangible elements such as image, per-ceived value and superior service quality providing long-term competitive ad-vantage and allowing the highest level of satisfaction (Dörtyol, 2012: 5). It is necessary to consider the services offered and the perceived service quality in sustainable competitive advantage. Besides, the measurement of perceived quali-ty is extremely important in the evaluation of the current situation and devel-opment (Pura, 2005: 512). Hotel businesses can better understand competitive advantage, charm of hotels and their customer retention issues through infor-mation obtained for the perceived value (Milferner and Korda, 2011: 100). It is likely that businesses developing and implementing the concepts in question have a more sustainable success compared to others.
SERVICE QUALITY
Although there is no generally accepted definition with regard to service, it is defined in different ways in the literature. Generally, service is an activity that one side presents to the opposite side, not resulting with ownership of anything and basically untouched (Kotler & Armstrong 2005: 233). According to Lakhe and Mohanty (1995)’s definition; service is a production system that creates outputs which will also avail consumers in the process of supporting normal life beyond the economic sense as a result of processing certain inputs, converting and adding the value to said input. However, Parasuraman et. al. (1988) inter-preted the quality of service as the perception qualification occuring as a result of experience-based services received by customer.
Service quality has an important place in the tourism sector as in other ser-vice sectors. In particular, hotel industry which is a sub-branch of the tourism forms the basis of the process due to consumers' living experience during their stay at the hotel. Correspondingly, hotel management and staff must provide all moments of contact between the hotel and guests to turn into a positive experi-ence in terms of guests (Juwaheer and Ross, 2003). Quality in terms of tourism enterprises is a strategic tool used for the purpose of production of goods and services to meet present or discoverable needs of tourists, increasing the compa-ny's operational efficiency and lowering cost with the aid of effective cost control process (Oral, 2001: 216). As improving the quality of services is one of the most important means of increasing corporate competitiveness strength and perfor-mance productivity (Aykol, 2014: 28) hotel businesses also need to be attentive about it. In addition, quality of service also plays an important role in the success of tourism enterprises and maintaining it. Gradually developing structure of the tourism increases tourist expectations continuously. The high expectations and increased competition rather increases the importance of the work for the ser-vice quality in tourism sector (Kenzhebayeva, 2012: 28).
CUSTOMER SATISFACTION AND ITS MEASUREMENT WITH HO-TELZOT MODEL
Customer can be defined as “a person or organization who purchases a spe-cific brand product of a spespe-cific enterprise for commercial or personal purposes” (Taşkın, 2000: 19). Meanwhile customer satisfaction can also be defined as “cognitive and emotional response of the service, emerging as a result of com-parison of the customers’ expectation towards a service and the service experi-ence” (Yağcı et al., 2004: 53). In another words, customer satisfaction is the ex-tent of satisfaction of a customer’s needs, desires and expectations that affects the subsequent demand for goods or services and the interest in goods or services during the consumption of goods and services” (Atılgan, 2001). Meanwhile in
another source, customer satisfaction is defined as “evaluations of the post-consumption experience obtained by the customer, depending on the relation-ship between the perception of a product by the customer and the objective ele-ments of that service or product” (Oliver, 1997). In general, customer satisfac-tion occurs at the intersecsatisfac-tion of the customer’s expectasatisfac-tions and the benefits provided by the good or service purchased (Kılıç and Pelit, 2004: 114).
It is possible to mention many advantages provided by customer satisfaction to enterprises. When examined the studies carried out on the subject; it is ob-served that there are many positive impacts upon increase of the customer satis-faction such as the increase of customer’s desire for establishing and continuing relationship with the enterprise (Kelley and Davis, 1994; Morgan and Hunt, 1994; Lee and Heo, 2009), sharing positive experiences with others and in this direction being a positive reference on behalf of the enterprise (Söderlund, 1998), creating customer loyalty (Anderson et al., 1994; Oliver et al., 1999; Selvi and Ercan, 2006), providing positive feedback to the enterprise (Söderlund, 1998, Webb and Jagun,1997), the increase of number of customers and accord-ingly increase in profitability (Durmaz, 2006; Çakıcı, 1998; Hançer, 2003), con-tributing to customer citizenship behavior (Bettencourt, 1997) and eventually enhancement of enterprise performance (Gronholdt et al., 2000).
Satisfaction criteria in respect of the services offered to the customers who prefer these enterprises, become more complex since the hotel enterprises have a labor-intensive characteristic and the products produced rather have intangible characters. Enterprises are required to make further efforts on this subject (Emir, vd, 2010: 294). In this direction, customers in hotel enterprises determine the satisfaction by comparing the service and products offered and the goods and service they hoped for (Lau et al., 2005: 47, Emir, 2007). Although the as-sessment of satisfaction in hotel enterprises is made during the service delivery in general, it consists of an interaction between the customer and the employee offering the service (Pizam and Ellis, 1999: 330). Customer concept and satisfac-tion are very important for the hotel enterprises in the service sector. Satisfacsatisfac-tion in tourism is among the fundamental concepts that help explaining the tourism behavior. As a travel activity, customer satisfaction in tourism can be achieved by considering firstly customers’ demands and expectations (Dunnross and Iso-Ahola, 1991:236).
Nowadays, the studies intended for achievement of customer satisfaction have also been accelerated since the customers become more conscious and customer protection movements gain intensity. The factors like the increased international competition, new developments in quality concept and emergence of relational marketing concept, awareness of consumers along with the rising
education level in particular have revealed the importance required to be placed on the customer satisfaction (Kılıç and Pelit, 2004: 114).
Customer satisfaction is important in hotel enterprises operating in con-stantly developing tourism sector with respect to the customer expectations to be met by hotel enterprises, the sustainability of activities and the continuity of profitability when the business success and accordingly the economic inputs brought to the country are taken into account. In this context, customer satisfac-tion is supposed to be measured constantly. After demonstrating the current situation through satisfaction measurement, if positive the situation can be con-tinued, or if negative necessary measures are taken. Various scales have been developed to measure the customer satisfaction. One of them is the study con-ducted by Nadiri and Hussain (2005a) in hotel enterprises doing business in Northern Cyprus. They have put forward the idea of “tolerance zone” for as-sessment of service quality in hotel enterprises by configuring the SERVQUAL service quality measurement model and implemented by suggesting a new mod-el what they called HOTELZOT. The questionnaire configured by them is based on service expectations (competence and desired) and service perceptions. A total of 23 suggestions are available in the questionnaire configured. 22 of them have been derived through renewal and adaptation of original suggestions of the SERVQUAL questionnaire into the model. Five Point Likert scale (1=strongly disagree, 5= strongly agree) has been employed in measurement. There is an expression of “I have overall satisfied/pleased with the entire hotel services” also with respect to the customer satisfaction. The following definitions have been made in the study conducted (Nadiri and Hussain, 2005a: 267);
1. Tolerance range has been calculated for hotels as the difference between the desired service desired and the adequate service.
2. The measurement of service superiority has been calculated as the differ-ence between the desired and perceived service.
3. The measurement of the sufficiency of the service has been calculated as the difference between the adequate service and perceived service.
Source: Nadiri ve Hussain, 2005a: 265, adopted from Zeithaml et al., 1993:5.
When the dimensions of model are examined, tested by factor analysis, the new model has proved to be unsuitable for five propositions in the original model. Results in the new model are in accordance with just two dimen-sions.These are tangible and intangible attributes.
METHODOLOGY
The study examines the level of perceived service quality by tourists and the impact of this perception on satisfaction. HOTELZOT scale developed by Nadiri and Hussain (2005) was used in the study. Within scope of this purpose, in the method section of this research; there are sampling method, universe and sam-pling, data collection tool, data analysis and information related to the reliability and validity of scales used in the research.
Sampling and Participants
The universe of the research comprises domestic and foreign visitors who stay in hotel enterprises in Antalya-Kaş region between the dates September-December 2015. Sampling was preferred by considering that reaching the entire universe might be costly in terms of money and time because of number of tour-ists staying in the region is too much and sampling method based on the pur-pose was preferred, for this reason the tourists staying in hotel enterprises only having certificates from the Ministry of Culture and Tourism.
Data Collection Tool
HOTELZOT Scale, which was used in the research carried out by Nadiri and Hussain (2005) in hotel enterprises operating in Northern Cyprus, was used in this study. Nadiri and Hussain has put forward the idea of “tolerance zone” for service quality assessments in hotel enterprises by configuring the
SERV-QUAL service quality measurement model and they have implemented by pro-posing a new model what they call HOTELZOT. The scale configured by them is based on service expectations (adequacy and desired) and service perceptions. There are a total of 23 propositions in the questionnaire configured. 22 of them have been obtained through renewal after adapting original propositions in the SERVQUAL questionnaire to the model. Five-Likert (1-strongly disagree, 3-neither agree nor disagree, 5-strongly agree) scale has been used. Meanwhile, there is an expression “I have overall pleased/satisfied with all hotel services” with respect to customer satisfaction.
The questionnaire consists of two parts. There are information about the participants (gender, age, educational status, occupation, nationality, type of the hotel providing accommodation) in the first part; and HOTELZOT scale items in the second part. 1.000 questionnaires have been randomly given to the hotels included in the sampling between the dates September-December 2015. They have been handed to visitors by the managers of the enterprises during entrance to the hotel, and the questionnaire form was ensured to be filled in during the accommodation. 650 questionnaires among total 1000 questionnaires were filled, but 215 of them couldn’t be included in the application because of being filled incompletely/ incorrectly. Thus, a total 435 usable questionnaires were available.
Reliability and Validity of the Scales
Reliability coefficient (Cronbach Alpha) was looked for each scale in order to ascertain whether the scales used in the study were reliably or not. The relia-bility coefficient must be at least 0,70 for being able to assume a scale reliable (Altunışık et al. 2007). When the results in Table 4 are viewed, it is seen the scale’s reliability coefficients are above 0,70: Tangible; ,933, Intangible; ,981.
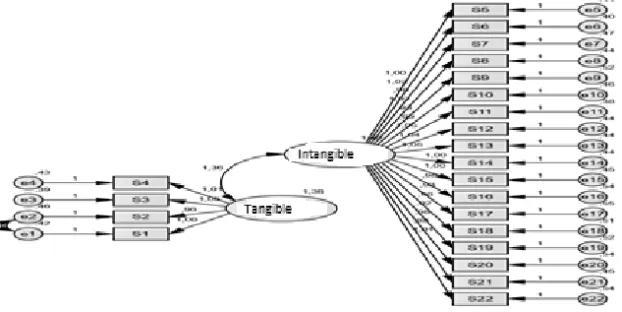
Confirmatory factor analysis was made to test the validity of the scales con-tained in the model. The diagram obcon-tained as a result of the Confirmatory Fac-tor Analysis conducted to examine the validity of tangible and intangible dimen-sions, is shown in Figure 1. Modification was applied to first and second ques-tions and concordance results obtained were given in Table 1. According to the results obtained, the questions in the scales are acceptable according to all con-cordance criteria and the validity of scales was provided by demonstrating good fit.
Table 1. Confirmatory Factor Analysis Result Item Concordance Values
Cohesion Criterion Value Result of Cohesion
2
(207)
sd
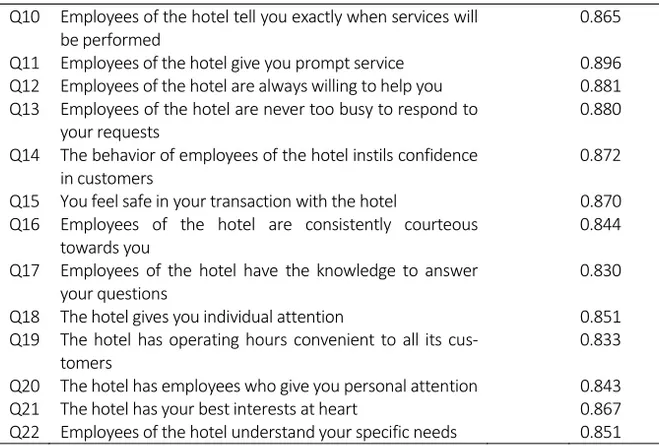
3.242 Acceptable Cohesion RMSEA 0.072 Acceptable Cohesion RMR 0.038 Good fit NFI 0.944 Acceptable Cohesion CFI 0.961 Acceptable Cohesion GFI 0.871 Acceptable Cohesion IFI 0.961 Good fitFactor loads relating to the propositions in the scale were given in Table 2. First four questions are in tangible dimension, the remaining questions are in intangible dimension.
Table 2: Item Factor Loads
Items Tangible Intangible
Q 1 The hotel has modern‐looking equipment 0.872 Q 2 The hotel’s physical facilities are visually Appealing 0.890 Q 3 The hotel’s employees are neat‐appearing 0.857 Q 4 Materials associated with the service are visually appealing at the hotel 0.874 Q 5 When the hotel promises to do something by a certain time, it does so 0.872 Q 6 When you have a problem, the hotel shows a sincere interest in solving it 0.888 Q 7 The hotel performs the service right the first time 0.862 Q 8 The hotel provides its services at the time it promises to do so 0.875 Q 9 The hotel insists on error‐free records 0.836
Q10 Employees of the hotel tell you exactly when services will be performed 0.865 Q11 Employees of the hotel give you prompt service 0.896 Q12 Employees of the hotel are always willing to help you 0.881 Q13 Employees of the hotel are never too busy to respond to your requests 0.880 Q14 The behavior of employees of the hotel instils confidence in customers 0.872 Q15 You feel safe in your transaction with the hotel 0.870
Q16 Employees of the hotel are consistently courteous towards you
0.844
Q17 Employees of the hotel have the knowledge to answer your questions
0.830
Q18 The hotel gives you individual attention 0.851
Q19 The hotel has operating hours convenient to all its cus‐ tomers 0.833 Q20 The hotel has employees who give you personal attention 0.843 Q21 The hotel has your best interests at heart 0.867 Q22 Employees of the hotel understand your specific needs 0.851 Analysis of Data
In the research, reliability and validity analyses related to the variables of the model have been done respectively, the levels of expressions provided in the scale have been determined by utilizing main determinant statistics (arithmetic average and standard deviation), the relationship between the variables specified in the research model and statistical analysis methods like correlation and re-gression has been tested. Moreover, Independent Sampling T Test and Anova tests have been made to see whether there is difference according to perceived service quality dimensions among groups according to demographic variables.
FINDINGS
Demographic Data about Participants
A total of 435 people participated in the research. Demographic variables of the participants were given in Table 3. 55.2% of the participants were women, 68.5% were English, 90.6 % were those who lodge in facilities except for 4 or 5-star hotels, 33.6% were between 38-47 ages, 26.9% were governmental emplo-yees, 37% had high school degree, 52.2% had middle income level.
Table 3: Demographic Variables Belonging to Participants Demographic Charac‐
teristics of Participants
Frequency Rate Demographic Characteristics of Participants
Gender ‐Female ‐Male 240 195 55,2 44,8 Hotel stay ‐4 star ‐5 star ‐Other 16 25 394 3,7 5,7 90,6 Age ‐18‐27 ‐28‐37 ‐38‐47 ‐48‐57 ‐58 and above 142 67 146 45 35 32,6 15,4 33,6 10,3 8,0 Occupation ‐Self‐employed ‐Professionals (eg. lawyers, doktors, engineers) ‐Students
‐Executive of a cor‐ poration
‐Governmental emp‐ loyees
‐Personnel of educa‐ tional
organization ‐Others (eg. retired,
housewives, labo‐ rers) 55 63 79 6 117 52 63 12,6 14,5 18,2 1,4 26,9 12,0 14,5 Level of education ‐Primary school ‐Secondary or high school ‐Vocational school ‐Undergraduate deg‐ ree ‐Master’s/doctorate degree 10 161 49 58 157 2,3 37,0 11,3 13,3 36,1 Level of income ‐Low ‐Medium ‐High 169 227 39 38,9 52,2 9,0 Nationality ‐Turkish ‐British ‐Other (European) 72 298 65 16,6 68,5 14,9
The Levels of the Variables in the Research Model
In the research, tourists have assessed the factors affecting their service qual-ity perceptions on hotel enterprises. Assessment results were given in Table 4. According to the results, it is seen that intangible level is higher (Average= 3,3499), tangible level is lower (Average= 3,25) among the tourists’ service quali-ty scale dimensions. Meanwhile, satisfaction level is seen to be (Average= 3,41).
Results of the Research Model
In the research model (Figure 2), the impact of (1) perceived service quality on (2) customer satisfaction has been examined.
Figure 2 : Model of Research
As a result of the research (Table 4), it has been found that there was positive and significant relationship between tangible (r =,88, p=,00), intangible (r =,92, p=,00) and satisfaction. The strongest relationship with satisfaction is the intan-gible dimension based on the correlation analysis results. In addition, it has been determined that there is positive and significant relationship between the tangi-ble dimension and intangitangi-ble dimension (r =,93, p=,00).
Table 4: Findings about Variables (Mean, Standard Deviation, Reliability Coefficient and Relations between Variables)
Variables NIa Mb SDc αd Tangible Intangible Satisfaction
Tangible 4 3,2500 1,22709 ,933 ‐
Intangible 18 3,3499 1,18581 ,981 ,937** ‐
Satisfactione 1 3,4138 1,35558 ‐ ,881** ,920** ‐
* p<0,01 (two way), **p<0,05 (two way), aNumber of Items, bMean, cStandard Devia‐
tion, dCronbach Alpha Coefficientı, eReliability of the factor is not assessed as it was mea‐
sured by sole item
It has been observed whether there were multiple connection problems among independent variables before proceeding to the regression tests. Test results showed that there was not multiple connection problems among inde-pendent variables, i.e. variance increase factors were less than 10, tolerance val-ues were greater than 0,10 and status indices were less than 30 (Hair et al. 1998; Büyüköztürk, 2009).
Regression analysis results were given in table 5 in order to explain the im-pact of independent variables (intangible, tangible) on dependent variable and the direction of this impact. Based on the results, tangible (β=,15, t= 2,85, p=,004) and intangible (β=,77, t= 14,85, p=,00) positively and significantly af-fects the customer satisfaction according to standardized regression coefficients.
Table 5: Regression Analysis Results Explaining Effects of Variables’ (Tangible, Intangible Variables)* on Customer Satisfaction Multiple R Coefficient = ,922 Coefficient of Determination (R²) = ,850 Adjustment R² (ΔR²)= ,849 Standard Error = ,52696 DW=1,959 Analysis of Variance Degree of Freedom Sum of Squares Mean Square F Test Perceived Service Quality Customer Satisfaction
Regression 2 677,557 338,778 1220,005 Error (remnant) 432 119,960 ,278 p=,00 Total 434 797,517 Beta Coefficients Independent Variable B SEB β t P Constant ‐,111 ,076 ‐1,459 ,145 1)‐ Tangible ,168 ,059 ,152 2,858 ,004 2)‐ Intangible ,889 ,061 ,777 14,586 ,000
B: B value germane to variable, SEB: standard error germane to B coefficient, β: Standardized regression coefficient (beta value), t: t value germane to Beta value, pb: Significance level germane to each variable . It is seen that there is no matter of multiple relationship from tolerance values and variance increase fac-tors.
Tests for Differences According to Demographic Variables
The data relating to the variables have been examined with graphic method whether they show normal distribution. For this, Q-Q plots were examined and it can be said that the data normally ranges according to the graphics. For this reason, parametric tests were carried out. Independent Sampling T Test and Anova Test were conducted to determine the differences among the groups. The analysis results are as follows:
-There is no difference according to Independent Sampling T Test results among groups with respect to gender.
-There is difference in Intangible dimension according to the results of Anova test aimed at determining the difference with respect to tangible and intangible dimension and age group, and it is seen that there is difference between 18-27 age group and 28-37 age group (p=,00) according to Tamhane multiple comparison test results conducted to find from which groups the diffe-rence is resulted.
-It is seen that there is difference in both dimensions based on Anova test re-sults aimed at determining the difference related to tangible and intangible di-mensions and educational level, and according to Tamhane multiple compari-son test results conducted to find from which groups the difference is resulted; with respect to Intangible dimension there is difference between Secondary School and Vocational School, Secondary School and Undergraduate, Vocatio-nal School and Graduate/Doctoral Degree, Undergraduate and Gradua-te/Doctoral Degree; with respect to Tangible dimension there is difference between Secondary School and Vocational School, Secondary School and
Un-dergraduate, Vocational School and Graduate/Doctoral Degree, Undergraduate and Graduate/Doctoral Degree.
-It is seen that there is difference in both dimensions based on Anova test re-sults aimed at determining the difference related to tangible and intangible di-mensions with nationalities of the participants. With respect to Tangible dimen-sion, based on the results of Tamhane multiple comparison test aimed at finding from which groups the difference is resulted, it is seen that there is difference between Turkish and English, English and other country citizens. And it is also seen that there is difference between English and other country citizens accor-ding to the results of Tamhane multiple comparison test aimed at finaccor-ding from which groups the difference is resulted with respect to intangible dimension.
-It is seen that there is difference in both dimensions according to the results of Anova test aimed at determining the difference related to tangible and intan-gible dimensions with the participants’ jobs. With respect to tanintan-gible dimension, it is seen that there is difference between Professional Employees and Students, Students and Other group according to the results of Tamhane multiple compa-rison test conducted to find from which groups the difference is resulted. With respect to intangible dimension, it is seen that there is difference between Profes-sional Employees and Students, Students and Other group according to the re-sults of Tamhane multiple comparison test conducted to find from which gro-ups the difference is resulted.
-There is no difference according to the results of Anova test aimed at de-termining the difference related to tangible and intangible dimension with the hotels which provide accommodation.
-It is seen that there is difference in both dimensions according to the results of Anova test aimed at determining the difference related to tangible and intan-gible dimensions with the participants’ income. With respect to tanintan-gible dimen-sion, it is seen that there is difference between lower and middle income level based on the results of Tamhane multiple comparison test conducted to find from which groups the difference is resulted (p=,00), and with respect to intan-gible dimension, there is difference between lower and middle income level ba-sed on the results of Tamhane multiple comparison test conducted to find from which groups the difference is resulted (p=,00).
CONCLUSION AND DISCUSSIONS
With globalization Tourism, has become one of the most important sectors in the world in recent years and the number of individuals who participate in tourism activities has increased day by day. Nowadays people tend to travel mo-re easily and momo-re often. Parallel to this development, hotel businesses which amo-re one of the basic dynamics of the sector, also improved qualitatively and
quanti-tatively. Differences in the customers' expectations also play part in reasons of hotel businesses operating in various classes. Both the importance of customer satisfaction in hotel businesses and the importance of quality of services are inc-reasing day by day in competitive environment. HOTELZOT method was con-ducted in this study to measure the satisfaction level of tourists coming to Kaş-Antalya region. The effect of measured perceived service quality on customer satisfaction was presented with the findings obtained from survey study and some determinations were made in this study.
According to the findings of the study, most of the participants consist of women tourists, between 38-47 ages, graduated from high school, English, stu-dents, those who have middle income level. Besides, according to the type of accommodation, tourists lodged most in facilities except from 4 or 5-star hotels were included in the study.As a result of tourists’ assessment of the factors affec-ting their service quality perceptions on hotel enterprises, it can be seen that intangible level from service quality scale is higher than tangible level. Hereun-der, we can conclude that the services offered are better than physical facilities of the businesses. According to the correlation analysis results between tangible, intangible factors and satisfaction, it has been found that there was positive and significant relationship between each of them. Once again, the strongest relati-onship with satisfaction is the intangible dimension.Apart from these, tests for differences in demographic variables were also conducted. There is no difference according to Independent Sampling T Test results among groups related with gender. In spite of that there is difference between Intangible dimension and age group, there is difference between level of education, nationalities of partici-pants, occupations of participartici-pants, their level of income and both tangible and Intangible dimensions.
Considering the customer satisfaction’s contribution to business success and economic input brought to country in the hotel business in tourism sector, it is important for hotel businesses in terms of meeting customer expectations, main-taining operations and continuing the profitability. In this context, the measu-rement of customer satisfaction continuously is also an important issue. By exposing the current situation with satisfaction measurement, it is essential to continue if the situation is positive or to take the necessary precautions if it is negative. Limitations of this study are as follows; making the research in a limi-ted area and in a city in this area, including limilimi-ted business and limiting the sample. So, it is suggested conducting research in all regions of Turkey, thus upgrading the sample volume and selecting with the random sampling method in order to reach more general results. The study is important and useful for fulfilling the gaps in Turkish literature on the subject by determining the impact
of quality of service on customer satisfaction in the hospitality business and thus to create awareness about the quality of service concept. •
REFERENCES
Altunışık, R., Coşkun, R., & Bayraktaroğlu, S. ve Yıldırım, E.(2007). Sosyal Bilimlerde Araştırma Yöntemleri SPSS Uygulamalı. Sakarya: Sakarya.
Anderson, E. W., Fornell, C. ve Lehmann, D. R. (1994). Customer Satisfaction, Market Share, and Profitability: Findings from Sweden. Journal of Marketing, 58, 53-66. Atılgan, E. (2001). Hizmet Kalitesi Yönetimi ve Seyahat Sektörüne Yönelik Bir
Uygula-ma. (Yayınlanmış Yüksek Lisans Tezi). Antalya: Akdeniz Üniversitesi Sosyal Bilim-ler Enstitüsü.
Aykol, Ş. (2014). Turizm İşletme Belgeli Restoranlarda Hizmet Kalitesi Ölçümü (Diyar-bakır Örneği). Yüksek Lisans Tezi. Mardin Artuklu Üniversitesi Sosyal Bilimler En-stitüsü, Mardin.
Bayer, M. Z. (1992). Turizme Giriş, İşletme Fakültesi Yayın No:253, İstanbul, Küre Ajans, s.3.
Bettencourt, L. A. (1997). Customer Voluntary Performance: Customers as Partners in Service Delivery, Journal of Retailing, 73, 383-406.
Çakıcı, C. (1998). Otel İşletmeciliğinde Müşteri Tatmin Düzeylerinin Değerlendirme Formları Kullanılarak Belirlenmesi. Anatolia: Turizm Araştırmaları Dergisi, 9, 9-16. Dörtyol, İ. T. (2012). Ulusal Kültürün Algılanan Hizmet Kalitesi Ve Algılanan Müşteri
Değeri Üzerindeki Etkisi: Turizm Sektöründe Bir Araştırma. Doktora Tezi, Cum-huriyet Üniversitesi Sosyal Bilimler Enstitüsü İşletme Ana Bilim Dalı, Sivas. Dunross, E. L. ve Iso-Ahola, S. E. (1991). Sightseeing Tourists’Motivation and
Satisfac-tion. Annals of Tourism Research, 18 (2), 226-236.
Durmaz, Y. (2006). Modern Pazarlamada Müsteri Memnuniyeti ve Evrensel Tüketici Hakları”, Journal of Yasar University, 1(3), 255-266.
Emir, O. (2007). Otel İşletmelerinde Müşterilerin Hizmet Beklentileri ve Memnuniyet (Tatmin) Düzeylerinin Değerlendirilmesi: Antalya’da Bir Araştırma. (Yayın-lanmamış Doktora Tezi), Afyon Kocatepe Üniversitesi Sosyal Bilimler Enstitüsü, Afyonkarahisar.
Emir, O., Kılıç, G., ve Pelit, E. (2010). Üç Yıldızlı Otel İşletmelerinde Müşteri Memnuni-yeti Üzerine Bir Araştırma, Süleyman Demirel Üniversitesi İktisadi ve İdari Bilimler Fakültesi Dergisi, C.15, S.3 s.291-310.
Göral, R., Arslan, M., Tokay, S. (2014). Kırsal Turizmin Sosyo-Ekonomik Etkileri: Beyşehir Destinasyon Alanı Üzerine Bir Değerlendirme, II. KOP Bölgesel Kalkınma Sempozyumu, Niğde.
Gronholdt, L., Martensen, A. ve Kristensen, K. (2000). The Relationship Between Cus-tomer Satisfaction and Loyalty: Crossindustry Differences. Total Quality Manage-ment, 11, 509-514.
Halis, M., & Güneş, E. (2009). Erzurum İli Turizm Kümelenme Potansiyeline Yönelik Bir Araştırma.
Hançer, M. (2003). Konaklama Endüstrisinde Müşteri Sadakati: Anlam, Önem, Etki ve Sonuçlar. Seyahat ve Turizm Araştırmaları Dergisi, 3, 1-2.
Juwaheer, T. D. ve Ross, D. L. (2003). A Study of Hotel Guest Perceptions in Mauritius, International Journal of Contemporary Hospitality Management, 15/2, 105-115.
Kelley W. S. ve Davis, M. A. (1994), Antecedents to Customer Expectations for Service Recovery. Journal of the Academy of Marketing Science,22, 52–61.
Kenzhebayeva, A. (2012). Turizm Sektöründe Hizmet Kalitesi: Türkiye ve Ka-zakistan’daki
Termal Otel İşletmelerinde Karşılaştırmalı Bir Araştırma, Yüksek Lisans Tezi, Gazi Ün-iversitesi Eğitim Bilimleri Enstitüsü, Ankara.
Kılıç, İ., Pelit, E. (2004). Yerli Turistlerin Memnuniyet Düzeyleri Üzerine Bir Araştırma, Anatolia Turizm Araştırmaları Dergisi, Cilt: 15, Sayı: 2, Güz.
Kotler, P., Armstrong, G. (2005). Principles of Marketing (11. Baskı). New Jersey: Pear-son Education.
Lakhe, R. R., & Mohanty, R. P. (1995). Understanding TQM in Service Systems. Interna-tional Journal of Quality & Reliability Management, 12(9), 139-153.
Lau M. P., Akbar, A.K. ve Fie D.Y. G. (2005). Service Quality: A Study of the Luxury Hotels in Malaysia. The Journal of American Academy of Business, 7(2), 46-55. Lee, S. ve Heo, C. Y. (2009). Corporate Social Responsibility and Customer Satisfaction
Among US Publicly Traded Hotels and Restaurants. International Journal of Hospi-tality Management, 28 (4), 635–637.
Milferner, B. ve Korda, A. P. (2011). Hotel İmage and Guests Satisfaction as a Source of Sustainable Competitive Advantage, International Journal of Sustainable Economy, 3 (1), 92-106.
Morgan, R. ve Hunt, S. D. (1994). The Commitment-Trust Theory of Relationship Mar-keting, Journal of MarMar-keting, 58, 20-38.
Nadiri, H. ve Hussain, K. (2005). Perceptions of Service Quality in North Cyprus Hotels, International Journal of Contemporary Hospitality Management, 17 (6), 469-480. Oliver, R. L. (1997). Satisfaction: A Behavioral Perspective on the Consumer.
McGraw-Hill, New York.
Oliver, R. L. ve Burke, R. R. (1999). Expectation Processes in Satisfaction Formation, Journal of Service Research, 1 (3), 196-214.
Oral, Saime (2001). Otel İşletmeciliği ve Otel İşletmelerinde Verimlilik Analizleri, 4. Baskı, Kanyılmaz Matbaası, İzmir.
Parasuraman, A., Zeithaml, V. A. & Berry, L. L. (1988). SERVQUAL: a Multiple-İtem Scale for Measuring Consumer Perceptions of Service Quality. Journal of Retailing, 64 (1), 14-40.
Pizam, A. ve Ellis, T. (1999). Customer Satisfaction and Its Measurement in Hospitality Enterprises. International Journal of Contemporary Hospitality Management, 11 (7), 326-339.
Pura, M. (2005). Linking Perceived Value and Loyalty in Location-based Mobile Services, Managing Service Quality, 15 (6), 509-538.
Selvi, M. S. ve Ercan F. (2006). Otel İşletmelerinde Müşteri Sadakatinin Değerlendirilme-si: İstanbul’daki Beş Yıldızlı Otel İşletmelerinde Bir Uygulama. Balıkesir Üniversitesi Sosyal Bilimler Enstitüsü Dergisi. 9 (15),159-188.
Söderlund, M. (1998). Customer Satisfaction and Its Consequences on Customer Behav-ior Revisited: The Impact of Different Levels of Satisfaction on Word-of-Mouth,
Feedback to The Supplier and Loyalty, International Journal of Service Industry Management, 9(2), 169-188.
Taşkın, E. (2000). Müşteri İlişkileri Eğitimi, 2. Baskı, Papatya Yayıncılık, Nisan, İstanbul. UNWTO, Dünya Turizm Örgütü, (2012). http://www.wttc.org/ (Erişim tarihi:
10.10.2015).
Webb, D. ve Jagun, A. (1997). Customer Care, Customer Satisfaction, Value, Loyalty and Complaining Behavior: Validation in a UK University Setting, Journal of Consumer Satisfaction, Dissatisfaction and Complaining Behavior, 10, 139-151.
Yağcı, M. İ., Koçak, G.N., Duman, T. (2004). Dinlenme Tesislerinde Hizmet Pazarlaması ve Müşteri Tatmini, Pazarlama Dünyası, Yıl: 18, Sayı: 2004-4, Temmuz- Ağustos.