T.C.
SELÇUK ÜNİVERSİTESİ
FEN BİLİMLERİ ENSTİTÜSÜ
CONTROLLING THE DISTRIBUTED ENERGY
RESOURCES USING SMART GRID
COMMUNICATION TECHNOLOGIES
Derya Betül ÜNSAL ÇELİMLİ
Ph.D. Thesis
Electrical-Electronics Engineering Department
May, 2018 Konya, Turkey All Rights Reserved
CONTROLUNG THE DlSTRIBUTED ENERGY RESOURCES USING SMART GRID COMMUNICATlON TECHNOLOGIES
Submitted by Derya Betül üNSAL ÇELİMLİ in partial fulfillment of the requirements for the degree of Doctor of Philosophy in Electrical and Electronics Engineering Department, Selçuk University by:
Examining Commiııee Members: Signature
Supervisor
Assoc. Prof. Dr. Ahmet Afşin KULAKSız Member
Prof. Dr. Ramazan AKKA YA
s
Member
Assoc. Prof. Dr. Muciz ÖZCAN Member
Assist. Prof. Dr. Nurettin ÇETİNKA YA Member
Assist. Prof. Dr. Mümtaz MUTLUER
i approve the results above.
Prof. Dr. Mustafa Yılmaz Head of Institute of Science Date of Approval: 30.05.2018
" This thesis study was supported by TUBlT AK with the 2211 Priority Areas Scholarship Program.
Bu tezdeki bUtUnbilgilerin etik davranış ve akademik kurallar çerçevesinde elde edildiğini ve tez yazım kurallarına uygun olarak hazırlanan bu çalışmada bana ait olmayan her tUrlUifade ve bilginin kaynağına eksiksiz atıf yapıldığını bildiririm.
DECLARATION PAGE
ihereby declare that all information in this document has been obtained and presented in aeeordanee with aeademie rules and ethical eondue!. ialso declare that, as required by these rules and eonduet, ihave fully cited and refereneed all materials and results that are not original to this work.
Signature
Derya BeW! ÜNSAL ÇELİMLİ
v
CONTROLLING THE DISTRIBUTED ENERGY RESOURCES USING SMART GRID COMMUNICATION TECHNOLOGIES
Derya Betül ÜNSAL ÇELİMLİ
THE GRADUATE INSTITUTE OF SCIENCE SELÇUK UNIVERSITY THE DEGREE OF DOCTOR OF PHILOSOPHY IN
ELECTRICAL - ELECTRONICS ENGINEERING Thesis Advisor: Assoc. Prof. Dr. Ahmet Afşin KULAKSIZ
Thesis Co- Advisor: Assist. Prof. Dr. Ahmet ÖNEN 2018, 192 Pages
Examining Committee Members Prof. Dr. Ramazan AKKAYA Assoc. Prof. Dr. Ahmet Afşin KULAKSIZ
Assoc. Prof. Dr. Muciz ÖZCAN Assist. Prof. Dr. Nurettin ÇETİNKAYA
Assist. Prof. Dr. Mümtaz MUTLUER
In recent years, consumer demand, energy consumption rates, and control requirements have increased. This necessitates the control of electrical systems remotely with communication system by advanced technologies which have distributed energy resources. Therefore, transforming the existing electrical grid into the smart grid requires remote control for the development of more efficient, more convenient and more reliable systems and its structures are being researched. In this thesis, communication structures used in control requirements and integration of renewable electrical sources are examined. Then, micro grid system model is designed which is used with power line communication infrastructure, distributed energy resources, and electric vehicles system and the overall system is simulated by Matlab Simulink. Photovoltaics technology is integrated as distributed resources and the simulation results are examined for the quality of transmitted energy in different situations of the micro grid. Besides, the applicability of the distributed resources considering power quality is observed when placed near to non-linear load buses. At the same time, the increased power of distributed resources has improved both the system's voltage and its power quality indices.
vi
AKILLI ŞEBEKE HABERLEŞME TEKNOLOJİLERİ KULLANILARAK DAĞITILMIŞ ENERJİ KAYNAKLARI KONTROLÜ
Derya Betül ÜNSAL ÇELİMLİ
SELÇUK ÜNİVERSİTESİ FEN BİLİMLERİ ENSTİTÜSÜ ELEKTRİK - ELEKTRONİK MÜHENDİSLİĞİ ANABİLİM DALI
Tez Danışmanı: Doç. Dr. Ahmet Afşin KULAKSIZ Tez 2. Danışmanı: Dr. Ahmet ÖNEN
2018, 192 Sayfa Jüri
Prof.Dr. Ramazan AKKAYA Doç. Dr. Ahmet Afşin KULAKSIZ
Doç. Dr. Muciz ÖZCAN Dr. Öğr. Üyesi Nurettin ÇETİNKAYA
Dr. Öğr. Üyesi Mümtaz MUTLUER
Son yıllarda artan tüketici talepleri, enerji tüketimi oranları ve kontrol gereksinimleri dolayısıyla enerji kaynaklarının ileri teknolojilerle elektrik sistemlerine dağıtılması ve etkili bir haberleşme teknolojisi ile uzaktan kontrol edilmesi gereksinimleri ortaya çıkmıştır. Bu nedenle, mevcut elektrik şebekesinin akıllı şebekeye dönüştürülmesinde, daha verimli, daha kullanışlı ve daha güvenilir sistemlerin geliştirilmesi için uzaktan kontrol sağlayabilen yapılar araştırılmaktadır. Bu bağlamda, bu tez çalışmasında, kontrol gereksinimlerini karşılayabilen haberleşme teknolojileri ve yenilenebilir elektrik kaynaklarının bu sistemlere entegrasyonu incelenmiştir. Güç hatları iletişimi altyapısı ile dağıtılmış enerji kaynakları ve elektrikli araç sistemleri entegreli mikro şebeke sistemi modellenmiş ve tasarlanan yeni sistem Matlab Simulink ile simüle edilmiştir. Farklı tasarım yapısına sahip mikro şebekeler için, iletilen enerjinin kalitesi, simülasyon sonuçları alınarak incelenmiştir. Ayrıca, dağıtılmış enerji kaynaklarının uygulanabilirliği, doğrusal olmayan yük baralarına olan mesafelerine göre, güç kalitesine olan etkileri dikkate alınarak gözlemlenmiştir. Aynı zamanda, dağıtılmış enerji kaynaklarının gücünün artırılması, sistemin gerilim ve güç kalitesi indekslerini iyileştirmiştir.
vii This work is dedicated to my family…
viii
First of all, I would like to express my gratitude to God for granting me with wisdom and the opportunity of an education. My sincere appreciation and gratitude goes to my advisor Assoc. Prof. Dr. Ahmet Afşin KULAKSIZ for his advice, assistance, encouragement and valuable guidance in the preparation of this work. I wish to extend my thanks to my co-advisor Assist. Prof. Dr. Ahmet ÖNEN for his valuable comments and advices during this thesis.
I would like to thank my husband Mehmet Akif, for his support and encouragement through this work. And I wish to express my special thanks to my little daughter Rüya Betül for being calm and happy baby since she was born that allows to finish my thesis with her.
I also thanks to my mother Hülya KOÇ ÜNSAL for being a great source of inspiration for me and always increase my motivation, and my father Yusuf İzzet ÜNSAL to grown me up with hardworking behavior like him, and I wish to express my special thanks to my brother Ömer Faruk ÜNSAL to feel always his presence and support with me. Thanks to my aunt Filiz GÖK for loving her profession very much with life energy that encouragement me to be an engineer and thanks to my dear colleague and Cousin Ahmet Hamdi KOÇ, for the effort that he gave me in my thesis. Also thanks to his sister Elif Esra to feel her kindness in all my life.
I would like to thank my dears Yeşim Büşra, Şebnem Sena, Umut Zeki and Ahmet Selim for their love, enjoy and cheer up me when I write my thesis and every time I need.
Also thanks to Tübitak 2211 Graduate scholarship program and my friends who have been support throughout my life and academic career.
ix ABSTRACT ...v ÖZET ... vi DEDICATION ... vii ACKNOWLEDGEMENTS ... viii TABLE OF CONTENTS ... ix
LIST OF FIGURES... xii
LIST OF TABLES ...xvi
ABBREVIATIONS ... xviii
LIST OF SYMBOLS ...xxi
1. INTRODUCTION ...1
2. LITERATURE REVIEW ...6
3. REVIEW OF SMART GRID TECHNOLOGIES ... 10
3.1. Traditional Electrical Grid System ... 10
3.2. Smart Grid System ... 11
3.2.1 Efficiency ... 13
3.2.2 Security and Reliability... 14
3.2.3 Flexibility ... 14
3.2.4 Review of Smart Grid Standards ... 15
3.2.5 Measurement Technologies ... 23
3.2.5.1 Automatic Meter Reading (AMR) ... 23
3.2.5.2 Advanced Metering Infrastructure (AMI) ... 24
3.2.5.3 Programmable Logic Controller ... 25
3.2.5.4 Measurement Center ... 25
x
3.2.6.2 Wired Communication ... 32
3.2.7 Control Technologies ... 34
3.2.7.1 DMS (Distribution Management System) ... 35
3.2.7.2 Information Technologies ... 36
4. DISTRIBUTED ENERGY RESOURCES AND GRID INTEGRATION ... 38
4.1 Introduction ... 38
4.2 Non-renewable Energy Resources ... 41
4.2.1 Fossil Energy ... 42
4.2.2 Nuclear Energy ... 43
4.3 Renewable Energy Resources ... 45
4.3.1 Wind ... 48
4.3.2 Hydro ... 52
4.3.3 Geothermal ... 56
4.3.4 Biomass ... 59
4.3.5 Solar ... 63
4.4 Grid Integration of Renewables ... 73
5. ELECTRIC VEHICLE GRID INTEGRATION ... 86
5.1 Battery Charging Methods ... 88
5.2 The Effects of Vehicles on Distribution Systems ... 91
5.2.1 Phase Imbalance ... 91
5.2.2 Power Quality Issues ... 91
5.2.3 Effects on Transformers ... 92
6. MICRO GRID SYSTEM MODELLING AND CALCULATIONS ... 96
xi
6.3 Modelling of Houses ... 106
6.4 Modelling of 13 Buses Distribution System ... 109
6.4.1 Power Flow Results ... 115
6.5 Simulation Studies ... 116
6.6 Modelling of Micro Grid Design and Power Quality Equations ... 124
6.7 Results and Discussion ... 148
7. CONCLUSION ... 158
APPENDIX-A ... 181
APPENDIX-B ... 187
APPENDIX-C ... 189
xii
Figure 3.1 Overview of the traditional electrical grid system. ... 11
Figure 3.2 IEEE Standards ... 15
Figure 3.3 Overview of Smart grid system ... 22
Figure 3.4 Smart grid communication and power flow architecture ... 26
Figure 3.5 Smart grid communication network architecture ... 33
Figure 4.1 The world energy consumption by energy source in 2016 ... 41
Figure 4.2 The world wind energy capacity by countries in 2017 ... 50
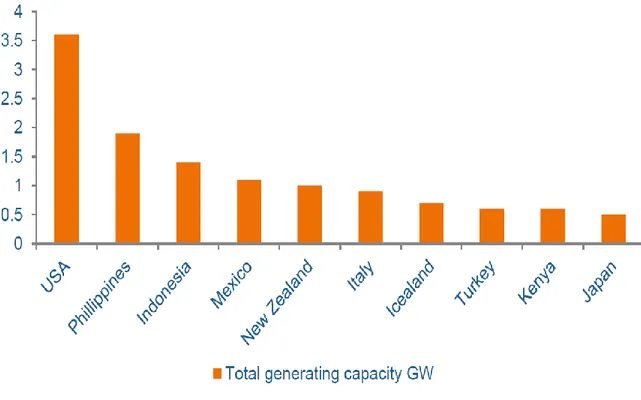
Figure 4.3 Top countries per geothermal energy capacity at the end of 2015 ... 57
Figure 4.4 General structure of solar cell ... 65
Figure 4.5 General structure of a solar panel ... 66
Figure 4.6 Solar energy capacity by region ... 68
Figure 4.7 On grid without battery system overview ... 69
Figure 4.8 On grid with battery system overview ... 70
Figure 4.9 Off grid system overview... 71
Figure 4.10 Cumulative growth of PV applications ... 72
Figure 4.11 The change of the structure of the distribution network with DER ... 74
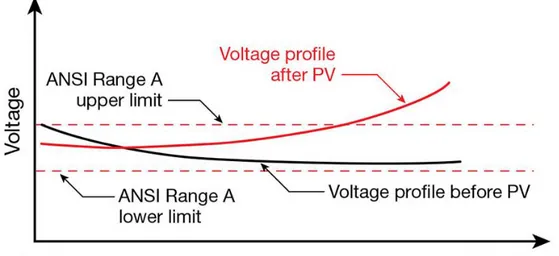
Figure 4.12 Theoratical view of voltage rise ... 75
Figure 4.13 The overview of the distribution system with PV as DER ... 76
Figure 4.14 Overrrunning the limits of voltage profiles due to DER ... 76
Figure 4.15 Overrrunning the limits of bus voltages ... 78
Figure 4.16 Incorrect tripping example on the feeder with DER ... 79
Figure 4.17 Example of islanded system includes DER ... 81
xiii
Figure 6.3 Solar photovoltaic model designed with Matlab. ... 101
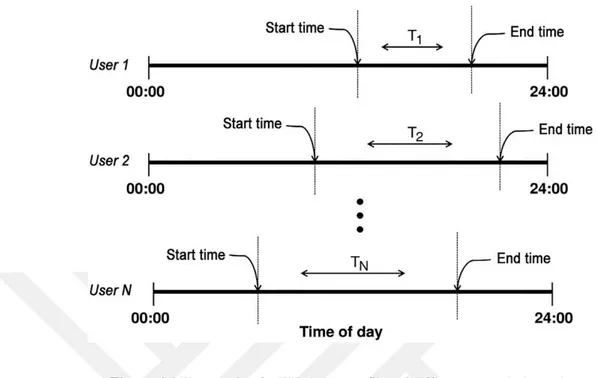
Figure 6.4 Time setting for EV charge profiles of different users during a day ... 104
Figure 6.5 Simulink model for used measurement data is collected from EVs. ... 105
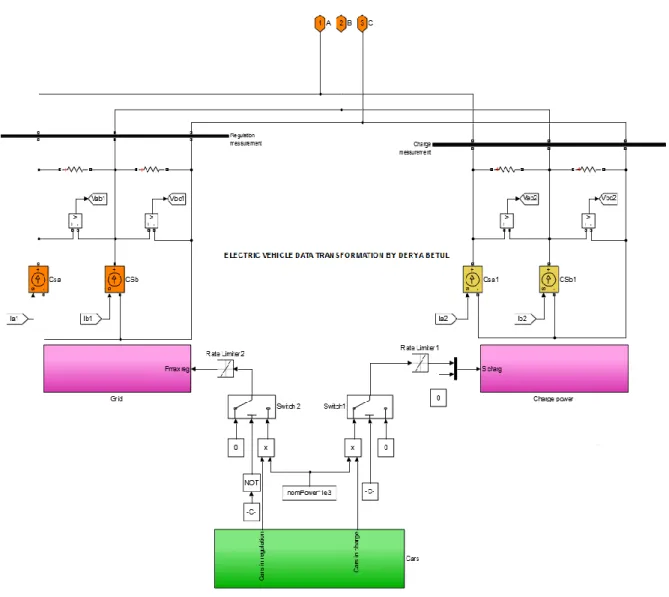
Figure 6.6 Electric vehicle to grid connection designed with Matlab. ... 106
Figure 6.7 Mathematical modelling of house power distribution. ... 107
Figure 6.8 Calculating a phase current for each house. ... 107
Figure 6.9 Controlling the output scheme for a house. ... 108
Figure 6.10 Matlab Model of 10 Houses which is the subject of this thesis ... 108
Figure 6.11 Power line communication general block diagram. ... 109
Figure 6.12 IEEE 13 Node test feeder diagram ... 110
Figure 6.13 Matlab Simulink 13 bus scheme. ... 115
Figure 6.14 100kW PV connected with IEEE 13 bus distribution system. ... 116
Figure 6.15 I-V characteristics curves of 100kW PV ... 117
Figure 6.16 Simulation results for the 100kW PVs. ... 117
Figure 6.17 250kW PV connected with IEEE 13 bus distribution system. ... 118
Figure 6.18 I-V characteristics curves of 250kW PV ... 119
Figure 6.19 Simulation results for the 250kW PVs ... 119
Figure 6.20 400kW PV connected with IEEE 13 bus distribution system. ... 120
Figure 6.21 I-V characteristics curves of 400kW PV ... 121
Figure 6.22 Simulation results of the number of four PVs. ... 121
Figure 6.23 Block parameters of number of four PVs ... 122
Figure 6.24 Simulation results of power values of four PVs ... 123
Figure 6.25 Micro grid system general infrastructure ... 125
xiv
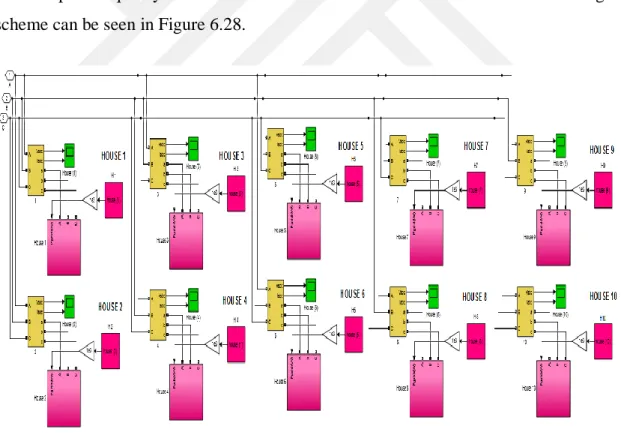
Figure 6.28 A part of MG system with a number of 10 real-time houses ... 128
Figure 6.29 Modified IEEE 13 bus distribution system. ... 129
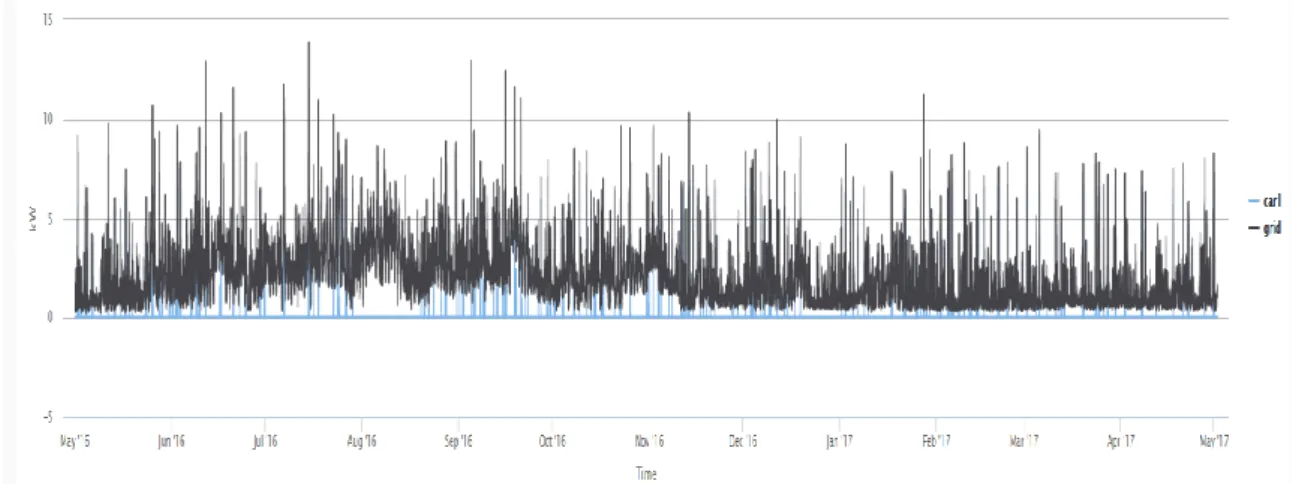
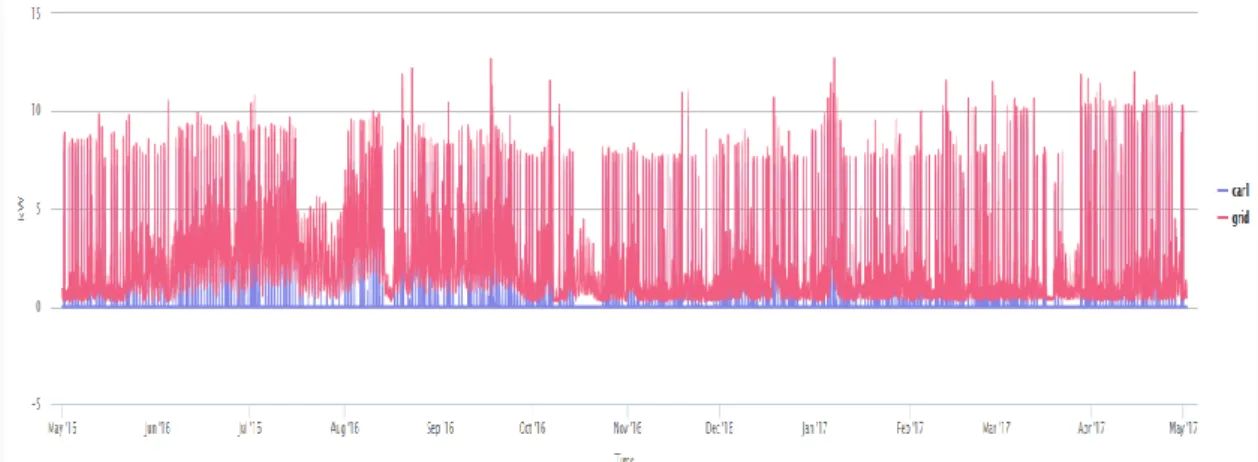
Figure 6.30 May 2016- 2017 car and grid total consumption graphs for House 1 ... 133
Figure 6.31 May 2016- 2017 car and grid total consumption graphs for House 2 ... 133
Figure 6.32 May 2016- 2017 car and grid total consumption graphs for House 3 ... 133
Figure 6.33 May 2016- 2017 car and grid total consumption graphs for House 4 ... 134
Figure 6.34 May 2016- 2017 car and grid total consumption graphs for House 5 ... 134
Figure 6.35 May 2016- 2017 car and grid total consumption graphs for House 6 ... 134
Figure 6.36 May 2016- 2017 car and grid total consumption graphs for House 7 ... 135
Figure 6.37 May 2016- 2017 car and grid total consumption graphs for House 8 ... 135
Figure 6.38 May 2016- 2017 car and grid total consumption graphs for House 9 ... 135
Figure 6.39 May 2016- 2017 car and grid total consumption graphs for House 10 ... 136
Figure 6.40 May 2016- 2017 car and grid total consumption graphs for House 11 ... 136
Figure 6.41 Total consumption graphs for 10 houses for May 2016 ... 137
Figure 6.42 Total consumption graphs for 10 houses for June 2016 ... 137
Figure 6.43 Total consumption graphs for 10 houses for July 2016 ... 138
Figure 6.44 Total consumption graphs for 10 houses for August 2016 ... 138
Figure 6.45 Total consumption graphs for 10 houses for September 2016 ... 138
Figure 6.46 Total consumption graphs for 10 houses for October 2016 ... 139
Figure 6.47 Total consumption graphs for 10 houses for November 2016 ... 139
Figure 6.48 Total consumption graphs for 10 houses for December 2016. ... 139
Figure 6.49 Total consumption graphs for 10 houses for January 2017 ... 140
Figure 6.50 Total consumption graphs for 10 houses for February 2017 ... 140
xv
Figure 6.53 Total consumption graphs for 10 houses for May 2017 ... 141
Figure 6.54 Power consumption measured data for 10 houses during a year ... 142
Figure 6.55 Power consumption measured data for September 2016 ... 142
Figure 6.56 Generated power from PV on House 1 between May 2016 and 2017 ... 143
Figure 6.57 Generated power from PV on House 2 between May 2016 and 2017 ... 143
Figure 6.58 Generated power from PV on House 3 between May 2016 and 2017 ... 144
Figure 6.59 Generated power from PV on House 4 between May 2016 and 2017 ... 144
Figure 6.60 Generated power from PV on House 5 between May 2016 and 2017 ... 144
Figure 6.61 Generated power from PV on House 6 between May 2016 and 2017 ... 145
Figure 6.62 Generated power from PV on House 7 between May 2016 and 2017 ... 145
Figure 6.63 Generated power from PV on House 8 between May 2016 and 2017 ... 145
Figure 6.64 Generated power from PV on House 9 between May 2016 and 2017 ... 146
Figure 6.65 Generated power from PV on House 10 between May 2016 and 2017 .... 146
Figure 6.66 Illustration view of Case 2 ... 149
Figure 6.67 Voltage (THD) (%) of the 13 bus system for different situations ... 152
Figure 6.68 Crest Factor results of 13 bus system for different situations ... 152
Figure 6.69 Voltage harmonic distortions for three cases ... 154
xvi
Table 3.1 Smart grid wireless applications ... 32
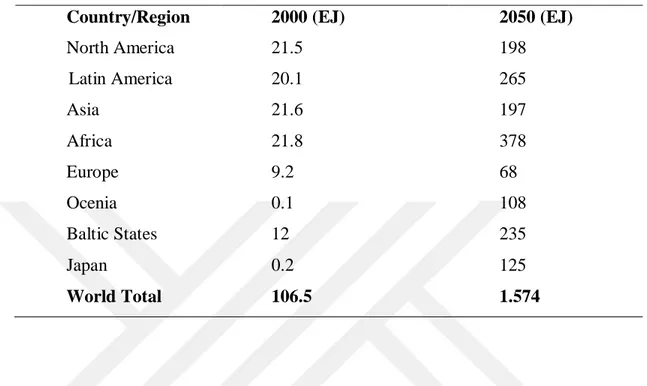
Table 4.1 A summary of the energy resources in the world ... 39
Table 4.2 The world’s hydropower potential in 2016 ... 54
Table 4.3 The world’s national protected bioenergy production potential ... 61
Table 4.4 Comparison of typical interconnection equipment used in DER app ... 84
Table 4.5 Harmonic limits of IEEE 519 Standards ... 85
Table 5.1 Comparison of charge types ... 88
Table 5.2 Location attributes for EV charging ... 90
Table 6.1 Signal definitions of designed model. ... 102
Table 6.2 IEEE 13 Bus Test Feeder Values (Impedances). ... 111
Table 6.3 Overhead Line Configuration Data... 112
Table 6.4 Line Segment Data.. ... 112
Table 6.5 Transformer Data. ... 113
Table 6.6 Regulator Data. ... 113
Table 6.7 Distributed Load Data... ... 113
Table 6.8 Underground Line Configuration Data... ... 114
Table 6.9 Capacitor Data ... 114
Table 6.10 Spot Load Data ... 114
Table 6.11 Voltage distortion limits for harmonics ... 132
Table 6.12 Load and Transmission Data ... 142
Table 6.13 Transformer Data ... 142
Table 6.14 THD values for different situations and CF results. ... 151
xvii
xviii
AEC : Atomic Energy Commission
AEVs : All-electric Vehicles
AMI : Advanced Metering Infrastructure
AMR : Automatic Meter Reading
BANs : Building Area Networks
BEV : Battery Electric Vehicles
BEVs : Battery Electric Vehicles
CENELEC : Comité Européen de Normalization Electrotechnique
CF : Crest Factor
DER : Distributed Energy Resources
DMS : Distribution Management System
DR : Demand Response
EEC : European Economic Community
EG : Electrical Grid
ERCOT : Electrical Reliability Council of
Texas
EURATOM : European Atomic Energy Community
EV : Electric Vehicle
FCEVs : Fuel Cell Electric Vehicles
GOOSE : Generic Object-Oriented Substation Event
HANs : Home Area Networks
HD : Harmonic Distortion
xix
IANs : Industrial Area Networks
IEC : International Electrotechnical Commission
LAN : Local Area Networks
MAC : Media Access Control
MAN : Metropolitan Area Network
MG : Micro Grid
NANs : Neighborhood Area Networks
NREL : National Renewable Energy Laboratory
PAPs : Personal Access Points
PHEVs : Plug-In Hybrid Electric Vehicles
PLC : Power Line Communication
PV : Photovoltaics
SA : Simulated Annealing
SCSM : Specific Communication Service Mapping
SG : Smart Grid
THD : Total Harmonic Distortion
UPS : Uninterruptible Power Source
WANs : Wide Area Networks
Wi-Fi : Wireless-Fidelity
WiMAX : Worldwide Interoperability for Microwave Access
xx
Wi-Fi : Wireless-Fidelity
WiMAX : Worldwide Interoperability for Microwave Access
LIST OF SYMBOLS
HD_I : Harmonic distortions of Current
HD_V : Harmonic distortions of Voltage
I_diode : Diode current (A)
I_PV : PV current (A)
I0 : Diode saturation current (A)
Id : Diode current (A)
Ir : Irradiance (W/m2)
k : Boltzman constant = 1.3806e-23 J.K-1
K : Number of Load Bus
Ncell : Number of cells connected in series in a module
nI : Diode ideality factor, a number close to 1.0
q : Electron charge = 1.6022e-19 C
T : Cell temperature (K)
Temp. (C) : Temperature (degrees C)
THDn : THD Index at n.th Bus
V_PV : PV voltage (V)
VADDER : Voltage amplitude of the bus after DERs are integrated. VADNO_DER : Voltage amplitude of the bus before the DER.
Vd : Diode voltage (V)
VRms : Effective value of voltage
1. INTRODUCTION
In recent years, transmission and distribution of electricity with the traditional power grid is becoming insufficient in responding to consumer needs. This is why the need for electricity has emerged a new grid structure enabling a more efficient transmission.
In countries where PV plant installations have not yet reached high levels, such as our country, it is important to make detailed analyzes in advance to determine the capacity of power plant installations and whether roof installations should be more preferred. In addition to taking into consideration such factors as the cost of the installation of the production plants in the distributed structure, the effects of the power quality in the network are also important, especially before the problems occur on the grid. The study is of great importance in this respect.
The Smart Grid (SG) is an idea of achieving a more effective system with improved demand-side management on effective communication technology and efficiency. This idea targets transmitting electricity with high efficiency and has a very large field of interest such as communications, control systems, and semiconductor technology.
The major aim of the advanced SG concept can be categorized in three subjects: increasing the utilization of Distributed Energy Resources (DER) and Demand Response (DR), better asset utilization, and enhanced customer choice (F. Rahimi, 2010).
For this purpose, it is observed in the literature that all these parameters of the system considers dynamically shaping the quality of energy, compatible with control and communication technologies, and at the same time allow to use DERs.
In parallel with population growth and technological developments, the need for energy and dependence is increasing day by day. Increased energy demand and consumption has brought sustainable, more resilient, more efficient and environmentally
friendly resources to use instead of limited resources. Sustainable development strategies aimed at protecting ecological balances have made it necessary for energy production, transmission and consumption processes to be more efficient, reliable and environmentally friendly.
In the last century, fossil fuel-based energy production has led to high carbon emissions, raising global risks such as greenhouse effect and global warming, as well as lowering air quality. However, it is anticipated that fossil resources will be exhausted in the near future and the need for alternative energy sources is increasing. In this context, the dissemination of renewable energy sources has been taken into consideration. Energy production based on renewable energy sources is considered a promising solution to the global energy problem, both because of its low environmental impact and because it is easily accessible.
Energy production based on DER is supported by SG applications. In this context, priority is given to smart grid operations in order to find solutions that will provide distributed integration and effective management of DERs (solar, wind, biomass, etc.) in micro and macro scale grid which can show production discontinuity and uncertainty. At this point, there is a need for grid architecture in which the consumer subscriber model is widespread and the local production and consumption strategy is dominated by the grid. These architectures have brought about problems of power systems such as distributed generation, distribution storage, as well as system management problems such as distributed control, distributed metering, optimal network management and energy balancing. The solution of these problems requires integration with the grid's communication and control systems to achieve a structure containing multi-layered technologies.
In this multi-layer structure, to reach the effective transmission and distribution systems, correct communication technology must be applied to all the parameters on power system. If the competition evolves between communications infrastructure owners and
requesting access to these structures with employees to serve in the same class of operators, a continuously increasing argument can be specified. As a result of this competition, it will be provided that consumers can access to energy in better quality and lower cost. Presently, the major point is communication system architecture design as an investigation for systems which can be used in interconnected SG applications in the future (Depuru, 2011). SG needs more sophisticated power flow ability as dual way communication at the same time. Therefore it needs too much real time communication networks for data collection and processing (Wang, 2011).
While consumption and demand-oriented working groups focused on the optimum balancing of energy production or consumption demand response, the pricing working groups focus to concentrate on sustainability and safety on the cost-oriented pricing of the energy. The workgroups emphasizing on environmental sensitivity and reducing the carbon footprint of the SG are intended to increase production based on renewable energy sources. Examining methods of communication or control systems and information technology, the existence of many to enumerate a lot more workspace uses of SG in energy transmission proves wide work area.
Enabling technologies, such as enhancements in the communication and information technologies, make it possible to turn these new resources into useful controllable products for wholesale market and transmission system operators (F. Rahimi, 2010).
Renewable energy sources usage in the SG with the effective communication and control system is the subject of this study, and it aims to combine different working disciplines as communication-oriented both in terms of control and sensitivity to the environment.
Advances in SG began to take shape with the ideas emerging from the ongoing projects in Europe and America. One of these projects is the Pecan Street Project which
provides real-time data we used in our work. We gratefuly acknowledge of the Pecan Street Project, which is capable of providing real-time consumption data of the actual houses.
At the end of this development process that began with SG work, is expected to produce energy consumers to be shared over the grid status whenever they want. This allows to beginning the consumers able to check their bills, the occurrence of the advances that will change the classical view of energy consumption, such as network elements providing remote control is too close.
Nowadays, expectations of SG are not limited to energy sharing problem. Smart projections of near future envisage the sharing of data over the communication technology layer, not just the energy. This expectation promises a more complex and integrated, more interactive future where energy and knowledge are shared over the same infrastructure. Today's methods of sharing data will inspire the future energy sharing strategies. Traditionally, the strategy of static and one-way energy transmission from central producers to consumers will evolve into an architecture where smart grid applications and energy packages can be generated, stored and shared at any point in the grid. Transmission of energy packets in future SG such as transmission of data packets in digital data communication, will be possible. It seems likely that all of the smart houses, smart cars and smart devices will become a molecular component of the SG.
According to this development of energy, a micro grid design which uses distributed energy resources and can provide transmission and distribution by wired communication method as Power Line Communication (PLC), consisting of Photovoltaics (PV) and Electric Vehicles (EV) on grid architecture has been studied and its advantages have been discussed in this thesis.
Uninterrupted structure such as communication, transportation etc. is all dependent on electricity, that’s why reliable electricity supply is imperative. When a break failure occurs on supply, it can be catastrophic as witnessed in the California energy crisis and the
ensuing black-outs that started in May 2000. Stabilizing the supply and prices took a year, costing the State of California almost $33 billion more than the previous year (P. Fox, 2010).
In this thesis, SG communications architecture methods which will be used in future have been investigated and the solutions to the problems for efficient energy transportation are discussed. The purpose of transmitting efficient energy is trying to improve the quality of energy by reducing losses and distortions. In order to solve the uncertainty of trying to control all of the smart energy network in this context, it is targeted to be divided into Micro Grid (MG). The accuracy of the designed MG system that has been worked with real-time data is also tested for compliance with IEEE distribution and communication standards. PV integration as DER on SG structure with communication technologies and EV applications are researched in this study. Micro grid which is designed for controlling DER and EV applications, are evaluated to understand power quality behavior of it. The major features of MG, including solving the energy quality problems, increasing the voltage quality, decreasing total harmonic distortion (THD) and even providing reactive power compensation by EV are investigated in Matlab Simulink software.
2. LITERATURE REVIEW
In the literature studies, an SG model which can adapt to energy management algorithms while working with DER, which uses an effective and efficient communication system in line with the needs of the network and reduces the harmonic effects of the loads on the grid has been determined. The MG model is proposed in this thesis study, when applied with the appropriate communication protocols in the system. It will also solve energy quality problems such as harmonics, active and reactive power control at the grid connection point, against potential problems that may arise during the connection of EV's and renewable energy sources to the SG. In this way, EV will also enable the more efficient use of electronic circuit equipment by eliminating the overloading due to energy quality problems on the grid into which it is connected. The extra burden of EV charging will be minimized to avoid costly new investments and at the same time electric grid operators will provide renewable energy sources with higher quality and safer electricity to their users.
Vehicle technologies are developing due to ever-increasing environmental concerns and the rapid depletion of fossil fuels. In studies aimed at reducing vehicle emissions, it is usually focused on EV's. Among the EVs, the Battery Electric Vehicles (BEVs) known as "zero emissions" are now on the forefront (Skerlos, 2010; Thomas, 2009). It is understood from this the vehicles will meet their energy needs either immediately from the network or from an alternative energy source. A common situation is that the vehicles can not meet the energy needs of the network (Bradley, 2009; Silva, 2009).
If the majority of power plants that supply electricity to the grid are made up of fossil fuels, one of the problems that might come to mind is whether the EVs are really environmentally friendly. However, studies have shown that emissions of vehicles will decrease to meet their energy needs from the electricity grid instead of fossil fuels (Galus, 2010; Göransson, 2010; Lund, 2008; Smith, 2010) Furthermore, the widespread use of alternate and renewable energy systems among power plants providing electricity to the grid will further reduce emissions. One of the situations where tools need to be examined in connection with the grid is the question of whether the grid can compensate for the
disruptive effects of EV charging. To do this, it is necessary to predict how much charge energy will be needed for that region in the future. Vehicle numbers and powers must also be predicted so that the power demand of the vehicles can be determined. This issue has been examined in detail in various studies for various regions. Many relevant projects are supported in Europe and the outputs of the studies are being newly introduced in the literature (Galus, 2010; Göransson, 2010; Silva, 2009; Smith, 2010).
Research conducted under the auspices of the US Department of Energy is conducted at several national laboratories (Oak Ridge National Laboratory, National Renewable Energy Laboratory, Pecan Street Laboratory, and Pacific Northwest National Laboratory) ( Dataport, 2017; Oak, 2008; NREL, 2007; PRNL, 2007; Sioshansi, 2010) In this thesis, Texas, Austin region in USA was studied, real electric vehicles used and real photovoltaics were modeled in Matlab Simulink by using real-time data in the Pecan Street project database, transmission and distribution of energy together with IEEE communication standards were carried out (Dataport, 2017; IEEE,1993; 2016; 2017).
The study is aimed that the smart energy grid architecture with multilayered technology basically offers the following possibilities:
a) Energy quality and efficiency:
Energy quality and efficiency should be considered as production, consumption and transmission efficiency and should cover all energy processes. The local consumption strategy of local production reduces transmission losses and increases productivity (Alagoz, 2012). With demand-side load management, distributed generation and storage practices, energy demand can be shifted over hours as renewable energy sources become more efficient (Molderink, 2009; Gottwalt, 2011). This will reduce the dependency of the energy supplied by the network (Kaygusuz, 2013). This will not only reduce transmission losses, but also make it possible to make the demand more economical and environmentally friendly with cheaper and fuel-free renewable energy. In an environment of production and consumption uncertainty, a reliable grid must be able to remain stable and respond to energy demand at all times (Hashmi, 2011; Alagoz, 2012; Martini, 2012). As a natural
consequence of grid-wide distributed generation and storage practices, breakdowns and interruptions are more localized and the grid is less affected by these problems (Reddy, 2014; Khrennikov, 2012). Breakdown and faults have the potential to cause serious economic and social problems in the short term. With demand-side load management providing distributed production, distributed storage and demand flexibility, the negative impacts of these problems on the economy and society will be alleviated. Distributed production and distributed storage applications can improve the self-healing capacity and energy security of the grid. Demand-side load management can help to reduce demand in the event of an energy supply failure, which will enable energy to be directed to loads with more critical presence and make it easier to mislead extraordinary situation strategies. Decentralized production and storage strategies will reduce the risk of limiting energy access in adverse situations such as natural disasters and attacks, according to central production (Reddy, 2014).
b) Demand and production flexibility:
Demand and production flexibility are the most important factors that can be managed by the network. Tunable and production-tunable is the most basic feature that allows optimal energy balancing applications to be passed on. In flexible grids with this feature, production and demand control can be made to avoid negative conditions such as overproduction, energy shortage, high peak demand. Thus, more efficient use of resources can be achieved. In SG, demand-side load management applications are implemented with the help of methods such as dynamic energy pricing, load shifting and load-down (Spees and Lave, 2008). As a result of these applications, the demand flexibility enables the energy demand to be adjusted according to the conditions and needs. As a result, demand and production flexibility enables effective and efficient energy management. At the same time, this feature facilitates the integration and diffusion of renewable energy sources with production uncertainty into the grid (Pina, 2011).
Communication and control (automation) technologies provide smart grid conditions to be accessible and controllable throughout the grid (Hashmi, 2011). This is possible thanks to distributed sensor and control applications. Wide area management with LAN management, optimal network conditions can be sustained (Friederich and Peter, 2007). For example, the status of the local power system can be accessed and remotely managed at the household level with smart meters. Network and subscriber operations on the distribution system (such as opening, closing, troubleshooting, servicing the backup system) can be performed remotely. Fault conditions can be observed from network control and management centers, backup systems can be activated and removed automatically. Before the faults and after the faults occur, measurement and analysis of the grid conditions can be used to estimate the failure and to develop early warning and attention systems. Thus, necessary precautions can be taken to prevent malfunctions and errors before they occur. Not only grid management and monitoring automation, but also subscription operations can be managed remotely or automatically. Also instant status, consumption or local malfunctions of subscriptions can be monitored remotely. In addition to subscription processes, closing, and tariffing, the status of the subscriber's local distribution systems and devices can be analyzed remotely. Non-standard situations and malfunctions observed in local distribution can be reported and provided to the subscriber's to take necessary precautions.
e) Smart grid management with artificial intelligence algorithms:
Artificial intelligence algorithms are seen as one of the important components of smart grid studies (Hashmi, 2011). In SGs where all processes from production to consumption are observable and manageable, artificial intelligence and optimization algorithms can provide autonomously access grid conditions at each point of the grid and keep them at optimal values; thus significantly improving energy quality, efficiency and reliability (Ramchurn, 2011). These algorithms can ensure that the system remains in optimal grid conditions (reliability); by analyzing the grid and taking necessary precautions automatically before failure conditions ocur (predictability). For this purpose, SG control has been provided by simulated annealing algorithm in this thesis.
3. REVIEW OF SMART GRID TECHNOLOGIES
Conventional electrical grid (EG) system as generation, transmission, and distribution has many problems supplied by consumer demand and high speed data transmission. “Smart Grid” concept, is nowadays a frequently encountered object and was created to solve these problems. The definition of the smart grid is automatically controlled by a computer system that allows the modernization of the electricity distribution system.
Therefore, the Smart Grid is adapted and restorated to new electrical technologies, rather than to reconstruct all power grid systems. But it should be noticed that smart grid does not mean to create a new grid instead of existing grid. This cannot be done, because only underground electricity cables in just New York City, which could be wrapped around the earth 3.5 times, are 94.000 miles long (Rudin, 2011). So, Smart Grid (SG) which is capable of self-control in power distribution and transmission system is a system that enables the optimization of all assets connected.
3.1. Traditional Electrical Grid System
For many years, power plants are established away from population density regions where coal is produced. The same thing is also true for today’s power plants. But, by transmitting the power generated far from the consumer, loss of energy is inevitable.
When today’s EG system is explained basically in Figure 3.1, electricity is generated in huge power plants and transmitted by interconnected lines with high voltage. But there is no well-attractive controlling. Due to the nonexistence of an effectual transmission, if a power cut occurs on lines, it can affect other grids unfavorably.
Figure 3.1 Overview of the traditional electrical grid system
On the other hand, there is another problem as losses on todays EG. Unfortunately, the rate of losses on today’s distribution and transmission systems is still so high. Also, illegal usage of electricity is uncontrolled and usage of it can be very serious and very dangerous. That causes overload on generation units and partial power cuts and system breakdowns. It is estimated that electrical companies, all around the world, loose 25 billion dollars every year because of illegal use of electricity.
The problems like transmission losses and illegal usage affecting the quality of electricity on existing grid can be resolved by using control and communication methodologies, which are explained in detail in the following section.
3.2. Smart Grid System
Existing grids are inadequate for consumer demand due to the increasing energy needs. Also increasing population and technological developments increase the demand for energy with each passing day. Controlling the increasing load will be easier with new and improved economic developments. So, smart use of our existing resources and grids can increase productivity.
The term of Smart Grid (SG) is defined as follows.
A prospective current and practical definition of the smart grid is expressed by, Z. Fan et al as follows: "Smart Grid integrates the functions and connects it to all the users and uses to make advanced information, control and communication technology, efficient supply of energy, cheap, reliable and transparent (accessible) intelligent electricity network" (Fan, 2013).
“The concept of “smart grid” is modernization of existing electrical power systems from distribution to consumption by high voltage transmission lines, all components are connecting like distributed energy resources (DERs), electric vehicles and other home appliances to make optimization automatically.” (DOE/EPRI, 2013).
“A smart grid should encompass features so as to be: Adaptive, Accessible, Interactive, Predictive, Integrative and Optimized” (Bayliss, 2012).
SG can coordinate all the situations of users (generators, consumers, and users who can apply both of this process etc. to supply reliable electrical energy (ETIPSNET, 2018).
The alertness, responsiveness, additivity, cost effectiveness, environment friendliness being real-time, flexibility, being more powerful of all components from the structure of “smart grid” (Massoud, 2005).
Increased energy demand will create new patterns of consumption, such as electric vehicles (EV). Failure of the network infrastructure causes to remain deprived us of this type of innovation. Petroleum products are also increasingly used in conjunction with energy supply and, therefore, our world is warming and increasingly polluted. SGs that reduce the carbon emissions of petroleum products posed by the spread of renewable and clean energy sources that can contribute to the economy, consumers will be able to use their small-scale energy sources. For example, in a study conducted in the United States, regional carbon emissions having an SG structure was calculated to draw down rate of
25%. In terms of CO2 emissions of 160 million hectares of forest will work for cleaner air. This means that it is equivalent to the withdrawal of the road about 130 million vehicles. Consumers will become more actively involved in the energy production and consumption point, so that the world's response to his efforts may be taken as to be a more livable place; efficiency, reliability, low costs (Faruqui, 2010, Park, 2011).
At least, SG can be examined as “The intelligent, effective and reliable power system has too much transmission and distribution grids that communicate with each other, also able to work with interconnected monitoring and control systems, which can be adapted to the new systems.”
3.2.1 Efficiency
When losses and illegal uses are made inquiries, interventions can be done immediately to possible faults. So, it can be possible to achieve the top level in energy efficiency with the use of the smart grid in transmission and distribution systems. An immediate intervention is very crucial since possible faults on lines cause long term cut-offs. For example, an electricity cut-off occurred in 2003 in the U.S.A. caused cut-off in Canada and 55.000.000 people lacked off electricity for a very long time. If the cut-off is interfered earlier, damages and losses would be less (NERC, 2004).
Results of efficiency analysis that using the smart grid can be obtained as follows;
-Decrease in technical and commercial energy losses;
-More energy distribution with existing infrastructure;
-Balanced system operation;
-Quality and uninterrupted service purchase far from the effects of data which cannot be taken from inaccessible electric meters;
-Remote identification of vandal attempts to electric meters.
3.2.2 Security and Reliability
Security and reliability can be explained as the technologies which allow the modification of system control information between generation, transmission, distribution, and consumers by using real-time communications on the DG structure (A.Shawkat, 2013).
When the SG is developed, in addition to traditional EG system environment, millions of smart assets with communication ability will be integrated into the system. This situation causes new problems on traditional EG security in a large geographical area (A.Srivastava, 2013). Therefore, the SG communication technologies will be an important subject of security (J. Liu, 2012). However, trouble with SG comes inside our homes. If the security is broken with a fault or any other reason, it causes huge damages on DG. Especially saving private confidentiality of our homes is the most important subject, for example resulting to the consumption values, billing data’s, etc. That's why some governments must need to take some precautions (S.Sridhar, 2012). Studies on ensuring security in the implementation of applying SG have a really great space.
3.2.3 Flexibility
The SG can be re-engaged more quickly and effectively against natural disasters and other connection problems. Additional modes of transmission and DG operation are intended to improve the opportunities for management to make more economic decisions (B. Hardy-Newnes, 2012; T.Flick, 2011). The definition of the flexibility can be called as “directing the energy through the use of balanced resources, to provide better quality
electricity to consumers”. In summary, The SG is safer and more flexible than the traditional one.
3.2.4 Review of Smart Grid Standards
Standardization is able to lead to developments in product and systems, guaranteeing that systems work in harmony. Commercial operation of the SG framework is shaped by promulgated by international standards which were established by the United Nations standardization organization under the umbrella of the Department of Commerce NIST (National Institute of Standards and Technology) (NIST, 2009). When creating the NIST standards, the IEEE (Institute of Electrical and Electronics Engineers) and IEC (International Electrical Commission) is assessing the opinions and recommendations.
IEEE determines standards for devices and systems to contribute developments in the electrical sector. These standards procedures and parameters would be needed for an SG and all the units (generators, distribution systems, and consumers) in definitions. Figure 3.2 shows IEEE standards and applications. IEEE communication standards such as IEEE std 1901 and IEEE std 802 are particularly used for SG applications (IEEE, 2010; 2013; 2017b). IEEE 1547, 519 and 802 standards are used in this thesis (IEEE, 1993; 2016; 2017a; 2017b).
SG technologies and their applications have been standardized largely by NIST and IEEE. However, other platforms are also available that work in this field (ANSI, CENELEC and etc.).
In this thesis, some of the standards and features which can be used with SG control and communication applications discussed below are frequently used; (IEEE, 2009; 2010; 2013a).
IEEE 1547
Standard for interconnection and interoperability of distributed energy resources with associated electric power systems interfaces. This standard includes voltage, current and frequency characteristics, possible problems of DER integration, and harmonic limits, also system requirements.
IEEE 519
Standard for Harmonic Control in Electric Power Systems, it is recommended requirements for harmonic control in power engineering and gives limits for individual customers about harmonic injection and unacceptable voltage distortion (IEEE, 1993).
IEC 61850
IEC 61850 provided advantages in different parts of power engineering. The standard is a set of open protocols based on communications generally used in electrical utilities.
Control systems are able to use this standard to communicate between SG components. Real-time data are able to be programmed like outstation devices with advanced functionality such as power quality monitoring, phasor measurement, and other SG analysis. IEC 61850-7 standards are used in this thesis (IEC, 2009). A feature that improves the standard of this standard is '' GOOSE Mapping ''. In a system designed with the IEC 61850 standard, Generic Object-Oriented Substation Event (GOOSE) messages can be used. GOOSE messages can be sent directly to devices whose names and addresses are known and provided to transmit the data such as trip, alarm, position status, locking, etc. (Mackiewicz, 2011).
IEC 61850-1
Communication networks and systems in substations - Part 1: Introduction and overview.
IEC 61850-2
Communication networks and systems in substations - Part 2: Glossary.
IEC 61850-3
Communication networks and systems in substations - Part 3: General requirements.
IEC 61850-4
Communication networks and systems in substations - Part 4: System and project management.
IEC 61850-5
Communication networks and systems in substations - Part 5: Communication requirements for functions and device models.
IEC 61850-6
Communication networks and systems for power utility automation - Part 6: Configuration description language for communication in electrical substations related to IEDs.
IEC 61850-7
Communication networks and systems in substations - Basic communication structure for substation and feeder equipment.
IEC 61850-7-1: Principles and models.
IEC 61850-7-2: Abstract communication service interface (ACSI). IEC 61850-7-3: Common Data Classes.
IEC 61850-7-4: Compatible logical node classes and data classes.
IEC 61850-7-420
For example T. S. Üstün et al. examined MG protection system with communication used with IEC 61850-7-420 in their research (Üstün, 2011; Üstün, 2012).
IEC 61850-8
Communication networks and systems in substations - Specific Communication Service Mapping (SCSM).
IEC 61850-8-1: Mappings to MMS (ISO 9506-1 and ISO 9506-2) and to ISO/IEC 8802-3.
IEC 61850-9
Communication networks and systems in substations - Specific Communication Service Mapping (SCSM).
IEC 61850-9-1: Sampled values over serial unidirectional multidrop point to point link.
IEC 61850-9-2: Sampled values over ISO/IEC 8802-3.
IEC 61850-10
Communication networks and systems in substations - Part 10: Conformance testing.
IEEE P1901
This standard includes other standards which are defined for PLC by IEEE. According to this standard, to reach high data transferring speed, transmission must be done at low frequencies. But signal power attenuation should be taken into consideration at low
frequencies. Data transfer speed can reach 100 Mbps at lower frequencies than 100 MHz (IEEE, 2010).
IEEE Std 802.15.4™-2006
IEEE Standard for information technology-Telecommunication and information exchange between systems
IEEE Std 802.15.4e™-2012
IEEE Standard for local and metropolitan area networks.
IEEE Std 802TM-2001
IEEE Standard for Local and Metropolitan Area Networks: Overview and Architecture.
IEEE Std 802.1adTM
IEEE Standard for Local and Metropolitan Area Networks—Virtual Bridged Local Area Networks (LAN), Amendment 4: Provider Bridges.
IEEE Std 802.1DTM-2004
IEEE Standard for local and metropolitan area networks media access control (MAC) bridges.
IEEE 802.1HTM-1997 Edition (ISO/IEC TR11802-5:1997)
IEEE Technical Report and Guidelines.
IEEE Std 802.1QTM-1998
IEEE Standard for Local and Metropolitan Area Network-Virtual Bridged Local Area Networks.
IEEE 802.11b
802.11b is a standard which is defined for applications in 2.4 GHz ISM (Industrial Scientific Medical) band. RF channels provide high speed data transmission to reach distant points. It enables 11Mbits data transmission. It is used in WLANs, offices requiring mobility, hospitals and the other fields which need medium speed data transmission (IEEE, 2008; 2009).
IEEE 802.11g
Basically, the 802.11g standard is an extension of the 802.11b standard. Data transmission speed rate is two-fold increase and up to 22 Mbit per second with this standard. Thus, a lot of multimedia applications including video applications can be supported. Because of this standard not yet in compliance with 802.11b, it seems to be insufficient at certain points, there are not many applications and supporting products using this standard. After developing this standard, some physical changes will be required on PAPs and receivers (IEEE, 2008; 2009).
IEEE 802.11a
Data transmission rate will increase up to 54 Mbps with this standard. Wireless backbones between access points, corporate users which need high speed data transmission, video distributer systems will use this standard commonly. Because of using high frequencies (5GHz), losses increase in 802.11a, therefore systems and devices using this standard require more power compared to others for reaching the same distance (IEEE, 2008; 2009).
Wi-Fi (802.11b) is more suitable for;
LAN applications which require wider bandwidth (>2MB)
Applications which require wider coverage
Applications which need security
File sharing
ANSI/ CEA-709
ANSI standards known as LonWorks is operated between 115 – 132 Mhz bandwidth and can accommodate up to 32,000 endpoints. Although data rate is only 1.5 Mbps, it is suitable for smart energy management applications (EPRI, 2009).
ANSI/ASHRAE 135-2008/ISO 16484-5 BACnet
A Data Communication Protocol for Building Automation and Control Networks -BACnet defines an information model and messages for building system communications
at a customer’s site. BACnet includes a range of networking technologies to provide scalability from very small systems to multi-building operations that span wide geographic areas using IP protocols.
ANSI C12.19/MC1219 Revenue metering end device tables for smart grid
applications.
ANSI/CEA 709 and CEA 852.1 LON Protocol Suite
It is a general purpose local area networking protocol in use for various applications including electric meters, street lighting, and home automation and building automation.
CENELEC
It is the most sophisticated standard developed by Comité Européen de
Normalization Electrotechnique (CENELEC) mains signaling standard i.e., from 9 kHz to 148.5 kHz which focuses on band width and transmitted power. It provides 5 different channels in the range of 3-148.5 kHz frequency band with a power not exceeding 500MW (CENELEC, 2017).
CENELEC EN 50065-1:2011 (Anonymous, 1992)
Signaling on low-voltage electrical installations in the frequency range between 3 kHz to 148, 5 kHz-General requirements, frequency bands and electromagnetic disturbances.
CISPR 22 (2008 6th ed.)
Limits and Technologies of Measurement of Radio Interference Characteristics of Information Technology Equipment.
ITU-T
It is created by International Telecommunication Union. It is known as ‘ITU-T-G.hn’ project and is responsible for developing a worldwide standard for home network
transceiver capable of operating with different wired communication with bit rates up to 1Gbps. G-hn supports up to 250 nodes operating in the network (EPRI, 2009).
ITU-T G.9903 (2012) Narrowband orthogonal frequency division multiplexing
power line communication transceivers for G3-PLC networks.
ITU-T G.9904 (2012) Narrowband orthogonal frequency division multiplexing
power line communication transceivers for PRIME networks.
The energy consumption and the generation phases in the SG structure can be seen in Figure 3.3. Stage of the energy process from generation to consumption will be examined in three parts including the measurement, control, and communication technologies.
3.2.5 Measurement Technologies
In this part of the SG, instruments to be inserted to the critical point of the grid are ensured, constantly monitoring the factors that affect the state of the system. Measuring components are crucial for the modern electrical grid. Advanced measurement and detection technologies will translate the acquired data from knowledge and perform the electrical power system management. Short term real time metering is provided, eliminating estimated bills and prevent energy theft (NIST, 2013).
The smart grid has the progressive metering infrastructure. Owing to this, the amount of the generated, transmitted and distributed power via the grid is measured instantaneously and transmitted to the center control point. Smart grid infrastructure has two way data transfer between producers and consumers. In this way, the energy data is transferred to the control center with energy consumption values as in the traditional electrical grid system. Also, the energy values produced from renewable sources by the consumer is transferred to the main control center. In this way, consumers can switch to be a manufacturer by selling the position to produce electricity from renewable energy sources. At the same time, consumers can get the energy from their preferred distribution company.
3.2.5.1 Automatic Meter Reading (AMR)
Electric meter device is used for measuring the amount of consumed electrical power in distribution and transmission system and providing billing by one way communication from electric meter to center with automatic meter reading (AMR) system. AMR is aimed at getting real time data from electrical companies and offers more accuracy on basic consumer bill. Before using AMR, payments of consumers were based on usage period of power and suggestions. Electrical power began to be transmitted with a strict control through AMR.
3.2.5.2 Advanced Metering Infrastructure (AMI)
AMI is interactive meter reading system which can supply two-way communication between EG distribution companies and end users. This smart electric meter structure provides to make efficiency analyze between low and high demand periods.
Consumption data obtained by AMR can be processed and transmitted again to reduce operating costs. Also, AMI has additional properties for two-way communication.
Hardware tracking and control structures can be used on the AMI by other suppliers. These can be used for remote authentication of power cuts and illegal usage of electricity (Wang, 2011).
All the existing devices consumers have can be monitored by smart electric meters.
3.2.5.3 Programmable Logic Controller
Data and energy exchange in the SG is made bidirectional. That's why the SG protection must be bidirectional. Measurement with control starts with the production of the conventional system including the entire up to consumers.
Use of smart relays to provide dual way protection and relay-cutting coordination must be provided in an appropriate and efficient manner. In general, smart relays are designed to be used in the industry. A system operates according to the functions that are written in digital logic programming language, so today's smart measurement and protection components provide the counting, arithmetic operations, and storage and overall control of the system functions.
The system to be controlled by smart relays may be different in terms of size. An asynchronous machine with moderate power can be controlled, as well as factories, hospitals and large structures can be controlled locally. If the system to be controlled is larger, programmable logic controller is used with system support. The advantages of the smart relay are very high. First one is their smaller size. The dimensions of the cabinet containing the control panel, therefore, are also reduced. Cable costs are reduced. The setup is simple and the software in it presented to the user is up-to-date. The flexible software can make the system easily provide latest updates with a more efficient operation.
The smart relay is not in command system. Applications are automated. It has analog inputs working in harmony with the freely programmable communication formats.
3.2.5.4 Measurement Center
The data obtained from the smart meters and the center is collected. In this center; assessment, estimated energy consumption, system efficiency analysis, load profiling, outage and failure management can be performed.
3.2.6 Communication Technologies
While studying with control and communication with power applications it is an SG system as described previously. If the competition evolves between communications infrastructure owners and requesting access to these structures with employees to serve in the same class of operators, an increasingly continuing argument can be specified. As a result of this competition, it will be provided that consumers can access to better quality and lower cost of energy.
As shown in Figure 3.4, SG needs more sophisticated power flow ability as dual way communication at the same time (Liu, 2011).
Therefore it needs too much real time communication networks for data collection and processing (NIST, 2013). It can be done by networks which have different communication capabilities.
Figure 3.4 Smart grid communication and power flow architecture
If the features of networks are examined which have different communication skills such as:
1. Wide Area Networks (WANs) that interconnect communication facilities in different parts of a country or are used as a public utility (IEEE, 2008).
2. Local Area Networks are used in only single personal area. Although other networks can be classified for their covered geographical area, this situation is different for LAN because; LAN is a peer-to-peer communication network and also supply its’ users point-to-point and point-to-multipoint communication without requiring them to communicate with any intermediate switching nodes. LAN communication occurs at
moderate to high data rates with short transit delays like a few milliseconds or less (IEEE, 2008).
3. A Metropolitan Area Network (MAN) is optimized for a wider geographical area than LAN (IEEE, 2008). MANs can bound up with communications channels of alleviating to high data rates like with local networks, a MAN can be owned and processed only by an organization and may be owned and operated as public services, but it usually will be used by many individuals and organizations (IEEE, 2008).
4. Building Area Networks (BANs) can be called as part of networks which are used in buildings. It can be considered that every floor has another BAN and connected to each other with LAN.
5. A network is called as Home Area Networks (HANs) if it is structured as a LAN but only used around the house environments.
6. Neighborhood Area Networks (NANs) are networks which include lots of interconnected HANs that have neighborhood about data exchanging. Whereby NAN can supply measurement data to data collector and enables to control of HANs.
7. Industrial Area Networks (IANs) are being used in industrial applications like operated LANs. Addition to usage areas, Industrial Area Networks (IANs), Home Area Networks (HANs) and Building Area Networks (BANs) can be either wired or wireless networks on customer antecedents (home, building and industry areas) that encourage messaging between appliances like AMI, power electronics, energy management devices, other smart applications, and consumers (IEEE, 2011). Applications and communications in these networks might be driven by Home Energy Management Systems (HEMS) or other energy management systems.
Although many of these terms are not official, they are commonly used with applications.
“The network and the system need to be modernized and brought into the digital age. The advantages and opportunities for huge technological and economic gains are enormous”. Morgan Stanley Energy Insights.
The network topologies are designed to have extensive applicability in many occasions. The networks are created to allow various data devices, such as (IEEE, 2008):
Computers
Mass storage devices that have low costs
Wireless terminals
Monitoring and control equipment
Bridges, routers, and gateways
Integrated Services devices
Data applications
The SG has to renew itself, adapt to the new technologies, and must be cheap. Also, it must be able to find the best solution to possible problems on transportation. SG infrastructure is more complex than the traditional EG infrastructure. It has a lot of plants which demand to connect and communicate with central generation. Therefore, it is intended to model an SG system which searches for best communication methods that can be used with MG in this study. These methods can be categorized as wireless and wired communication methods.
3.2.6.1 Wireless Communication
Wireless communication is a technology which supplies data transmission without use of cables. It allows communication to higher point that cannot be achieved by cables but generally with low data rates. Transmitting data must be protected with a very high level of security.
Also, it has not a wide area of transmission, usually it is marked to use in HAN and NAN with wireless communication. It can be mentioned that these are the general characteristics of it.