A MULTI‐MODAL DISCRETE‐EVENT SIMULATION
MODEL FOR MILITARY DEPLOYMENT
A THESIS
SUBMITTED TO THE DEPARTMENT OF
INDUSTRIAL ENGINEERING
AND THE INSTITUTE OF ENGINEERING AND SCIENCE
OF BİLKENT UNIVERSITY
IN PARTIAL FULFILLMENT OF THE REQUIREMENTS
FOR THE DEGREE OF
DOCTOR OF PHILOSOPHY
By
Uğur Ziya Yıldırım
January 2009
I certify that I have read this thesis and have found that it is fully adequate, in scope and in quality, as a dissertation for the degree of Doctor of Philosophy. ‐‐‐‐‐‐‐‐‐‐‐‐‐‐‐‐‐‐‐‐‐‐‐‐‐‐‐‐‐‐‐‐‐ Prof. Barbaros Ç. Tansel (Supervisor) I certify that I have read this thesis and have found that it is fully adequate, in scope and in quality, as a dissertation for the degree of Doctor of Philosophy. ‐‐‐‐‐‐‐‐‐‐‐‐‐‐‐‐‐‐‐‐‐‐‐‐‐‐‐‐‐‐‐‐‐ Prof. İhsan Sabuncuoğlu (Supervisor) I certify that I have read this thesis and have found that it is fully adequate, in scope and in quality, as a dissertation for the degree of Doctor of Philosophy. ‐‐‐‐‐‐‐‐‐‐‐‐‐‐‐‐‐‐‐‐‐‐‐‐‐‐‐‐‐‐‐‐‐ Prof. Cevdet Aykanat
I certify that I have read this thesis and have found that it is fully adequate, in scope and in quality, as a dissertation for the degree of Doctor of Philosophy. ‐‐‐‐‐‐‐‐‐‐‐‐‐‐‐‐‐‐‐‐‐‐‐‐‐‐‐‐‐‐‐‐‐ Prof. Berna Dengiz I certify that I have read this thesis and have found that it is fully adequate, in scope and in quality, as a dissertation for the degree of Doctor of Philosophy. ‐‐‐‐‐‐‐‐‐‐‐‐‐‐‐‐‐‐‐‐‐‐‐‐‐‐‐‐‐‐‐‐‐ Assoc.Prof. Oya Ekin Karaşan Approved for the Institute of Engineering and Sciences: ‐‐‐‐‐‐‐‐‐‐‐‐‐‐‐‐‐‐‐‐‐‐‐‐‐‐‐‐‐‐‐‐‐ Prof. Mehmet Baray Director of Institute of Engineering and Sciences
ABSTRACT
A MULTI‐MODAL DISCRETE‐EVENT SIMULATION MODEL FOR
MILITARY DEPLOYMENT
Uğur Ziya Yıldırım
Ph.D. in Industrial Engineering
Supervisors: Prof. Barbaros Ç. Tansel
Prof. İhsan Sabuncuoğlu
January 2009
This study introduces a logistics and transportation simulation as a tool that can be used to provide insights into potential outcomes of proposed military deployment plans. More specifically, we model a large‐scale real‐world military Deployment Planning Problem (DPP) that involves planning the movement of military units from their home bases to their final destinations using different transportation assets on a multimodal transportation network. We apply, for the first time, the Event Graph methodology and Listener Event Graph Object framework to create a discrete event simulation (DES) model of the DPP. We use and extend Simkit, an open‐source Java Application Programming Interface for creating DES models. The high‐resolution approach that we take in most part, allows us to estimate whether a given plan of deployment will go as intended, and determine prospective problem areas in a relatively short time compared to other existing simulations because of the absence of the need to use several models of differing resolutions in succession as often done in literature. For a typical deployment scenario for four battalions, run times are between 25 to 27 minutes for 60 runs of the model on a 1.6 GHz Pentium(R) M PC with 512 MB RAM. That is less than 30 seconds per run.
To accurately incorporate real and detailed transportation network data into the simulation, we use GeoKIT, a state‐of‐the‐art, Java‐based Geographical Information System. The component‐based approach adopted in development of our simulation model enables us to easily integrate future additions to our model. The DES developed as part of this dissertation provides a test bed for currently existing deployment scenarios. While our DES model is not a panacea for all, it allows for testing the feasibility and sensitivity of deployment plans under stochastic conditions prior to committing members of the military into harm’s way.
Our main contribution is to develop a comprehensive, multi‐modal, high‐ resolution, loosely‐coupled and modular, extendable, platform independent, state‐of‐ the‐art GIS based simulation environment that views the deployment operations as end‐to‐end processes. Such a simulation environment for multi modal deployment planning and analysis does not exist. Additionally, we simulate and analyze a typical real‐world case study by using conventional methods and the rather novice Nearly Orthogonal Latin Hypercube Sampling (NOLHS) technique. We use a space‐filling nearly orthogonal design of 29 factors and 257 runs to determine the factors that impact most on a deployment plan. We make 15 replications of each of the 257 runs (scenarios) to reach a total of 257x15=3855 computer runs compared to an experiment with 29 factors, each with only 2 levels and 15 replications per run, for a complete enumeration experiment (229 x15= 8,053,063,680
computer runs!).
Keywords: discrete‐event simulation; military deployment; event graphs; java;
geographical information system, nearly orthogonal latin hypercube sampling.
ÖZET
ASKERİ BİRLİKLERİN İNTİKALİ İÇİN ÇOK‐MODLU BİR KESİKLİ
OLAY SİMÜLASYONU
Uğur Ziya Yıldırım
Endüstri Mühendisliği Bölümü Doktora
Tez Yöneticisi: Prof. Barbaros Ç. Tansel
Prof. İhsan Sabuncuoğlu
Ocak 2009
Bu tezde, askeri intikal planlarının muhtemel sonuçlarına ışık tutabilecek bir lojistik ve ulaştırma simülasyon modeli tanıtılmaktadır. Daha detaylı olarak bahsedecek olursak, gerçek hayatta karşılaşılan ve çok modlu bir ulaştırma ağını kullanarak kışlalarından hedef bölgelerine intikal eden büyük çaplı askeri birliklerin intikal problemini modellemekteyiz. İlk defa olarak, Event Graphs (Olay Grafikleri) ve
Listener Event Graph Objects (Dinleyen Olay Grafiği Nesneleri) altyapısını kullanarak
intikal problemininin simülasyon modelini oluşturduk. Kesikli olay simülasyon modelimizi geliştirirken, bir açık kaynak Java Uygulama Programlama Arayüzü olan
Simkit’i kullandık ve ilaveler yaptık. Çoğunlukla kullandığımız çok çözünürlü
yaklaşım sayesinde, bir intikal planının arzu edildiği şekilde yürüyüp yürümeyeceğini ve muhtemel problem sahalarını ne olabileceğini, literatürde genelde kullanılmakta olan farklı çözünürlü modellerin ardışık çalıştırılması yaklaşımına nazaran daha çabuk bir şekilde belirleyebilmekteyiz. Dört taburun intikalini içeren tipik bir intikal senaryosu modelinin 1.6 GHz Pentium(R) M özelliklerinde ve 512 MB RAM içeren bir bilgisayarda 60 defa çalıştırılması 25 ile 27 dakika arasında sürdü. Bu çalıştırma başına 30 saniyeye tekabül etmektedir.
Ulaştırma ağına ait gerçek ve detaylı bilgileri simülasyon modelinde kullanabilmek maksadıyla, teknolojinin son yeniliklerini içeren Java tabanlı bir coğrafi bilgi sistemi yazılımı olan GeoKIT’i kullandık. Simülasyon modelimizi geliştirirken kullandığımız modüler yaklaşım gelecekte yeni modüllerin kolayca eklenmesini sağlamaktadır. Bu tezin bir parçası olarak geliştirilen kesikli olay simülasyonu mevcut intikal senaryoları için bir test ortamı yaratmaktadır. Her ne kadar geliştirdiğimiz kesikli olay simülasyon modeli askeri intikale ait tüm sorunların panzehiri olmasada, askeri personeli tehlikeye atmadan önce intikal planlarının fizibilite ve duyarlılık analizlerini stokastik bir ortamda deneme fırsatı sunmaktadır.
En büyük katkımız kapsamlı, çok modlu, yüksek çözünürlü, esnek ve modüler, geliştirilebilir, değişik donanımlar üzerinde çalışabilen, teknolojinin son yeniliklerine sahip bir coğrafi bilgi sistemi yazılımı üzerinde çalışan ve intikali baştan sona modelleyen bir simülasyon ortamı yaratmamızdır. Çok modlu intikal planlaması ve analizi için böyle bir simülasyon ortamı bulunmamaktadır.
Ayrıca, tipik bir gerçek dünya probleminin simülasyon modelini klasik ve henüz nispeten yeni ortaya konmuş bir yöntem olan Nearly Orthogonal Latin Hypercube
Sampling (Yaklaşık Dikey Latin Hiperküp Örneklemesini) kullanarak analiz ettik. 29 faktör
ve 257 farklı faktör seviyesi (senaryo) içeren, örneklem uzayını dolduran ve yaklaşık dikey bir tasarım kullandık. Her senaryo için 15 tekrar yaparak modeli bilgisayarda 257x15=3855 defa çalıştırdık. Bunu tüm alternatifleri deneyen ve sadece ikişer seviye içeren 29 faktörlü bir tasarımda onbeşer tekrarlı bir deneyle kıyaslarsak, o zaman modeli bilgisayarda 229 x15= 8,053,063,680 defa çalıştırmamız gerekecekti. Anahtar sözcükler: kesikli olay simülasyonu; askerî intikal; olay grafikleri; java; coğrafi bilgi sistemi; yaklaşık dikey latin hiperküp örneklemesi.
ACKNOWLEDGEMENTS
I thank my advisors Prof. Barbaros Tansel and Prof. İhsan Sabuncuoğlu for their guidance, expertise, and patience throughout this dissertation research. With their support and encouragement, this study has been an enjoyable and invaluable learning experience for me. They are what kept me going as I struggled with details of this research in peculiar places of the globe such as Baku‐Azerbaijan, Constanta‐Romania, and Kabul‐Afghanistan, and during deployment orders to northern Iraq. They are true role models, both as an academic and as a person, and there is still so much I can learn from them. It has really been an honor to work with these consummate academics.
I am indebted to members of my dissertation committee, Prof. Cevdet Aykanat, Prof. Berna Dengiz, and Assoc. Prof. Oya Ekin Karaşan, for showing keen interest in the subject matter and for accepting to read and review this thesis. Their remarks and recommendations have been invaluable. I am grateful to Prof. Mehmet Baray for his confidence in me. I would like to express my thanks to Major İbrahim Akgün for his true friendship, support, and encouragement on this similar topic we have worked on. I am also grateful to Erhan Çınar, Murat Durmaz, and Tolga Akçelik for their true friendship and help in integrating GeoKIT to our simulation software.
Last but not least, I thank my parents and sister for their unconditional love, support, understanding, and patience. Without them, this study would not have been possible. This is what kept me away from them over the years during Bayrams and holidays.
TABLE OF CONTENTS
LIST OF FIGURES ... X LIST OF TABLES ... XI ABBREVIATIONS ... XII 1. INTRODUCTION ... 1 1.1. OVERVIEW ... 11.2. PROBLEM AND SYSTEM DEFINITION ... 3
1.3. BACKGROUND, PURPOSE, AND RATIONALE ... 7
2. BACKGROUND ... 13 2.1. DEPLOYMENT ... 13 2.1.1. Mobilization, Deployment, Redeployment, Employment, and Demobilization Processes ... 13 2.2.1. Deployment Phases ... 14 2.3.1. Deployment Planning ... 28 3. THE MODELING ARTIFACTS ... 31
3.1. THE PROGRAMMING LANGUAGE ... 31
3.1.1. Java Features and Terms ... 31 3.1.2. Why Java2TM ? ... 31 3.2. SIMKIT ... 32 3.2.1. Event List Implementation in Simkit ... 33 3.2.2. Starting and Stopping ... 33 3.2.3. Tasks in Running a Simkit Model ... 34 3.2.4. Listener Patterns ... 34 3.2.5. PropertyChangeListener Pattern ... 36 3.2.6. Collecting Statistics ... 36 3.2.7. Generating Random Numbers and Variates ... 37 3.2.8. Obtaining Simkit ... 37 3.2.9. The Reasons for Selecting Simkit and Event Graphs ... 38 3.2.10. The Listener Event Graph Objects (LEGOs) ... 41
3.3. THE GEOGRAPHICAL INFORMATION SYSTEM (GIS) ... 43
4. THE MODELING DETAILS ... 47
4.1. COMPONENTS OF THE DEPLOYMENT SIMULATION ... 47
4.2. THE LAND COMPONENT ... 47
4.2.1. HomeBaseDeparture Class ... 47
4.2.2. LandMaintDelay Class ... 53
4.2.3. LandArrivalDestination Class ... 55
4.2.4. Exogenous (Input) and Endogenous (Output) Variables for the Land Component ... 56
4.3. THE SEA COMPONENT ... 59
4.3.1. LandArrivalAtSPOE Class ... 59
4.3.2. SeaMaintDelay Class ... 60
4.3.3. SeaArrivalAtSPOD Class ... 62
4.3.4. Exogenous (Input) and Endogenous (Output) Variables for the Sea Component ... 63
4.4.1. LandArrivalAtRPOE Class ... 66
4.4.2. RailMaintDelay Class ... 67
4.4.3. RailArrivalAtRPOD Class ... 69
4.4.5. Exogenous (Input) and Endogenous (Output) Variables for the Rail Component ... 70
4.5. THE AIR COMPONENT ... 73
4.5.1. LandArrivalAtAPOE Class ... 73
4.5.2. AirDelay Class ... 74
4.5.3. AirArrivalAtAPOD Class ... 75
4.5.4. Exogenous (Input) and Endogenous (Output) Variables for the Air Component ... 76
4.6. THE SIMULATION EVENT LISTENER PATTERNS ... 78
4.6.1. The Simulation Event Listener Pattern for Land and Sea Components ... 80
4.6.2. The Simulation Event Listener Pattern for Land and Rail Components ... 82
4.6.3. The Simulation Event Listener Pattern for Land and Air Components ... 83
4.7. ANIMATION AND GRAPHICAL USER INTERFACE (GUI) ... 84
4.8. EXPLANATIONS OF SOME OF THE OTHER JAVA CLASSES (MODULES) ... 91
4.8.1. Model Package (Component) ... 91 4.8.2. GUI Package (Component) ... 92 4.8.3. Statistics Package (Component) ... 92 4.8.4. Network Package (Component) ... 92 4.8.5. Explorer Package (Component) ... 93 5. VERIFICATION AND VALIDATION ... 94 6. SIMULATION ANALYSIS OF A TYPICAL REAL‐WORLD SCENARIO ... 100
6.1. SIMULATION ANALYSIS OF A TYPICAL REAL‐WORLD CASE STUDY ... 100
6.2. INITIAL RESULTS ... 104
6.3. FURTHER ANALYSIS USING NOLH SAMPLING ... 107
6.3.1. Nearly Orthogonal Latin Hypercube Sampling and Its Application ... 108
6.3.2. Further Results ... 110
6.4. CONCLUSIONS AND FUTURE WORK ... 114
APPENDIX A ... 116 REFERENCES ... 132
LIST OF FIGURES
FIGURE 1. INTRA‐THEATER MOVEMENT OF UNITS (ADAPTED FROM FM 4.01‐011). ... 16
FIGURE 2. INTER‐THEATER UNIT MOVEMENT (ADAPTED FROM FM 4.01‐011). ... 17
FIGURE 3. A NOTIONAL SEAPORT OF EMBARKATION. (ADAPTED FROM FM 4.01‐011) ... 19
FIGURE 4. A NOTIONAL AERIAL PORT OF EMBARKATION. (ADAPTED FROM FM 4.01‐011) ... 20
FIGURE 5. A NOTIONAL MARSHALING AREA AT A SPOE (ADAPTED FROM FM 4.01‐011) ... 22
FIGURE 6. A NOTIONAL SEAPORT OF DEBARKATION (ADAPTED FROM FM 4.01‐011). ... 25
FIGURE 7. A NOTIONAL AERIAL PORT OF DEBARKATION. ... 26
FIGURE 8. RECEPTION AND ONWARD MOVEMENT. (ADAPTED FROM FM 4.01‐011) ... 27
FIGURE 9. SIMEVENTLISTENER PATTERN. ... 36
FIGURE 10. EVENT SCHEDULING USING EVENT GRAPHS. ... 40
FIGURE 11. EVENT CANCELLING USING EVENT GRAPHS. ... 40
FIGURE 12. EVENT GRAPH FOR MULTIPLE‐SERVER QUEUE. ... 41
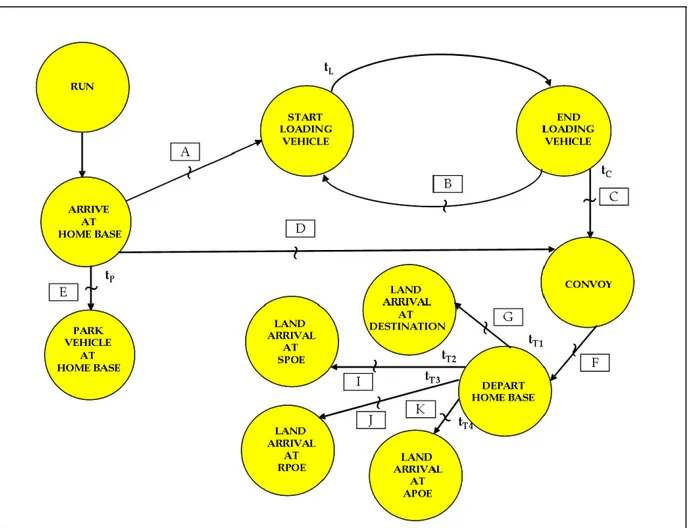
FIGURE 13. SIMPLIFIED EVENT GRAPH FOR THE LAND COMPONENT’S HOMEBASEDEPARTURE CLASS. ... 49
FIGURE 14. A MORE DETAILED EVENT GRAPH FOR THE HOMEBASEDEPARTURE CLASS. ... 50
FIGURE 15. SIMPLIFIED EVENT GRAPH FOR THE LAND COMPONENT’S LANDMAINTDELAY CLASS. ... 54
FIGURE 16. SIMPLIFIED EVENT GRAPH FOR THE LANDARRIVALATDESTINATION CLASS. ... 56
FIGURE 17. SIMPLIFIED EVENT GRAPH FOR THE SEA COMPONENT’S LANDARRIVALATSPOE CLASS. ... 60
FIGURE 18. SIMPLIFIED EVENT GRAPH FOR THE SEA COMPONENT’S SEAMAINTDELAY CLASS. ... 61
FIGURE 19. SIMPLIFIED EVENT GRAPH FOR THE SEA COMPONENT’S ARRIVALATSPOD CLASS. ... 63
FIGURE 20. SIMPLIFIED EVENT GRAPH FOR THE RAIL COMPONENT’S LANDARRIVALATRPOE CLASS. ... 67
FIGURE 21. SIMPLIFIED EVENT GRAPH FOR THE RAIL COMPONENT’S RAILMAINTDELAY CLASS. ... 69
FIGURE 22. SIMPLIFIED EVENT GRAPH FOR THE RAIL COMPONENT’S ARRIVALATRPOD CLASS. ... 70
FIGURE 23. SIMPLIFIED EVENT GRAPH FOR THE AIR COMPONENT’S LANDARRIVALATAPOE CLASS. ... 74
FIGURE 24. SIMPLIFIED EVENT GRAPH FOR THE AIR COMPONENT’S AIRDELAY CLASS. ... 75
FIGURE 25. SIMPLIFIED EVENT GRAPH FOR THE AIR COMPONENT’S AIRARRIVALATAPOD CLASS. ... 76
FIGURE 26. THE SIMULATION EVENT LISTENER PATTERN FOR LAND AND SEA COMPONENTS. ... 80
FIGURE 27. THE SIMULATION EVENT LISTENER PATTERN FOR LAND AND RAIL COMPONENTS. ... 83
FIGURE 28. THE SIMULATION EVENT LISTENER PATTERN FOR LAND AND AIR COMPONENTS. ... 84
FIGURE 29. A SAMPLE SCREEN SHOT OF ANIMATION SHOWING A DEPLOYMENT USING ROAD (THIN BLACK LINES) AND RAIL NETWORKS (THICK BROWN LINES) AND SEA LINES (BEST VIEWED IN COLOR). ... 85
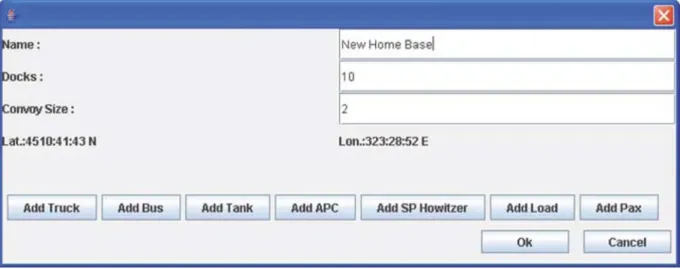
FIGURE 30. A SCREEN CAPTURE OF THE HOME BASE CREATION SCREEN. ... 86
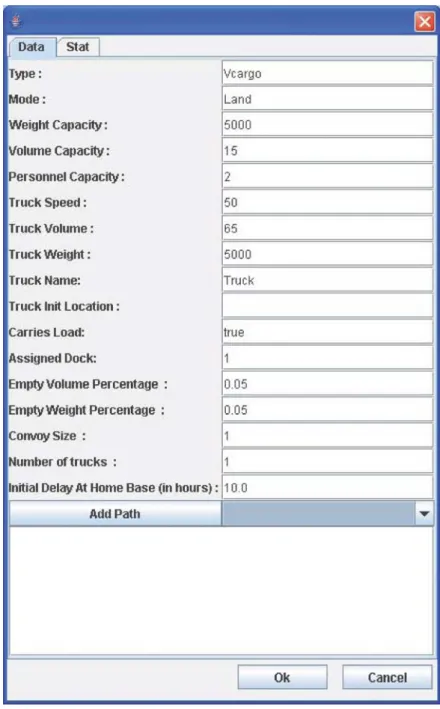
FIGURE 31. A SCREEN CAPTURE OF THE TRUCK CREATION SCREEN. ... 87
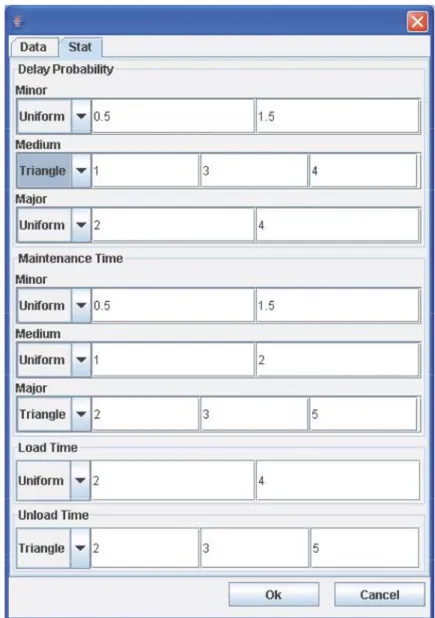
FIGURE 32. A SCREEN CAPTURE OF THE TRUCK BREAKDOWN PROBABILITIES AND MAINTENANCE, LOAD/UNLOAD TIME DISTRIBUTIONS CREATION SCREEN. ... 88
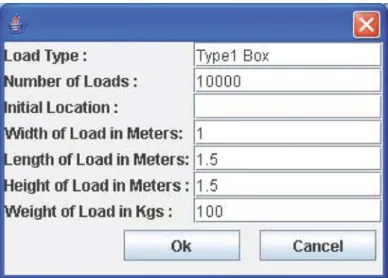
FIGURE 33. A SCREEN CAPTURE OF LOAD CREATION. ... 89
FIGURE 34. A SCREEN CAPTURE OF PAX CREATION. ... 89
FIGURE 35. A SCREEN CAPTURE OF SPOE CREATION. ... 90
FIGURE 36. A SCREEN CAPTURE OF NETWORK MODULE. ... 90
FIGURE 37. SIMPLIFIED VERSION OF THE MODELING PROCESS (ADAPTED FROM SARGENT, 2001)... 94
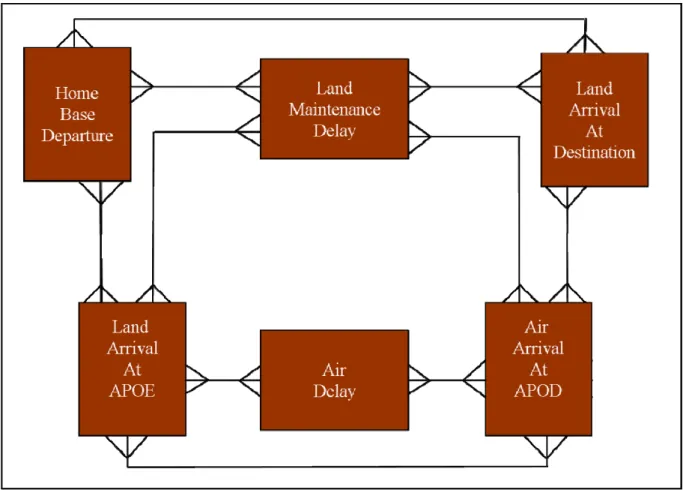
FIGURE 38. ONE OF THE NETWORK MODELS USED FOR VERIFICATION PURPOSES. ... 96
FIGURE 39. PERCENTAGE OF AVERAGE ON‐TIME ARRIVALS VS. REDUCTION IN TMAX BY 12 HOURS FOR UNIT A. ... 106
FIGURE 40. PERCENTAGE OF AVERAGE ON‐TIME ARRIVALS VS. REDUCTION IN TMAX BY 12 HOURS FOR UNIT D. ... 107
LIST OF TABLES
TABLE 1. MOBILITY PLANNING, LOGISTICS AND TRANSPORTATION MODELS AND SIMULATIONS COMMONLY USED
BY MILITARY PLANNERS. ... 8
TABLE 2. RELATIONSHIP BETWEEN EVENT GRAPHS AND SIMKIT (ADAPTED FROM (JOSE, 2001)). ... 39
TABLE 3. OPTIMAL NUMBERS, MOVEMENT ROUTES, AND MOVEMENT TIMES OF LOADED TRUCKS. ... 98
TABLE 4. UNITS LISTED BY THEIR DEPLOYMENT COMPONENTS AND MAJOR EQUIPMENT. ... 101
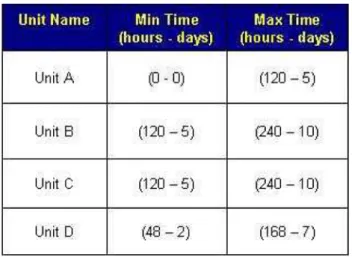
TABLE 5. TIME WINDOWS FOR UNITS TO BE DEPLOYED... 102
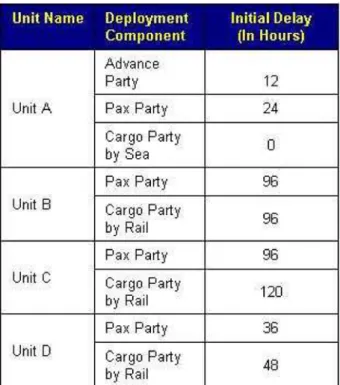
TABLE 6. INITIAL DELAY TIMES FOR EACH DEPLOYMENT COMPONENT. ... 103
TABLE 7. FACTORS AND THEIR LEVELS. ... 110
TABLE 8. 10 RUNS FOR FIRST 5 FACTORS OF 257‐RUN MATRIX. ... 111
ABBREVIATIONS
ADAMS Allied Deployment and Mobility System ALD available‐to‐load date APC armored personnel carrier APOE air port of embarkation APOD air port of debarkation DPP deployment planning problem DES discrete‐event simulation EAD earliest arrival date EG Event Graph ELIST the Enhanced Logistics Intra‐Theater Support Tool FEL future event list GUI graphical user interface JFAST the Joint Flow and Analysis System for Transportation LAD latest arrival date LEGO Listener Event Graph Object MOE measures of effectiveness MSR main supply route NATO North Atlantic Treaty Organization NOLHS nearly‐orthogonal Latin Hypercube Sampling POE port of embarkation POD port of debarkation PORTSIM the Port Simulation PSA port support area RDD required delivery date RLD ready‐to‐load date
RoRo roll‐on roll‐off RPOE rail port of embarkation RPOD rail port of debarkation SPOE sea port of embarkation SPOD sea port of debarkation TA transportation asset TLoaDS the Tactical Logistics Distribution System TPFDD time‐phased force deployment data TRANSCAP Transportation System Capability SIMULOGS Simulation of Logistics Systems UTM Universal Transverse Mercator WGS World Geodetic System
1. INTRODUCTION
In this chapter, we give an overview of the problem, define the problem and the system, present the background information, and give the purpose and rationale behind our work. 1.1. OVERVIEW Regional and asymmetric threats and the increase in worldwide terrorist activity have made logistics and mobility increasingly important in our rapidly changing world. This study focuses on logistics and transportation simulations or computer‐based planning tools that are used to provide insight into the potential outcomes of proposed logistical courses of actions prior to and after committing members of the military into harm’s way. Specifically, we deal with the Deployment Planning Problem (DPP), defined and thoroughly described first by Akgün and Tansel (2007). DPP involves positioning of many military units to carry out a mission. During peace time, military units move from their home bases to their designated destinations using different transportation assets. This movement usually takes place on a multimodal (land, rail, sea, air, and inland waterways) transportation network. During a crisis, where time is of essence, it becomes critical to move troops and equipment with limited resources and on a short notice. The movement of the units must conform to a preplanned time‐table called time‐phased force deployment data (TPFDD). The TPFDD describes, among other things, the initial departure times of military units from their home bases, andtheir earliest and latest arrival times at their designated destinations. When many units need to deploy, the TPFDD is intended to coordinate their movement in order to efficiently use the existing transportation assets and network. It is also meant to prevent congestion at destinations and transfer points, where mode changes are necessary. Yet, creating TPFDD requires joint work of well‐trained logistical and operational planners, and is very time consuming. Military deployment planners need a fast and accurate tool that takes into account the stochastic nature of events to analyze a military deployment plan.
A deployment plan may not always go as initially planned. Unexpected breakdown of transportation assets, road traffic accidents, and congestion at transfer points are some of the events that may disrupt a plan. A deployment involves simultaneous movement and utilization of many entities, resources, and transportation assets. Thus, a stochastic model is more suitable for analyzing this truly hard real‐ world problem that deals with expensive military hardware and irreplaceable human life.
Existing models and simulations are of varying resolutions. Most of the time, higher‐resolution models provide input to the lower‐resolution models. This makes it necessary to run several models in succession for analysis. But such a set‐up takes a long time. Almost all of the deployment related models require a specific hardware system to run on. Yet, military usually employs different hardware systems, and thus it
would be useful to have models or simulations which can run on multiple platforms. A detailed and accurate representation of the transportation network and infrastructure is necessary for realistic analysis. Thus, there is a need for a geographical information system to be used with deployment models or simulations. Currently existing models or simulations either do not have this capability or have a limited representation of geographical information. Furthermore, not all transportation modes are modeled in all deployment models or simulations, which makes it necessary to run at least two models in succession for a large deployment scenario. This again increases set‐up and run times. Thus, it is desirable to have a multi‐modal simulation model.
For these reasons, we have decided to develop a multi‐modal, platform‐ independent, discrete‐event simulation model of military deployment with accurate transportation network and infrastructure data, and a high‐resolution except at transfer points, allowing planners to develop and analyze plans in a relatively short time. 1.2. PROBLEM AND SYSTEM DEFINITION The DPP is fully described in Akgün and Tansel (2007). Most of the following is borrowed from their description and rephrased as necessary.
The DPP deals with the movement of many military units from their Areas of Responsibilities (home bases) to their Tactical Assembly Areas (final destinations). The movement could be either an intra‐theater or an inter‐theater type. Intra‐theater movement can be regarded as the movement of units using different modes of
transportation (e.g., land, sea, air, and rail) inside a country’s borders. Inter‐theater movement refers to the movement of units between countries using air and sea assets (strategic deployment). Once the units reach the destination country, then other available modes of transportation can be utilized inside that country. In this context, the terms “theater” and “country” are used synonymously.
During intra‐theater movement, a unit may go directly from its home base to its final destination throughout the entire journey using a single mode of transportation assets (TAs) on a given mode of transportation network that supports the movement of the TAs under consideration. It may also use in succession any of land, rail, sea, or air transportation networks and the TAs dedicated to them, making mode changes as necessary along the way. However, the fewer the mode changes are at transfer points, the easier is the deployment. If a transfer is necessary, the initial movement from home bases is by ground transportation to a transfer point (a location where the movement switches from one mode of transportation to another). Main transfer points are harbors, train stations, and airports. At these locations, the pax (troops) and cargo (weapon systems, material, equipment, and supplies) of a unit are transferred from one set of TAs to another set that operate on a different network. This location is also called a Port of Embarkation (POE). The next mode change location, where the items are offloaded and loaded onto another set of TAs is called a Port of Debarkation (POD). These may be sea, rail, and air POEs or PODs. Inter‐theater movement differs from intra‐theater
movement only by its use of strategic lift (air and sea) assets to reach the next theater of operations (Akgün and Tansel, 2007).
At transfer points, units usually queue up before being loaded on vessels. This location is called a staging area where units wait and prepare for shipment. A staging area can be regarded as a service point, i.e. one with a certain capacity of material handling equipment and load/unload docks. When there is not enough capacity at a staging area to hold large number of deploying units, a marshalling area is operated. A marshalling area can be regarded as a waiting/parking place prior to entering the staging area. It helps provide an uninterrupted flow of items through their transfer points. Staging/Marshalling areas are also operated at home bases and destinations (Akgün and Tansel, 2007).
A unit may be divided into three components (forward party, pax party, and cargo party) during deployment. Ground movement is usually conducted in convoys to maintain the unity of the component, and the size of the convoys may vary depending on operational/tactical objectives and limitations. The synchronization of departures of these components from their home bases and their arrival at their designated destinations is dictated by operational requirements, threat level, availability and capacity (lanemeter, seat, volume, weight) of lift assets, and the current conditions of transportation infrastructure (Akgün and Tansel, 2007).
A unit will usually use its own (organic) TAs to conduct a deployment. However, for heavy lift requirements (for example tanks and artillery pieces) over long distances, TAs of other military transportation units may have to be used. In addition, outsourcing of TAs from national civilian companies or other nations may be required depending on the distances and numbers and sizes of units involved in the deployment.
While time is of essence during a crisis, cost may be of main concern during peace time. The source of TAs used affects the cost and timing issues of unit movements. For example, outsourced TAs may not be available on time and leasing costs are associated with them. In addition, unpredictable stochastic events (breakdowns, accidents, delays etc.), load/unload/idle times at home bases/destinations/transfer points, convoy speeds, and speeds of transportation assets need to be taken into account to determine if a plan of deployment may be realized in actuality.
The planning for a particular deployment may take place beforehand. This is called deliberate planning when time is not a critical factor. When the time available for planning for actual deployment of armed forces is short, this is called crisis planning or time‐sensitive planning where the planning process must be quick and flexible to adapt to changing situations. Deliberate planning may contribute to time‐sensitive planning. Whether deliberate or not, each deployment plan has a TPFDD which at least includes units’ transportation requirements by type and quantity, and movement data by mode,
earliest times of departures from home bases, and earliest and latest times of arrivals at POEs / PODs / destinations. It divides a unit’s components by transportation mode, ports of embarkation or debarkation, and movement dates.
1.3. BACKGROUND, PURPOSE, AND RATIONALE
There exist deployment planning models and simulations with varying levels of detail and purpose. For a more comprehensive survey of military planning systems and a review of strategic mobility models supporting the defense transportation system, the interested reader is referred to Boukhtouta et al. (2004) and McKinzie and Barnes (2003). It is possible to classify military deployment models and simulations into two groups depending on their level of resolution and the purpose of use.
The first group includes relatively low‐resolution models and simulations that may be used to model deployment of military units between theaters of operation (e.g., from Turkey to Afghanistan) or inside a theater of operation (e.g., inside Turkey). Deployments between different theaters of operation using only air and sea transportation assets are referred to as strategic deployment. The most frequently used modeling tools (software) for modeling strategic deployments are NATO’s ADAMS (Allied Deployment and Movement System) and U.S. Military’s JFAST (The Joint Flow and
Analysis System for Transportation). A technical guide for ADAMS is provided by Heal
and Garnett (2001) and general information for JFAST is available at <http://www.jfast.org>. An example of simulations modeling deployment inside a
theater of operation is ELIST (The Enhanced Logistics Intra‐Theater Support Tool, Groningen et al., 2005).
The second group includes higher‐resolution models and simulations that may also be used to provide input to the models in the first group. Examples of these models and simulations are TLoaDS (The Tactical Logistics Distribution System, 1999) and
PORTSIM (The Port Simulation, 2004). Other important examples of such models are
TRANSCAP (Transportation System Capability, 2006), SIMULOGS (Simulation of Logistics Systems, 2006), and Simulation of Transportation Logistics (2002). Table 1 gives a comparison of the aforementioned models in terms of their characteristics for multi‐modality, platform independence, GIS‐support, input/output analyzer module, and discrete‐event simulation modeling capability. TABLE 1. Mobility planning, logistics and transportation models and simulations commonly used by military planners. None Both None None Both Both Both Both None Input/ Output Analyzer Module
Written in Java and uses GeoKIT for GIS support. Yes Yes Yes A,R,S,L Yes The Simulation Model proposed in this thesis
Based on ARENA, uses VBA and Excel Yes No No A,S Yes Simulation of Transp. Logistics
Runs on Sun Unix Workstation and PCs with Windows NT Yes Limited Partially L No SIMULOGS Models deployment from US Army installations Yes No Partially L,R Yes TRANSCAP Simulates seaport operations and determines throughput at the port Yes Limited No R,S,L Yes PORTSIM
Built Using EXTENDTMand SDI Industry Pro
Yes Limited No A,R,S,L Yes TLoaDS
For intra‐theater support planning Yes Limited Yes A,R,S,L Yes ELIST
A classified, joint US model for strategic deployment Both Limited Yes A,S Yes JFAST
A NATO model for strategic deployment No Limited No A,S Yes ADAMS Comments Discrete Event Simulation (Yes/No) GIS Support Platform Independence (Yes/No) Air (A), Rail (R), Sea (S), Land(L) Multi Modal (Yes/No) Simulations/ Models None Both None None Both Both Both Both None Input/ Output Analyzer Module
Written in Java and uses GeoKIT for GIS support. Yes Yes Yes A,R,S,L Yes The Simulation Model proposed in this thesis
Based on ARENA, uses VBA and Excel Yes No No A,S Yes Simulation of Transp. Logistics
Runs on Sun Unix Workstation and PCs with Windows NT Yes Limited Partially L No SIMULOGS Models deployment from US Army installations Yes No Partially L,R Yes TRANSCAP Simulates seaport operations and determines throughput at the port Yes Limited No R,S,L Yes PORTSIM
Built Using EXTENDTMand SDI Industry Pro
Yes Limited No A,R,S,L Yes TLoaDS
For intra‐theater support planning Yes Limited Yes A,R,S,L Yes ELIST
A classified, joint US model for strategic deployment Both Limited Yes A,S Yes JFAST
A NATO model for strategic deployment No Limited No A,S Yes ADAMS Comments Discrete Event Simulation (Yes/No) GIS Support Platform Independence (Yes/No) Air (A), Rail (R), Sea (S), Land(L) Multi Modal (Yes/No) Simulations/ Models
Except for the input/output analyzer module, none of the models or simulations relevant to this study in Table 1 meets all of the other four criteria fully. Our proposed simulation model is listed at the bottom of Table 1. We have developed a simulation model of military deployment that meets all of these four criteria and has a high‐ resolution except at transfer points. The modeling level of detail at transfer points for infrastructure is low resolution in that, we use aggregate capacities for each individual transfer point and time delays at these locations for problems such as maintenance breakdowns etc. Even though the level of resolution at transfer points can be increased, we refrained in the dissertation from doing so as the detailed modeling at each transfer point can be separately done without significantly affecting the overall structure of the deployment simulation. The detailed model at a transfer point determines the overall delay induced at that location, which in our case is reflected into our model by appropriate distributions. We use high‐resolution modeling for the modeling of transportation assets, cargo, and resources, which includes specific dimensions of cargo, and capacities, speeds, and dimensions of resources and transportation assets. Furthermore, the GIS data we use in the simulation is also of high‐resolution. It specifies, among other things, the capacities and classifications of bridges, roads, and other detailed data of related transportation infrastructure. As for the input/output analyzer modules, an input analyzer may be obtained through commercial‐off‐the‐shelf
products. An output analyzer module is in development and left as future work to the study at hand.
Our high‐resolution except‐at‐transfer‐points approach to modeling the DPP allows us to obtain quick first‐cut insights into potential outcomes of a deployment plan without compromising reality. For example, for a typical deployment scenario for four battalions, run times are between 25 to 27 minutes for 60 runs of the model on a 1.6 GHz Pentium(R) M PC with 512 MB RAM. That is less than 30 seconds per run. While our high‐resolution except‐at‐transfer‐points simulation model is not a panacea for all, it provides a realistic and quick litmus test for the applicability of existing deployment plans and allows a quick construction of contingency deployment plans. It is an all‐ encompassing model for all modes of transportation. Yet, our model’s extendable architecture is flexible enough to accommodate future addition of higher‐resolution sub‐modules intended especially for detailed modeling at transfer points. Moreover, our model is generic enough to be used in commercial logistics applications after some problem‐specific modifications.
The aim of this dissertation is to develop a logistics and transportation simulation for use in the analysis of military DPP. We apply, for the first time, the event
graph (EG) methodology and listener event graph object (LEGO) framework to create a
multi‐modal discrete‐event simulation model of the DPP. EGs and LEGOs provide a simple yet powerful and elegant way of representing discrete event simulation (DES)
model of deployment, and enable easy creation of component‐based models of a real‐ world military problem. The high‐resolution approach that we take in most part, allows us to estimate whether a given plan of deployment will go as intended, and determine prospective problem areas in a relatively short time compared to other existing simulations because of the absence of the need to use several models of differing resolutions in succession. The short run times achieved demonstrate this. The very accurate and detailed GIS data, and the detailed data used in modeling of entities, resources, and military equipment in the simulation permit us not to exchange reality in favor of shorter run times. We extend Simkit by writing additional Java classes that are specific to military deployment. The component‐based approach adopted in development of our simulation model enables us to easily integrate future additions to our model. The DES developed as part of this dissertation provides a test bed for currently existing deployment scenarios.
Our main contribution is to develop a comprehensive, multi‐modal, high‐ resolution, loosely‐coupled and modular, extendable, platform independent, state‐of‐ the‐art GIS based simulation environment that views the deployment operations as end‐to‐end processes. To the extent of our knowledge, such a simulation environment for multi modal deployment planning and analysis does not exist in the literature. The rest of this dissertation is organized as follows: Chapter II gives background on terminology and basics of deployment planning. Chapter III provides information
on the programming language of choice, Java2TM, the simulation library written in
Java2TM called Simkit, and the Geographical Information System, GeoKIT, used with the
transportation simulation. Chapter IV provides the event graphs (the conceptual and logical models) of the simulation software and its modules developed. Verification and Validation issues are discussed in Chapter V and analysis of a typical real‐world case‐ study scenario is explained and analyzed in Chapter VI.
2. BACKGROUND
This chapter provides basic and necessary background information about deployment planning.
Our aim here is two folds: The first one is to acquaint the reader with military‐ specific terminology used in deployment of military units. The second is to lay out some of the requirements modeled by the transportation simulation being developed as part of this dissertation to assist in planning of military deployments. The concepts and material contained in this chapter is a summary of relevant parts of Field Manual (FM) 4‐01‐11, FM 55‐10, FM 55‐65, FM 100‐17, FM 100‐17‐3. For further details on military‐ specific terminology, the interested reader is referred to these references which most of the material contained here follows. The reader familiar with military‐specific terminology used in transportation and deployment may skip to Chapter 3. 2.1. DEPLOYMENT 2.1.1. Mobilization, Deployment, Redeployment, Employment, and Demobilization Processes
Force projection involves mobilization, deployment, redeployment, employment of
forces, and demobilization.
Mobilization is the process by which all or parts of the Armed Forces are brought
to a state of readiness for war or other national emergencies such as natural disasters. Deployment means preparing and moving the force and its supplies to the area of
Redeployment is the preparation for and movement of the force and its material
deployed from an area of operation to another or to its designated home base.
Employment is the use of forces in their areas of operations to carry out the
mission. Demobilization is the act of returning the force and materiel to a premobilization posture or to some other approved posture. 2.2.1. Deployment Phases Military units may be deployed between theaters of operation (e.g., from Turkey to Afghanistan) or inside a theater of operation (e.g., inside Turkey). Deployments between different theaters of operation (inter‐theater) using only air and sea transportation assets are referred to as strategic deployment. The phases of a strategic (inter‐theater) deployment process are: Predeployment activities Movement to the Port of Embarkation (POE) Strategic lift Reception at the Port of Debarkation (POD) Theater onward movement
If the deployment is inside a theater of operation, it is referred to as an intra‐
theater deployment which may involve all modes of transportation. The following two
origin location to a tactical assembly area (TAA ‐ i.e., the final destination), respectively.
Intra‐theater movement can be regarded as the movement of units using different modes of transportation (land, sea, air, and rail) inside a country (theater) as shown in Figure 1. On the other hand, inter‐theater movement of units can be regarded as the movement of units using only air and sea assets (strategic lift) between countries (theaters). Once the units reach the destination country (theater), then other available modes of transportation can be utilized inside that country (theater) as depicted in Figure 2.
Figure 1. Intra‐theater movement of units (Adapted from FM 4.01‐011). APOE
Staging / Marshalling Area Highway Highway
Rail Waterways Origin Staging / Marshalling Area Intratheater Air APOD Rail Yard SPOE SPOD Rail Yard Alert Holding Area TAA APOE Intratheater Air APOD Waterways Rail SPOE Staging Area SPOD SPOE Rail Yard Staging / Marshalling Area Staging/ Marshalling Area Staging / Marshalling Area
Figure 2. Inter‐theater unit movement (Adapted from FM 4.01‐011). Sea Staging /Alert Holding Area APOE Air APOD SPOE SPOD Alert Holding Area TAA APOE Intratheater Air APOD Waterways Rail Highway SPOE Staging Area SPOD SPOE Rail Yard Staging Marshalling Area Mobilization Station
AOR
STRATEGIC LIFT
THEATER
Marshalling Area
Staging / Marshalling
2.2.1.1. Predeployment Activities
Predeployment activities are those that units carry out based on initial notification, warning orders, and alert orders for operations. They are aimed at preparing forces for deployment. Those that are relevant to the simulation model being developed include echeloning (organizing units for movement, i.e., dividing echelons into advance party, pax party, and cargo party), tailoring (adding or subtracting units to/from a planned task organization based on the mission and available lift), deployment planning, and equipment maintenance.
2.2.1.2. Movement to the POE
The movement to the POE is initiated upon receipt of a movement directive. Units are validated and configured for movement. Units may move from their home stations to the POE using ground and/or rail transportation. If ground transportation is used, movement is carried out in convoys. Convoy is the preferred method of moving wheeled vehicles to ports and other facilities that are within one day’s distance while rail is the preferred method for moving all wheeled vehicles over one day’s driving distance from the port. The accepted deployment method for rotary wing aircraft is by self‐deployment to the POE. Fixed wing aircraft are normally self‐deployable to the area of operation. There are two types of POE, sea and aerial. Figures 3 and 4 depict a notional seaport of embarkation SPOE and an aerial port of embarkation APOE, respectively.
Figure 3. A notional seaport of embarkation. (Adapted from FM 4.01‐011) PORT OPERATIONS CENTER CONTROLS ALL ACTIVITY FROM UNIT ARRIVAL IN PORT AREA THROUGH LOADING ON PORT OPERATIONS CENTER PORT SUPPORT ACTIVITIES Marshalling Area (MA) STAGING AREA (SA) Road Road COMT’L TRUCK OFFLOAD HELICOPTER OPERATIONS STAGING AREA CONTROL ELEMENT RAIL OFFLOAD SHIP SHIP MA CONTROL (SUPPORTING INSTALLATION) (SI)
Figure 4. A notional aerial port of embarkation. (Adapted from FM 4.01‐011) MARSHALLING AREA DEPARTURE AIRFIELD OPERATIONS
ALERT HOLDING AREA CALL FORWARD AREA READY LINE / LOADING
RAMP UNIT AREA UNIT AREA UNIT AREA ASSEMBLY AND INSPECTION RAMP RAMP JOINT INSPECTION FINAL BRIEFING FINAL MANIFEST CORRECTIONS PLANE PLANE PLANE FRUSTRATED CARGO AREA
Units that use a SPOE are held in the port staging area to prepare for shipment before being loaded on vessels. However, in many cases, there is not enough room at the sea terminal to stage the entire unit or large numbers of units scheduled to move at the same time. In such cases, a marshaling area is operated. Figure 5 shows a notional marshaling area at a SPOE. The primary purpose of a marshaling area is to provide a location to receive unit personnel, equipment and supplies, and configure them for overseas movement by sea prior to entering the staging area. As the vessel gets ready, the units are called from the marshaling area to the staging area based on a call forward plan.
The two areas, staging area and marshaling area, serve much the same service. The distinction between them is that the owning command retains responsibility and accountability for the shipment in the marshaling area while port commander assumes the custody of equipment and supplies in the staging area.
INPROCESSING AREA ‐SAFETY/SECURITY OF EQUIPMENT BRIEFING ‐MESSING/BILLETING ‐POL ‐MAINTENANCE ‐MEDICAL SUPPORT ‐TRANSPORTATION MUSTER AREA ‐DECUBE VEHICLES TO SPECIFIED SHIPPING CONFIGURATION ‐VEHICLE INSPECTION *FUEL LEVEL *SECONDARY LOAD *LASHING & SECURITY ‐MAINTENANCE ‐DOCUMENTATION ‐UPDATE ‐VEHICLE KEY CONTROL ‐SECURITY MEASURES FRUSTRATED / HAZARDOUS / SENSITIVE CARGO AREA ‐FRUSTRATED CARGO ‐HAZARDOUS CARGO ‐SENSITIVE CARGO FRUSTRATED CARGO ‐NO LOGMARS LABEL ‐WRONG LABEL ‐ANYTHING PREVENTING DEPLOYMENT HAZARDOUS CARGO ‐CERTIFICATION ‐PROPER STORAGE SENSITIVE CARGO ‐IDENTIFICATION ‐PROPER DOCUMENTATION ‐PROPER SECURITY STORAGE WEIGH STATION SCANNING AREA HOLD AREA INPROCESSING UNIT MUSTER AREA FRUSTRATED / HAZARDOUS AREA MARSHALLING AREA OPERATIONS TO PORT AREA (CALL FORWARD AREA / PORT STAGING AREA
2.2.1.3. Strategic Lift
Strategic lift begins with departure from the POE and ends with arrival at the POD, which is an APOD or a SPOD. Normally troops are deployed by air and equipment by sea. The estimated arrival of equipment at the SPOD normally dictates when personnel are airlifted to the theater. Synchronizing the arrival by air or sea into the area of responsibility at the SPOD and personnel arriving at the APOD is necessary.
Sealift capability involves a variety of vessels, such as RoRo (Roll on \ Roll off) ships, fast sealift ships, ready reserve ships, and chartered ships. Airlift is used primarily to transport personnel, selected vehicles, and unit equipment.
2.2.1.4. Reception at the POD
This implies the arrival of forces at the POD in the area of operation and ends with the departure of the forces from the POD.
Figure 6 shows a notional seaport of debarkation. At SPODs, discharged unit equipment, materiel, and supplies are held in the staging area which is established for the transshipment and accounting of equipment. Figure 7 depicts a notional aerial port of debarkation. At APODs, units go through off‐load ramp area, holding area, and marshaling area to prepare for onward movement.
2.2.1.5. Theater Onward Movement
Figure 8 shows the relationship between reception and onward movement processes. During this critical phase of deployment, the availability of transportation
again takes an important role to keep units and supplies moving forward directly to the area of employment.
Theater onward movement takes place utilizing a movement program that incorporates convoy, rail, and contracted assets to ensure the forward and concurrent movement of troops and supplies. Truck terminal and trailer transfer points are established for use in line‐haul or relay operations. Rail transport, when available, will also be used to transport heavy tracked vehicles and other large items of equipment as far forward as possible. From those points on, heavy equipment transporters complete the movement to destination.
Figure 6. A notional seaport of debarkation (Adapted from FM 4.01‐011). HELICOPTER OPERATIONS H FRUSTRATED CARGO AREA CARGO STAGING AREA PORT CDR PSA HOST NATION PORT RAIL HIGHWAY MVT CTRL CONVOY MARSHALING AREA RAIL STAGING AREA MSR
Figure 7. A notional aerial port of debarkation.
OFFLOADING RAMP AREA HOLDING AREA MARSHALING AREA
PROVIDE MINOR SERVICE (GAS, OIL, MINOR MAINT) INTRANSIT HOLDING AREA ASSEMBLY AND INSPECTION UNIT AREA UNIT AREA UNIT AREA
Figure 8. Reception and onward movement. (Adapted from FM 4.01‐011) RECEPTION ONWARD MOVEMENT PREPOSITIONED STOCKS SPOD MARSHALING AREA MARSHALING AREA MARSHALING AREA T A A APOD AIRHEAD
2.3.1. Deployment Planning
The planning for a particular deployment contingency may take place beforehand. This is called deliberate planning when time is not a critical factor. When the time available for planning for actual deployment or employment of armed forces is short, the planner uses crisis‐action procedures. The overall process of crisis‐action planning mimics that of deliberate planning, but is much more flexible to accommodate requirements to respond to changing events. 2.3.1.1. Deliberate and Crisis‐Action Planning The highest military commands (the services or general staffs) develop deliberate plans during peace time, for potential contingencies within their areas of responsibility. The following definitions are relevant to the work at hand in terms of deliberate and crisis‐action planning:
Each plan has time‐phased force and deployment data (TPFDD) which includes personnel requirements, equipment requirements by type and quantity, and movement data by mode. It divides the unit by transportation mode, ports of embarkation or debarkation, and movement dates. For example, it identifies the advance party of a unit going by air when the unit’s main body and equipment are going by sealift. During a crisis, the responsible command may update the plan with current information and in conjunction with supporting organizations and create operations orders for execution.
Following are the definitions of dates that are used to time‐phase the movement plans according to the TPFDD.
Ready‐to‐load date (RLD): The RLD is the TPFDD date when the unit must be
prepared to depart its origin.
Available‐to‐load date (ALD): The ALD is the TPFDD date when the unit must be
ready to load on an aircraft or ship at the POE.
Earliest arrival date (EAD): The EAD is the earliest date that a unit, a re‐supply
shipment, or replacement personnel can be accepted at a POD during a deployment. The supported combatant commander specifies the EAD.
Latest arrival date (LAD): The LAD is the latest date when a unit, a re‐supply shipment,
or replacement personnel can be accepted at a POD to support the concept of operations. The EAD and LAD are used to describe a delivery window for transportation planning. Required delivery date (RDD): The RDD is the date when a unit, a re‐supply shipment, or replacement personnel must arrive at a POD and complete off‐loading to support the current of operations. Responsible command, transportation planners and the deploying forces use the RDD to determine critical interim dates, such as the date the unit must do the following: Depart the origin installation or home station. Arrive at the POE.
Arrive at intermediate support bases if necessary.
Arrive at the POD.
For crisis‐action planning, where time is a critical factor, the above definitions are still valid. However, the planning could involve plan development from scratch or modifiying an existing deliberate plan already developed. In either case, the requirement for a quick analysis methodology that can generate a feasible TPFDD is crucial.
Before closing this chapter, we should note that for inter‐theater operations, the concepts of a rail port of embarkation (RPOE) and a rail port of debarkation (RPOD) need to be added to POEs and PODs already mentioned. A RPOE and a RPOD are simply railyards where a mode change occurs between land and rail transportation modes.
Chapter III presents the tools that are used and extended to develop the DES for deployment planning.
3. THE MODELING ARTIFACTS
Section 3.1 of this chapter explains and justifies the reasons for using Java2TM as
the programming language of choice. Section 3.2 introduces the discrete event simulation library, Simkit, written in Java2TM. Section 3.3 introduces the reader to the basic concepts of a GIS system and, in particular, to the GIS system of choice, GeoKIT, used as part of the simulation. 3.1. THE PROGRAMMING LANGUAGE The programming language of choice for the proposed dissertation is Java2TM. 3.1.1. Java Features and Terms Introductory information on JavaTM features and terms can be found in Cornell and Horstmann (1999), Lewis and Loftus (2000), Narasimhan and Winston (2001) and Chapman (2000). More advanced material can be found in Cornell and Horstmann (1999 and 2000) and at www.javasoft.com.
3.1.2. Why Java2TM ?
For use on computers connected to the Internet, Java2TM programs run on a wide
variety of hardware platforms. They can be loaded dynamically via a network and provide features that facilitate robust behavior.
For applications that have nothing to do with networks, it is a truly completely object‐oriented programming language. One justification for our choice of Java2TM as
and Rioux, 2002). That is; the “...development methodologies of simulations for the purpose of analysis continue to transition from a procedural to an object‐oriented paradigm due to an attempt to obtain the premises of object oriented programming such as improvements in reliability and reusability.” Object‐oriented (O‐O) paradigm provides a consistent means of handling these problems by viewing the world as a set of autonomous modules that interact to solve a complex task, where each object is responsible for a specific part of the task. The O‐O paradigm simplifies computer programming tasks and promotes reusability (Joines and Roberts, 1999).
Another justification is that Java programs can work on multiple tasks simultaneously and automatically recycle memory. Moreover, Java programs are independent of the operating system (Narasimhan and Winston, 2001). The military usually employs different hardware and operating systems, and thus it would be useful to have models or simulations which can run on multiple platforms. Furthermore, the geographical information system and the simulation library used as part of this research are also both written in Java2TM.
3.2. SIMKIT
Following information on Simkit is mostly adapted from Buss (2001), Buss (2002), Buss and Sanchez (2002), Buss and Ruck (2004).
Simkit is an Application Programming Interface (API) for implementing Discrete Event Simulation (DES) models. It is written in Java2TM and runs on any
operating system with Java2TM installed. Simkit adopts DES as its fundamental world
view and does not directly implement other world views such as process/resource. Although this makes certain simple models slightly more complex, a pure DES world view provides more flexibility and modelling power than a pure process‐oriented world view. In particular, every model that can be represented in the process world view can also be represented in a pure DES world view; the reverse is not true. 3.2.1. Event List Implementation in Simkit All DES frameworks require an implementation of a Future Event List (FEL) to operate. Simkit implements a FEL in a class called simkit.Schedule that consists entirely of static methods and variables. Simkit attempts to hide the details of the FEL from the simulation modeller. Instead of directly placing events on the FEL, the programmer invokes the waitDelay() method on an instance of simkit.SimEntityBase.
When using Simkit as the basis for a Web Service, it becomes desirable to have multiple simulations running independently. As of version 1.2.14, there is the possibility of creating more than one FEL.
3.2.2. Starting and Stopping
The simulation run is controlled by the Schedule class, which also houses the FEL. Schedule initiates the run when there is a call to its startSimulation() method, which executes the FEL. Simulation continues executing until the FEL is empty. There are essentially four ways in Simkit by which this can occur: