G V
a r a .
.V? % ж Λ»#THE IMPACTS OF THE GULF WAR ON THE U.S.
DEFENSE INDUSTRY
A Thesis
Submitted to The Faculty o f Management and The Graduate School o f Business Administration o f
Bilkent University
in Partial Fulfillment o f the Requirements For the Degree o f Master o f Business Administration
By
Ömer Faruk GANTEN AR
Ankara,
Hb
3
-tM
Ί•
U6t
I certify that I have read this thesis and in my opinion it is fully adequate, in scope and in quality, as a thesis for the degree of Master of Business Administration.
Assoc. Prof. Can § im ^ M l^ A N
I certify that I have read this thesis and in my opinion it is fully adequate, in scope and in quality, as a thesis for the degree of Master of Business Administration.
Assist. Prof. Zeynep ÖNDER
I certify that I have read this thesis and in my opinion it is fully adequate, in scope and in quality, as a thesis for the degree of Ma.ster of Business Admini.stration.
Assist. Prof. Siiheyla ÖZYE.DIRIM
Approved for the Graduate School of Business Administration
4
ABSTRACT
The Impacts of the Gulf War on the U.S. Defense Industry
Ömer Faruk CANTENAR Faculty of Business Administration Supervisor; Asst. Prof. Dr. Zeynep ÖNDER
SEPTEMBER 2000
In this study, the military intervention of the U.S to the Gulf Crises is taken as a major event and the impact of this event on the U.S defense stocks is examined by using event study methodology. The sample includes thirty-nine defense firms selected from the U.S Department of Defense top contractors list. The analysis of the abnormal returns on these defense stocks shows that the U.S. military intervention to the Gulf crises affects these stocks significantly and positively both in the short-term and in the long-term. The univariate analysis indicates that stock returns of defense firms are affected differently from this war depending on their defense dependency and market value. There exists a positive relationship between defense dependency and abnormal returns of the defense firms, controlling for the size of the firm.
ÖZET
Körfez Savaşı’nın Amerikan Savunma Sanayine Etkisi
Ömer Faruk CANTENAR
İşletme Fakültesi
Tez Yöneticisi: Yrd.Doç.Dr. Zeynep ÖNDER
EYLÜL 2000
Bu çalışmada ABD'nin Körfez Krizi'ne askeri müdahalesi "makro" olay olarak ele alınmış ve bu makro olayın ABD savunma sanayi hisselerine etkisi "olay etki çalışması" (event study) yöntemi kullanılarak incelenmiştir. Amerikan Savunma Bakanlığının en büyük 100 savunma şirketi içinden seçilen 39 firma üzerinde yapılan inceleme sonucunda, Körfez Savaşı’nın ardından bu şirket hisselerinin kısa ve uzun dönemde positif ve belirgin bir getiri sağladıkları tesbit edilmiştir. Ayrıca, "Savunma bağımlılığı" (savuma gelirieri/toplam gelirler) fazla olan şirketlerin hisse senetlerinin getirisinin savunma bağımlılığı az olanların getirisinden daha fazla olduğu ve pazar değeri düşük olan savunma şirket hisselerinin yüksek pazar değerine sahip hisselere kıyasla daha fazla getiri sağladıkları ve her iki sonucunda, istatistiksel olarak belirgin olduğu gözlenmiştir.
A nahtar Kelimeler; Olay etki çalışması. Savunma Sanayii, Savunma Şirketleri, Savaş etkisi
ACKNOWLEDGEMENTS
I am grateful to my supervisor Asst. Prof. Zeynep ÖNDER for her direct support, guidance, and contributions throughout the preparation of this thesis.
I would also like to thank other committee members for their comments on the study. Finally, I would like to thank my family for their encouragement and patience during my M.B.A study.
TABLE OF CONTENTS ABSTRACT... i ÖZET... ii ACKNOWLEDGEMENTS... iii TABLE OF CONTENTS... iv LIST OF TABLES... vi
LIST OF HGURES... vii
CHAPTER I INTRODUCTION...1
CHAPTER II THE U.S. DEFENSE INDUSTRY, DEFENSE SPENDING AND THE GULF WAR... 3
CHAPTER m : LITERATURE REVIEW... 7
Market Efficiency...7
Event Studies... 9
Studies Examining the Impacts of Wars and Military Actions... 11
CHAPTER IV : METHODOLOGY AND DATA... 17
Hypotheses... 17
Methodology... 19
Identifying the event day, event window and estimation window.... 19
Selection of the firms which will be included in sample portfolio....21
Defining the abnormal returns...22
Market m odel...22
Market Adjusted Model...24
Buy and Hold Method (An Alternative Model)...25
The design of the testing framework for the abnormal returns... 26
D a ta ...26
CHAPTER V RESULTS...28
Market Model Results...28
Size effect... 34
Market Adjusted Model Results...38
Buy and hold method results...46
The Impact of DDR and Size on Returns of Defense Industry Stocks... 51
CONCLUSION... 53
BIBLIOGRAPY... 58
APPENDIX... 60
Chronology of the Gulf War... 61
Table 1 Defense Companies From the U.S. DoD Top 100 Contractors List...62
Table 2 Classification of Defense Firms With Respect to MVs and DDRs... 63
LIST OF TABLES
Table No. Name of the Table Pase
TABLE 3.1 SEVENTEEN POLITICAL EVENTS INVOLVING
MILITARY FORCE EXAMINED IN THE MC DONALD AND
KENDALL (1994) STUDY 13
TABLE 4.1 SUMMARY OF THE HYPOTHESES 19
TABLE 5.1 AVERAGE ABNORMAL RETURNS (AARs) OF DEFENSE
STOCKS FOR 20 DAYS AFTER THE GULF WAR (MARKET
MODEL) 29
TABLE 5.2 ACARs OF SAMPLE PORTFOLIOS (MARKET MODEL) 30
TABLE 5.3 ACARs COMPARISON AMONG THE DEFENSE
PORTFOLIOS (MARKET MODEL) 3 3
TABLE 5.4 ACARs OF SMALL FIRM PORTFOLIOS (MARKET
MODEL) 35
T.ABLE 5.5 ACARs OF LARGE FIRM PORTFOLIOS (MARKET MODEL) 36
TABLE 5.6 COMPARING ACAR OF SMALL AND LARGE MARKET
VALUE FIRMS (MARKET MODEL) 38
TABLE 5.7 ACARs OF SAMPLE PORTFOLIOS (MARKET ADJUSTED
MODEL) 39
TABLE 5.8 ACARs COMPARISON AMONG THE DEFENSE
PORTFOLIOS (MARKET ADJUSTED MODEL) 41
TABLE 5.9 ACARs OF SMALL FIRM PORTFOLIOS (MARKET
ADJUSTED MODEL) 43
TABLE 5.10 ACARs OF LARGE FIRM PORTFOLIOS (MARKET
ADJUSTED MODEL) 43
TABLE 5.11 COMPARING ACARs OF SMALL AND LARGE MARKET
VALUE FIRMS (MARKET ADJUSTED MODEL) 44
TABLE 5.12 ABHARs OF SAMPLE PORTFOLIOS (BUY AND HOLD
METHOD) 46
TABLE 5.13 ABHARs COMPARISON AMONG THE DEFENSE
PORTFOLIOS (BUY AND HOLD METHOD) 47
TABLE 5.14 ABHARs OF SMALL FIRM PORTFOLIOS (BUY AND HOLD
METHOD) 48
TABLE 5.15 ABHARs OF LARGE FIRM PORTFOLIOS (BUY AND HOLD
METHOD) 49
TABLE 5.16 COMPARING ABHARs OF SMALL AND LARGE MARKET
VALUE FIRMS (BUY AND HOLD METHOD) 49
TABLE 5.17 RESULTS OF REGRESSION 52
TABLE 6.1 SUMMARY OF THE RESULTS 54
LIST OF FIGURES
FIGURE 5.1 ACARs OF DEFENSE PORTFOLIOS AND MARKET INDEX ..32 FIGURE 5.2 ACARs OF SMALL AND LARGE DEFENSE PORTFOLIOS (market model)... 37 FIGURE 5.3 ACARs OF DEFENSE PORTFOLIOS
(market adjusted model)... 40 FIGURE 5.4 ACARs OF SMALL AND LARGE DEFENSE PORTFOLIOS (market adjusted model)... 45 FIGURE 5.5 ABI lARs OF SMALL AND LARGE DEFENSE PORTFOLIOS (buy and hold method)...50
INTRODUCTION
In the 1980s defense spending of the U.S. as percent of GNP reached the highest point after the Wold War II. The major motive for this high ratio was Soviet threat. Since the end of Cold War, the spending for the security has became a major issue which has taken too much criticism. The breakup of the Warsaw Pact, the collapse of the Soviet Union and “the definitive end of Cold War have led many governments to undertake substantial cuts in defense spending” (Bitzinger, 1994). After Cold War ended, the U.S. defense needs were seemed unclear. But it was believed that “Now it was safe to contemplate very substantial reduction in defense spending” (Brown and Stevens, 1992). What did this statement mean for the U.S. defense contractor firms? It means fewer sales to the U.S. Department of Defense (DoD) and less profit and less investment for the future defense related areas.
When international situation eases, there is a belief that the demand for military equipment will decrease. The decline in demand for these products and the government cuts in defense spending will shrink the market, weakening the defense firms. Therefore, the decrease in defense firms’ revenues and profits might create serious problems to the future performance of the firms in defense industry.
CHAPTER I
However, the break up of the Gulf War in January 1991 created new opportunities for the defense industry. International weapon sales of the U.S. defense
firms increased substantially after the war. Besides, defense companies gave contractor support for their products used in the war. Lastly, they took new orders to fill over reduced missiles and all kind of ammunition.
This study examines the impact of the Gulf War on the U.S. defense industry' stocks. Since this war created a chance for the defense firms to increase their future performance, this analysis also provides a test of market efficiency. If the market is semi-strong form efficient, investors will predict the improvements in the future performance of the defense-related firms and react positively. In the study, the U.S. military intervention to the Gulf Crises is taken as an exogenous macro event and whether defense firms are positively affected from this event is investigated by employing event study methodology. In addition, whether two firm characteristics, defense dependency and size, are important in explaining the impact of war is examined by using univariate and multivariate analyses.
An overview of the U.S. defense industry and the impacts of Gulf War on the industry are given in the next chapter. The third chapter discusses event study concept and presents the findings of similar war-related researches. The fourth chapter reports the hypotheses and describes the methodology and data used in the study. The fifth chapter presents the results of the empirical research. The last chapter gives an overall conclusion of the study and recommendations for the future researches in this area.
CHAPTER n
THE U.S. DEFENSE INDUSTRY, DEFENSE SPENDING AND THE GULF WAR
National defense is a very critical issue for many countries and it has no other alternatives. Defense spending takes a big share of gross national product (GNP) for the most countries. According to Stockholm International Peace Research Institute (SIPRI), total world military expenditure is roughly $780 billion for the year 1999. It represents a significant share of world economic resources: 2.6% of world GNP. The U.S. has the highest figure in defense expenditure with a share of 36% of the world defense spending (SIPRI Yearbook 2000).
Defense industry mostly requires sophisticated technology. That is why dollar amount of investment in the defense industry and the cost of products in that industry are extremely high. Since the United States is the world leader in military technology, the U.S. defense firms are the main suppliers for the U.S. Department of Defense (DoD) and for the most of the world.
Despite the high cost of the defense, the U.S. Defense Industry helped win the cold war. During the Cold War, the following policy was valid: “when it came to buying national security for the U.S, money was no object”. In addition to national security, the U.S. firms in the defense industry has applied their research and
development activity and their technology for the development of telecommunication and space activities (Augustine, 1997).
After the Cold War, the defense companies have confronted the loss of more than 50% of their market share and defense procurement has declined by more than 60% in constant dollars between 1989 and 1997 (Augustine, 1997). Therefore, defense dependency at corporate level increased the vulnerability of the company, its managers and its shareholders.
In 1990, while U.S. defense firms were seeking solutions to increase their weapon sales, the Persian Gulf War was started. During this war if the U.S. made weapons were used effectively, this would create an opportunity for the defense firms to sell their products internationally. They thought that the market for the U.S. weapons could expand since the other countries might decide to purchase these systems or increase the amount of their orders after seeing their effectiveness.
This expectation of the defense firms became reality. The superior performance of the U.S. weapons in the Persian Gulf War has increased foreign demand for them. According to Bitzinger (1994), in 1992, just one year after the Gulf War, American arms producers filled over $28 billion worth of overseas orders for military equipment while they were only $12 billion in 1991. Moreover, the U.S. arms transfer agreements reached $32 billion in 1993. Keller (1995) stated that in the year following Iraqi invasion of Kuwait, the U.S. negotiated $22.5 billion in arms sales to the Middle East alone. According to Jane’s Information Group estimates, the Gulf states ordered around $32 billion worth of military equipment from the U.S. in
Beaher (1994) states that the circumstances after the Gulf War caused a huge arms transfer into the region, boosting U.S. defense industries that fallen on hard times since the end of cold war. He also says that Gulf States not only did pay most of the costs incurred by the coalition allies in prosecuting the war, they also ordered huge amounts of weaponary for their military.'
The intensive use of high-tech weapons and systems was the key factor for success in Gulf War. A Nato official explains this intensity by saying that “In Desert Storm we were flying 1600 sorties a day”' (Momocco, Fulghum and Wall, 1999).
The expense of the total Gulf War, according to the DoD estimation, was $61 billion. The largest single expense of the war ($18 billion of this figure) was for the spare parts and contractor support. There were numerous technical teams and representatives in the Gulf from various companies such as Northrop Corp., Huges Aircraft Co., Martin Marietta Corp., and Gruman. They were working in the back shop of their weapon systems and supplying technical support in order to operate these systems more effectively (Zorpette and Glean, 1991:40-42).
’ For example, Kuwait rewarded all its allies with military equipment orders. After the war Kuwait Government separated $11.7 billion for this purpose over 12 years. The first order went to the U.S. in October 1992 when General Dynamics won the contract to build 218 M1A2 Abrams main battle tank for S I.8 billion. From United Kingdom Kuwait ordered 254 GKN defense Desert Warrior armoured fighting vehicles, worth $500 million.
Bahrain was also one of the buyers from U.S., FFG-7 frigates for Navy and M60A3 main battle tanks and Multiple Rocket Launcher System for Army. United Arab Emirates and Saudi Arabia ordered Aphache helicopters from McDonnell Dougles. Saudi Arabia has taken 315 M1A2 main battle tanks and has an option on another 150. Saudi Land Forces also bought 400 M2A2 Bradley vehicles, and ordered 1117 light armoured vehicles from General Motor (Beaher, 1994).
* The figures about the amount of ammunitions used in this war show this intensity as well; “In Gulf War 52(Ю0 air-to-surface sorties delivered approximately 210000 unguided bombs, 9300 guided bombs. 5400 guided air-to-surface missiles and 2000 anti-radar missiles; American forces also hurled more than 300 cruise missiles at the enemy." (Cohen, 1994; p. 110)
The total cost of all bombs and missiles used was $2.2 billion. Although 90 percent of the items dropped were unguided bombs, about 80 percent of the cost of all items dropped were guided bombs. The average cost of an unguided bomb was $2,057, while the average cost of a guided bomb was $31,918. Most of these bombs were produced by defense contractors (Dunnigan, 1996:135). The cost to fill the reduced inventory of these smart bombs and missiles was also high. Although these were costs for the DoD, they were the gains of its contractors.
Based on this discussion, three favourable situations for the U.S. defense industry after the Gulf War can be summarized as follows:
1. The superiority of the U.S. weapons in this war made U.S. defense firms to sell their products in international markets.
2. U.S. defense firms got the lion’s share from the Gulf War expenditure by selling spare parts and contractor support services for the U.S military. 3. They also got new orders of ammunitions, guided and unguided bombs
and missiles to the increase the lowered inventory of U.S. military.
All of them should lead to increa.se in stock price of these contractors because those are the conditions which will increase their revenues and expected profits, leading to increase in their future growth rates. If the market is efficient, it should anticipate this and react by increasing the stock prices of defense firms right after the beginning of the Gulf War.
CHAPTER III
LITERATURE REVIEW
In this chapter, first, the market efficiency concept and event study methodology are briefly summarized. Then, the outcomes of previous researches that examine the impact of the major events including military actions on the defense- related stocks are presented.
Market Efficiency
Many studies have been done to test empirically and to understand theoretically the efficiency of financial markets. By the term efficient security
market, financial economists mean a market where security prices are equal to the
present values of their future prospects, assuming that information is widely and costlessly available, all investors are good analysts and they adjust their holdings appropriately. In other words, in an efficient security market, stock prices fully reflect all available information that is relevant to the determination of values. So, in an efficient market, buying or selling of any security at the prevailing market price never results in a positive “net present value” (NPV) transaction (Brealey and Myers, 1996; Tini? and West, 1979).
Efficiency implies that investors coirectly anticipate the true expected returns (Lwellen and Shanken, 1998). If stock prices already reflect all predictable information, then stock price changes must reflect only the unpredictable. If all publicly available information is reflected so quickly in the security prices in an efficient market, investors can earn abnormal return in these markets only by chance.
In his seminar paper. Fama (1970) discusses three forms of market efficiency depending on the information reflected in stock prices: weak form, semi-strong form and strong form. According to him, weak-form efficiency implies that current prices reflect past prices, therefore past prices can not be used to predict future returns. Semi-strong form efficiency implies that security prices reflect all of the available public information. In strong-form efficient markets, even investors' private information are considered to be fully reflected in market prices. Since his study, many researchers have tested these three forms of efficiency for several financial markets. After 20 years, Fama (1990) renamed his three classifications ba.sed on the existent tests of three-forms of efficiency. These are: (1) Te.sts for return predictability, (2) Event studies, (3) Tests for private information. The first type of tests examines whether returns are predictable from past returns and dividend yields. The second type, event studies, tries to measure impacts of a particular event on stock returns by examining abnormal returns around the specific event. Finally, private information tests check whether corporate insiders have private information that is not fully reflected in prices. In this study, event study methodology is used. Therefore, it is explained in detail in the next section.
Event Studies
Fuller and Farrell (1987) define event studies as “studies which are concerned with measuring abnormal returns around the date of a particular tj'pe of event.” The main theme beyond the event study methodology is to assess the impact of firm specific or marketwide events on an individual firm, or an individual industry, or on the market as a whole. It is a test of semi-strong form efficiency assuming that these events are public information. The announcements of these events should be reflected in prices immediately in an efficient market.
Event study methodology was introduced by Fama, Fisher, Jensen and Roll (FTJR) (1969). According to Binder (1998), FFJR paper started a methodological revolution in finance, accounting and economics and "it has been widely used in these disciplines to examine security price behavior around events". Especially the introduction of powerful computers and the availability of the historical data accelerated their usage (Fama, 1990).
Event studies have been applied to a variety of firm specific and economy wide events. Some examples include mergers and acquisitions, earning announcements, issues of new debt or equity and announcements of macroeconomic variables such as inflation, economic growth or trade deficit (Mackinley, 1997).
In addition to the use of event study as a measure of market efficiency, Henderson (1990) stated two other uses of event studies; information value and metric explanation. As it was stated above, market efficiency studies try to measure
how quickly and correctly the market reacts to a particular type of new information. Information value studies try to find which company returns are affected from this new information. Metric explanation studies try to explain the metrics (extra returns) by dividing the sample into various samples and then investigating whether the unusual element of returns differed among subsamples.
Brown and Warner (1980, 1985) studied the usefulness of event studies with monthly, weekly and daily data. If an examined event is dated to a day, it is possible to get the precise measure of the stock price adjustment to this specific daily event. Therefore, event studies on daily returns can give a clear picture of the speed of adjustment of prices to related information (Fama, 1990).
Brown and Warner (1985) stated some problems in using daily returns. They found that these few problems could not present obstacles for daily data usage in event studies. Binder (1998:116) also supports this idea:
"These statistical problems are "solvable" in one way or another. Often many of the problems can simply be ignored, because, in practice they are quite minor."
Although there are several event studies examining the reaction of the stock prices to the company specific and macroeconomic events, becau.se of the nature of this study the next section summarizes only the literature about the impacts of events including military action on the stock prices of defense firms and the market as a whole.
Studies Examining the Impacts of Wars and Military Actions
Several studies have examined the effects of a wide variety of major events that affect all of the stocks ranging from wars to presidential elections. These events can be considered exogenous. For example, Niederhofler (1971) investigated the impacts of 432 world events, including natural disasters, military actions, legislative acts, election results and the deaths of prominent individuals. He studied the percentage changes in Dow Jones Industrial Average around these events. According to this study, market discriminated those events as good or bad. Niederhofler reported that the market overreacted to military events which were perceived to be bad, and then it readjusted in a positive direction.
Few studies have accounted for the possibility that stocks in different industries might respond differently to the same events. For example, Homaifar, Randolph, Helms and Haddad (1988) examined the effect of presidential elections on the stock returns of defense-related industries. Their findings supported the hypothesis that the defense industiy' stocks had significant excess returns after the election of a candidate supporting major increases in defense spending. The market thought that new administration would increase defense spending, causing above average earnings for companies that are suppliers to the Department of Defense. However, they also observed that defense-related stocks had statistically significant negative excess returns on the day following the election of Democratic presidents who generally pursued low defense spending policy.
Maloney and Mulherin (1998) investigated the impact of the Challenger crash on stock returns. They examined only returns on the stocks of the companies which
were either the makers of the shuttle or within the management of shuttle ground support. Surely, those companies were from defense industry; Rockwell International, Lockheed, Martin Marietta and Morton Thikol. They found significant support for market efficiency. They observed that the market defined the responsible party within minutes, which was Morton Thikol, although the government investigation took five months to find the real cause behind the explosion. After the crash news reached the market, shares of four firms decreased sharply. The stock prices of three firms were recovered in two months while Morton Thikol share price had the worst decline on the crash day, stayed relatively the same and did not recover in that two months period.
A few studies have examined the impact of wars or war-related events on determining the stock prices of defense firms. In defense industry literature, there is a common belief that wars cause decrease in general confidence levels and therefore stock market is affected negatively, but wars may also positively affect the stock prices of defense-related companies. According to the report by McDonald and Kendall (1994), in 1987, Billingsley, Lamy and Thompson found that war-related events had significant positive effects on the stock prices of defense industry firms but negative effects on the stock market as a whole.
McDonald and Kendall (1994) examined the impacts of several political events, involving some kind of military actions on the stock prices of companies that supplied war-related materials. They used a sample of 16 firms that provided military equipment to the Department of Defense during the time period surrounding the events under investigation. By calculating cumulative abnormal returns, the authors
examined short-term effects of seventeen political events involving military force on the stock returns of their sample of U.S. defense firms. These events can be seen in table 3.1. They found that as a result of the military actions in which one of the super-powers, U.S. or Soviet Union, was a participant, the stock prices of defense- related firms tended to ri.se. For those events where neither super-power was a participant, the results were not significant. Then, they concluded that the effect was driven by the super-power participation.
Table 3.1 Seventeen Political Events Involving Military Force Examined in the Me Donald and Kendall (1994) Study
Cuban Missile Crisis Gulf of Tonkin Incident Raids on Hanoi Six-Day War
Pueblo Incident Tel Offensive Czechoslovakia Invasion Mayaguez Incident Embassy Seizure Teheran Afghanistan Invasion US Rescue Attempt in Iran South Atlantic War Car Bomb US Embassy in Beirut Shoot Down of FLALOOV Bombing of Marine Barracks in Beirut Grenada Liberation Punitive Action in Libya
As it can be seen from the table 3.1, McDonald and Kendall (1994) have examined more general military events. Shapiro and Switzer (1999) restricted their analysis of major military events to actual wars. They took into account twenty-nine announcements related to five wars: the Vietnam War (1967-68), the Six Day War (1967), the Yom Kippur War (1973), the Falkland Island War (1982) and the Gulf War (1990-91). These announcements were not only war news but also peace announcements regarding to these conflicts. Their sample was from the list of the U.S. Department of Defense largest contractors and their sample size changed between 63 and 69 firms, depending on the event. Twenty-one of these announcements were related with the outbreak of war and eight of them were related
with the end of hostilities. They found thirteen positive defense portfolio returns for out of twenty-one war announcements and negative abnormal defense portfolio returns for six out of eight peace announcements. Therefore, the findings of previous studies that war-related events positively effect defense stocks were confirmed by Shapiro and Switzer. They also concluded that announcements of peace related events had a negative effect on defense stocks.
In the same study, Shapiro and Switzer (1999) extended their analysis to find whether some stocks in their portfolio were more responsive to war-related announcements than others. They examined three different properties of firms: a) the ratio of research and development expenditures to sales for each firm (RD), b) the ratio capital expenditures to sales for each firm (CE), c) the firm industry concentration ratio (CR). In the regression analysis, all these three variables assumed as independent variables in determining the cumulative abnormal returns (CAR) of each firm in the defense portfolio where CAR (-1, +1) is the CAR for the three days centred on the event day for each firm.
R&D ratio is chosen as a measure of technical complexity of the company and its capability in producing high-tech superior goods. They expect that firms with higher levels of R&D expenditures should have higher CARs. Then, coefficient on RD is hypothesized to be positive. According to Shapiro and Switzer, defense firms with high levels of capital spending could loose their bargaining advantages against the government. Then, the market would consider stocks of firms having above average levels of capital spending would have lower abnormal returns. Therefore, the coefficient on CE is hypothesized to be negative. The firm concentration ratio is a
kind of measure showing the degree of market power held by firms in that industry. Because of the absence of enough competition, firms would have bargaining advantages in markets where a few firms have large market shares. So, the abnormal returns of those firms' stocks are expected to be higher leading to the hypothesis that coefficient on CR is positive.
After running the OLS regression model for the event of Gulf War, they found that RD and CR coefficients were positive and statistically significant at 5% and CE coefficient was negative at the 10%. This means that a defense firm’s technical complexity and its degree of market power are positively related while its bargaining power is negatively related with the cumulative abnormal return of the firm’s stock (Shapiro and Switzer, 1999).
Shapiro and Switzer’s study could be criticized because of the events that they investigated. From six war-related events, only two of them were directly related with the U.S. So, the impact of other four wars on the U.S. defense stocks may be indirect. For example, Falkland War was mainly related with British military while Yom Kippur and Six-Day wars were related with other militaries. Besides, their study did not examine the long-term impacts of these wars on the defense stocks and they used market model in their investigations.
This study tries to seek evidence for the conclusion of previous researches by examining the response of defense contractors’ stocks around the event of Gulf War. Previous researchers u.se market model and examine for a very short term CARs in their studies. This research, by applying three methods, investigates the short and
long term effects of Gulf War on defense stocks. In addition, the impacts of two characteristics of the defense firms, the ratio of defense sales to total sales (defense dependency ratio -DDR) and the market value (MV), on their stock returns are examined. The next section presents the methodology and data used in this analysis.
METHODOLOGY AND DATA
This chapter presents the hypotheses tested, the methodology, and data used in this thesis. First, the hypotheses are discussed. Second, the event day, event window and estimation period are described. Third, the construction of the sample is presented. Then, three methods, market model, market adjusted model and buy and hold model, used in calculating abnormal returns are explained.
Hypotheses
The first hypothesis tests the validity of the finding of previous studies, defense stocks react positively to the war-related events, for the Gulf War. Hence,
the first null hypothesis states that defense-related stock prices do not react positively
to U.S military intervention to Gulf Crises. In other words, the average cumulative abnormal return (ACARi) is hypothesized to be less than or equal to zero on and after the event day (ACAR, < 0 for all t > event day).
This study extends the analysis in order to find whether some defense related firms are more responsive to the event under question. Defense dependency and size are chosen as two factors that might affect the abnormal returns of the defense stocks
after the event day.
CHAPTER IV
It can be argued that the stocks of high defense dependent firms would be affected more relative to the stocks of low defense dependent firms from the Gulf War. Hence, the second null hypothesis states that returns of high defense dependent firms are not higher than the returns of low defense dependent firms.
There are several studies which examine size effect in stock markets. Dimson and Marsh (1986) state that size effect, “t/ic tendency for small capitalization stocks
to outperform their larger counterparts ”, is the one of the most important regularity
so far observed. They also restate the findings of others that, "an event study which focuses on a smaller (larger) firms is likely to witness positive (negative) abnormal returns relative to the market index.” So, the third null hypothesis states that the stocks of small sized defense firms do not have higher abnormal returns than those of large firms.
Lastly, the fourth null hypothesis states that defense dependency of a firm is not positively related with the abnormal returns of its stock, controlling for market value (size of the firm). Table 4.1 presents the summary of these hypotheses.
Table 4.1 Summary of the Hypotheses
Hypotheses____________________
H o i: Defense stocks do not react positively to the beginning of Gulf War. H a l: Defense stocks react positively to the beginning of Gulf War.
Ho2; Returns of high defense dependent firms’ stocks are not higher than those of low defense dependent firms’ stocks.
Ha2;Returns of high defense dependent firms’ stocks are higher than those of low defense dependent firms’ stocks.
Ho3; Abnormal returns of small sized defense firms’ stocks are not higher than those of large defense firms’ stocks.
Ha3; Abnormal returns of small sized defense firms' stocks are higher than those of large defense firms’ stocks.
Hq4 ; There is not a positive relation between defense dependency and abnormal returns of the firms, controlling for the size of the firm.
Ha4; There is a positive relation between defense dependency and abnormal returns of the firms, controlling for the size of the firm.________________________
Methodology
In this study, event study methodology is used in order to examine the impact of the Gulf War on the U.S. defense industry stocks. There is no unique structure for event studies. However, Mackinley (1997) specifies the following well-defined series of steps which are used in this study as well;
1. Identifying the event day, event window and estimation window. 2. Selection of the firms which will be included in the sample portfolio. 3. Defining the abnormal returns.
4. The design of the testing framework for the abnormal returns.
Identifying the event day, event window and estimation window
The U.S military preparations in the Gulf started right after the Iraq’s invasion of Kuwait on August 2, 1990. At the beginning, the aim of the U.S. military
deployment was to deter the Iraqi government to enlarge their invasion to Saudi Arabia and the other Gulf countries. When Iraqi government did not take any back steps, the U.S. military accelerated their preparations starting on October 31, 1990 to force the Iraqi military to withdraw from Kuwait. On November 29, 1990, the United Nation (U.N.) Security Council authorized the use of “all means necessary” to eject Iraq from Kuwait. During this time period political efforts were continuing to convince the Iraqies to leave Kuwait territory. At the begining of January 1991, there was uncertainty about how this conflict would be solved. The U.S. military was ready for the attack in the middle of the January and the deadline to leave Kuwait, 15 January, set by the U.N. was about to come. The U.S. Congress authorized the use of force on January 12, 1991. The ambiguity existed until 17 January, the first day of the Allied military intervention. Therefore, the begining date of the Gulf War, 17 January, is considered as the event day in this study.The chronology of events related to the Gulf War is presented in the appendix.
The event window is the period in which the security prices of the firms are involved in the event. The event window is defined as 253 days which include the event day (intervention day) and 252 days (one year) after the intervention.
The estimation window is the period in which required parameters are estimated to calculate the expected returns in event window. Generally, the estimation window is the period prior to the event window. The event period is not included in the estimation period to eliminate any impact on parameter estimates. However, there is no consensus about the length of estimation period. For example. Brown and Warner (1985) used first 239 days of their 250-day event period as
estimation window. Dyckman et al. (1984) used the days between -120 and -60 days before the event and days between +60 and +120 after the event to calculate the parameter estimates. Mackinley (1997) employed a 41 -day event window, comprised of 20 pre-event days, the event day, and 20 post-event days. He used 250 trading day period prior to the event window as the estimation window. In this study, the estimation window is taken as a year (250 days) which ends 20 days before the event day.
Selection of the finns which will be included in sample portfolio
The firms used in this study were chosen from defense-related industries. The list of the Department of Defense (DoD) top 100 contractors receiving the largest dollar volume of prime contract awards for the year 1990 was used in determining the sample. The companies in this list vary greatly in terms of their dollar amounts of DoD prime contracts they received and their total sales.
Among top 100 firms, only firms that were publicly traded in the U.S. stock markets are examined in this study. The data about only fifty-nine firms out of 100 firms are obtained. Then, the firms that had defense dependency ratio above 5% are included in the sample, reducing the sample size to thirty-nine firms. It is assumed that 5% defense dependency is a critical level in identifying the defense dependent
firms.
The abnormal return is the difference between the actual return and the expected return of the security over the event window. In this study, the abnormal returns are calculated using three methods. First, market model is employed. Then, market adjusted model is used. Lastly, holding period returns are calculated. Abnormal returns can be also calculated using mean adjusted return model. However, according to McDonald and Kendall (1994) mean adjusted return model tended to give positively biased results in the presence of cross-sectional clustering. As all of the firms in the sample are within similar industries, cross-sectional clustering is expected. Therefore, this method is not used in the study.
Daily returns are found by using log form as follows: Ri, = log (price, /price,.])
Market Model
This model assumes that there is a stable linear relationship between the market return and the security return. It is a statistical model which relates the return of any given security to the return of the market portfolio. This method considers the risk of the stock and the movement of the market during the event period. Henderson (1990) states that it is simplest to use and it gives similar results like the more complicated approaches. The expected return (E(Rj,)) and abnormal return (ARi,)on stock i on day t are defined as follows:
E(Ri,)=(Oi -hPiRm.) ARi, = Ri, - (Oi + PiRin.)
D efining the abnormal returns
where Rjt is the daily rate of return on security / for day t, and R,n, is the market return (S&P 100 index) for the day t. The coefficients ttj and Pi are ordinary least square estimates of the intercept and slope which are calculated using an estimation period for all the securities in the sample. It is assumed that during the estimation and the analysis periods, beta coefficients of the related stocks did not change. R~ of the.se regressions are presented in table 3 in the appendix.
Abnormal returns are calculated for each security and for each day in the event period time frame. Then, by adding these daily abnormal returns, cumulative abnormal returns (CARs) for each stock in the sample are computed using the time frame from first day of the military intervention to 252 trading days after the intervention. Therefore, CARj, could be defined as
I
CAR„= X aR,,
k=0
The average cumulative abnormal return (ACAR) on a day t for n securities is defined as
n
ACARf Y ^C A R Jn /=)
where CARj is the cumulative abnormal return for the ith security until day t starting from the event day, and n is the number of firms in the sample portfolio.
Although Brown and Warner (1980,1985) found that more elaborate modelling and test statistics were not .superior to the market model in detecting abnormal performance, there are some shortcomings of the market model. First, in the estimation of betas, the strength of the market model is very much related to the quality of OLS regression. The efficiency of the market model is highly related to the
R“ of the market regression. "The higher the R^, the greater is the variance reduction of the abnormal return, and the larger is the gain" (Mackinley, 1997). In the event study literature the researchers rarely reported the R" of their regressions. This leads us to think that the quality of R^ s was ignored in most of the event studies using market model. Low R‘ values obtained for 39 firms in the sample (table 3 in the appendix) show that the regression models are not so powerful in estimating the expected returns.
Second, since the firms in the sample are from related sectors and the event day is the same for all these firms’ .stocks, using market model could give biased results because of the event clustering. Third, this major event could have changed the parameters of the market model for each stock. Then, using the coefficients estimated for the pre-event period may not be appropriate. Because of the above limitations of the market model, market adjusted model and buy and hold method are also used in order to calculate abnormal returns.
Market Adjusted Return Model
According to this method, the expected firm return on stock is equal to the market return for that period. To find the abnormal return (ARj,), market return (Rjn,) is subtracted from actual return (Ru) of individual firm.
E(Rii)= Rmt A R it = R i t " Rmi
Buy and Hold Method (An Alternative Model)
Conrad and Caul (1993) argued that by cumulating short-term returns over long periods, strategies that used CARs cumulated not only the “true” short-term returns but also upward bias in each of the single-period returns. In order to eliminate this bias, they suggested that abnormal returns used in the event studies should be substituted by holding period returns. Especially, to measure the long-term performance, buy and hold method could be an alternative method, because this measure has the additional advantages of minimizing transaction cost and reducing the statistical biases in cumulative performance measures. Therefore, as a third methodology in this study, the holding period returns of portfolios are also calculated and the results are compared with those of previous models.
For one-year holding period returns of the sample portfolios, first, the holding period return of each security in the portfolio is calculated. In order to calculate the buy and hold abnormal performance (BHARjt) with respect to the market index, holding period returns of market portfolio (BHR„„) are subtracted from the holding period returns of the sample firms (BHRj,). Then, the average buy and hold abnormal returns (ABHAR) are computed for each sample portfolio as follows:
BHARi,= BHRi, - BHR,m n
ABHARf Y^B H A R Jii
/=1
In event studies, after calculating the abnormal returns for each stock and aggregating them, the cumulative abnormal returns should be tested in order to determine whether there is any change on the returns because of the event. In this study, the four null hypotheses are tested using three statistical methods. T-test, two- sample means test and one-way ANOVA are used to te.st the first three hypotheses. A regression model is estimated for the last hypothesis.
The design o f the testing framework fo r the abnormal returns
Data
Adjusted daily stock prices, net sales and market values of thirty-nine firms over the period analyzed are obtained from databases maintained by Datastream Inc. Data related to military sales are obtained from the DoD top 100 contractor list for
1990.
The firms in the sample were classified in three categories according to their defense dependency ratios (the ratio of military sales to total sales-DDR). This ratio is used in order to determine the defense intensity of each firm. Similar procedure is used by Mayer and Roshwalb (1986) in order to identify defense dependency of firms. Thirteen firms were included in each category. The first portfolio includes heavily defense dependent firms that have at least 30 % of their sales to DoD. The second group consists of firms that have defen.se dependency ratio between \A%- 30%. The remaining 13 less dependent firms, having defense dependency ratio
between 5%-14%, are included in the group. The mean DDRs of these three defense portfolios are 49%, 17%, and 8% respectively. Table 1 in the appendix shows the list of these firms with their military sales and defense dependency ratios.
In addition to this major classification based on defense dependency ratios, the firms in the sample divided into two groups according to their market values as large and small firms in order to examine the size effect. The “large” portfolio consists of the first 20 firms with the highest market value. The rest is included in the “small” portfolio. The mean market values of these small and large portfolios are S345 million and $3106 million dollars respectively. Table 2 in the appendix presents the classification of the sample firms with respect to their market values and defense dependency ratios.
CHAPTER V
RESULTS
Market Model Results
In this section, the short-term and the long-term impacts of the Gulf War on the stock prices of firms in the U.S. defense industry are examined by using ACARs of stocks where abnormal returns are calculated using market model.
First, average abnormal returns (AARs) of sample portfolios are calculated. Then, ACARs of sample portfolios are examined for different time horizons ranging from one day to one year. The AAR values of all stocks and three DDR portfolios in 20 days surrounding the event day are shown in table 5.1. In preparing this table stocks in the sample are placed into three portfolios according to their defense dependency ratios (DDRs). Portfolio 1 includes the firms with the highest DDR as mentioned in the previous chapter, i.e., the ratio of defense sales to their total sales is more than 30%. Portfolio 2 includes the firms with moderate DDRs (14% and 30%). Similarly, portfolio 3 consists of the firms with the lowest DDRs (5% and 14%). As it is seen from the Table 5.1, the size of the three portfolios are the same. All include 13 defense firms. AARs and test statistics of all stocks and three portfolios are presented in Table 5.1 as well.
No significant AAR is observed on the event day and the day after the start of Gulf War for all stocks and for the three portfolios (table 5.1). However, the portfolio including all stocks has significant AARs on the days 2,1, 12 and 13. Portfolio 1, the highest defense dependent firms, has significant AARs, on the days 2, 3 and 13. Table 5.1 - AVERAGE ABNORMAL RETURNS (AARs) OF DEFENSE STOCKS FOR 20 DAYS AFTER THE GULF WAR (market model)
Days Alt stocks Portfolio 1 portfolio 2 portfolio 3
Size 39 13 13 13
DDR >5% >30% 14%-30°/ 5%-14%
Time AARs t value AARs t value AARs t value AARs t value
0 1 2 3 4 5 6 7 8 9 10 11 12 13 14 15 16 17 18 19 20 0.000 0.002 0.012* * * 0.003 0.001 -0.002 0.002 0.004** 0.003 0.001 0.000 0.001 0.008** 0.004** 0.002 0.000 0.004 0.000 0.000 0.000 -0.003 0.07 0.002 0.50 -0.001 -0.14 -0.002 -0.60 0.78 0.005 1.06 0.001 0.26 0.000 0.11 3.85 0.032*** 6.53 0.005 1.18 0.000 0.06 1.44 0.010** 2.23 0.001 0.22 0.000 -0.17 0.45 0.000 0.10 0.000 -0.17 0.001 0.38 -1.13 -0.005 -1.57 0.000 -0.02 0.001 0.35 0.92 0.003 1.10 0.000 0.24 0.001 0.28 2.03 0.003 0.68 0.004** 2.39 0.004 1.41 1.57 0.008** 2.71 -0.001 -0.24 -0.001 -0.90 0.39 0.004 1.15 -0.006 -0.83 0.004 1.16 0.18 -0.006** -3.22 0.007 1.13 0.001 0.61 0.51 0.001 0.43 0.001 0.45 0.000 0.18 2.43 0.011 1.50 0.007 1.07 0.004* 1.87 2.34 0.011** 2.56 0.002 0.84 0.000 -0.04 1.09 0.007 1.26 -0.001 -0.51 0.001 0.30 -0.21 -0.004 -1.26 -0.002 -0.63 0.006* 2.11 0.95 0.001 0.20 0.010 0.94 -0.002 -0.58 0.21 0.002 0.37 0.004 0.93 -0.003 -0.99 0.01 0.004 0.88 0.000 -0.10 -0.001 -0.53 -0.18 0.003 0.51 -0.002 -0.61 -0.005 -1.75 -1.97 -0.002 -0.97 -0.004 -1.57 -0.002 -0.69
·. " , and *'* indicate a ieveis at 0.10, 0.05 and 0.01, respectively
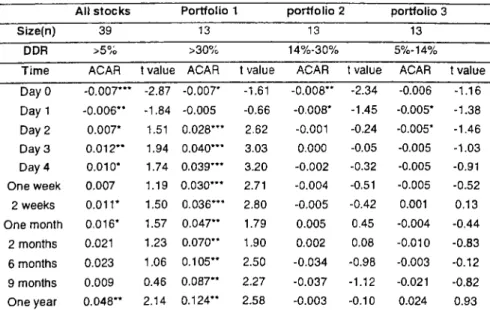
Table 5.2 presents the calculated ACARs for the specific time periods. The ACARs of all stocks are all significant for the time periods after the day 1. Since t values of ACARs are statistically significant, the null hypothesis stating defense stocks do not react positively to the beginning of Gulf War is rejected both in the short term and in the long term. Supporting the previous studies, defense stocks are found to be reacting positively to the start of Gulf War.
Table 5.2
All stocks
Portfolio 1 portfolio 2 portfolio 3 Size(n) 39 13 13 13
DDR >5% >30% 14%-30% 5%-14% Time period ACAR t value ACAR t value ACAR t value ACAR t value
Day 0 0.000 -0.02 0.002 0.50 -0.001 -0.14 -0.002 -0.60 Day 1 0.002 0.59 0.007 0.97 0.001 0.11 -0.002 -0.30 Day 2 0.014** 2.79 0.039** 3.57 0.006 0.87 -0.001 -0.37 Day 3 0.018** 2.88 0.049** 3.67 0.006 0.91 -0.002 -0.45 Day 4 0.018** 2.94 0.050*** 4.03 0.006 0.78 -0.001 -0.15 One week 0.017** 2.79 0.044*** 3.88 0.006 0.71 0.000 -0.01 2 weeks 0.026** 3.55 0.058*** 4.47 0.010 1.00 0.009 0.91 One month 0.044** 3.60 0.088** 3.14 0.032** 2.18 0.012 0.96 2 months 0.055** 2.86 0.118** 2.81 0.037 1.19 0.009 0.64 6 months 0.085** 3.10 0.182** 3.11 0.033 0.82 0.039 1.34 9 months 0.091** 2.83 0.184** 2.84 0.058 1.00 0.032 0.91 One year 0.146** 3.72 0.251*· 3.26 0.110* 1.52 0.078* 1.71
, and *** indicate a levels at, 0.1, 0.01 and 0.001 respectively
The ACAR of portfolio 1 is found to be 3.9% with a significant t value on day 2. The ACARs of this portfolio are increasing over time. For example, ACARs of portfolio 1 are 8.8%, 18.2% and 25.1% for one month, six-month and one year after the event, all of them are significant at 1 percent. Since there is no significant positive abnormal return on the event day and one day after the event day, the market can be considered to be reacting a little bit late to the event. However, starting from the second day, they predict the future growth opportunities in the defense-related stocks.
The ACARs of portfolio 2 are significant one month and one year after event day which is 3.2% and 11% respectively. Portfolio 3 has negative returns after the event until day 4, but they are not significant. The only significant ACAR is observed one year after event day which is 7.8% for the portfolio 3. The results suc^sest that market did not react positively for stocks with lower defense dependency. These differences among the portfolio returns imply that the impact of the Gulf War is immediate and more on the highest defense dependent stocks.
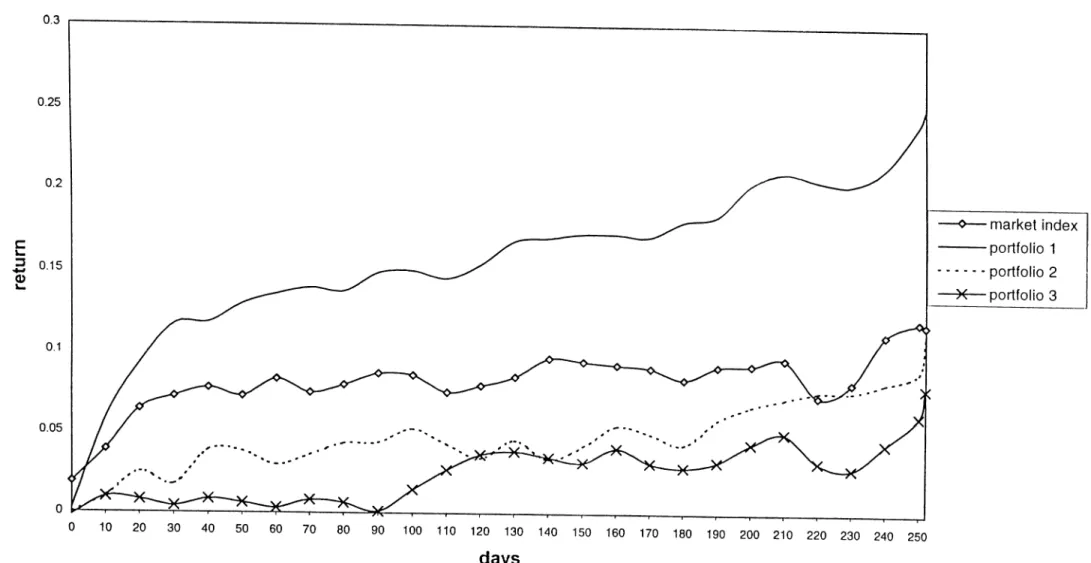
Figure 5.1 presents long term (one calendar year-252 trading days) ACARs of the three DDR portfolios. As it can be seen from this figure, the highest defense dependent portfolio (portfolio 1) has the highest returns comparing to other portfolios. So, supporting the ACARs in the table, it seems that the impact of the Gulf War is more on the highest defense dependent stocks both in the short-term and in the long term than on the lower defense dependent stocks.
In order to test whether the ACAR values of the three portfolios are different in the short-run (one week) and long-run (one year), one-way analysis of variance lANOVA) is employed. The null hypothesis that ACARs of all portfolios are equal is tested against the alternative hypothesis that the ACARs of portfolios differ for at least two of the portfolios.
Ho · ACAR portfolio 1 ~ ACAR ponfoiio2 ~ ACAR ponfoiio.s H a: The ACARs differ for at least two of the portfolios
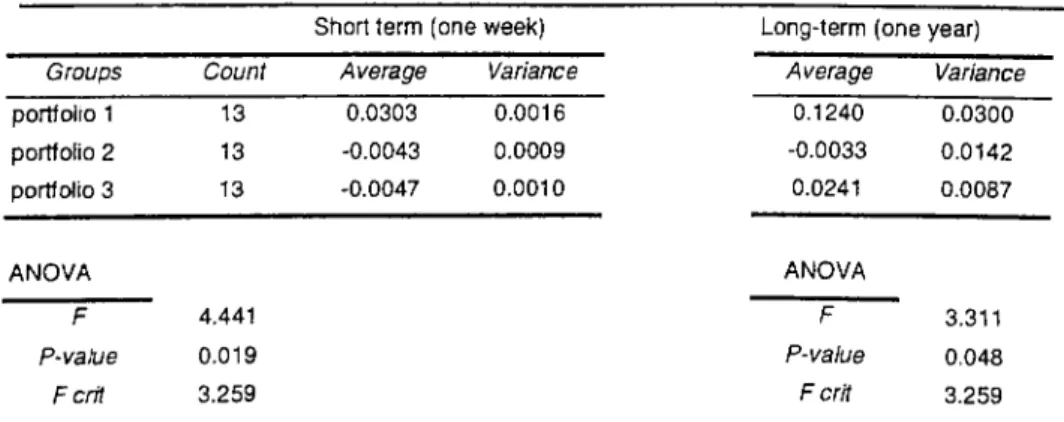
The Table 5.3 panel A shows the results for this hypothesis testing both in short-term and long-term ACARs for different portfolios. According to these results, the null hypothesis is rejected in the short term. However, this hypothesis may not be rejected in the long run, because the long-term returns on portfolio 2 and portfolio 3 are very similar to each other compared to returns on portfolio 1 (10.98%, 7.75% versus 25.06%). Therefore, whether there is any difference between the highest defense dependent firms (portfolio 1) and the lowest defense dependent firms (portfolio 3) ACAR values is tested for short-term and long-term. The null hj'pothesis that portfolio 1 ACAR and portfolio 3 ACAR are equal is tested against the alternative hypothesis that portfolio 1 ACAR is greater than portfolio 3 ACAR.
Panel A. Results of One-way Analysis of Variance
Table 5.3 ACARs Com parison Am ong the Defense Portfolios (m arket m odel)
Short term (one week) Long-term (one year) Groups Count Average Variance Average Variance portfolio 1 13 0.0441 0.0017 0.2506 0.0769 portfolio 2 13 0.0058 0.0009 0.1098 0.0683 portfolio 3 13 -0.0001 0.0006 0.0775 0.0267 ANOVA ANOVA F 7.147 F 1.920 P-value 0.002 P-value 0.161 F crit 3.259 F crit 3.259
Panel B. Comparing ACAR of the Highest and the Lowest Defense Dependent Firms________________________________________
Short term (one week) Portfolio 1 Portfolio 3
Mean 0.044 0.000 0.251 Vanance 0.002 0.001 0.077 tStat 3.466’ ** 2.982^
** indicates a at 0.01 level
Long-term (one year) Portfolio 1 Portfolio 3
0.078 0.027
Ho ■ ACAR portfolio I ■ ACAR portfolio — 0 H a; ACAR portfolio i * ACAR portfolio .t > 0
Table 5.3 panel B presents the results of this hypothesis testing. The null hypothesis is rejected in the short term and long term. Therefore, it might be concluded that sufficient evidence exist to infer that the ACARs of the highest defense dependent firms (portfolio 1) are more than ACAR of the lowest defense dependent firms (portfolio 3) in the short-run and in the long-run.
These results confirm the finding of previous studies that military intervention positively affects defense stocks in the short-run. Moreover, its positive effect is observed in the long run. Market believes that military intervention will increase the defense spending and increase in defense spending affects the future
sales of the defense companies, resulting increased future earnings for these firms. Then, investors anticipate this increase and they reflect their expectations on these stocks’ prices. This is consistent with the market efficiency concept. Moreover, the findings indicate that the stocks of firms with the highest defense dependency ratios provides the highest ACARs, suggesting that these firms affected most from this war.
Size effect
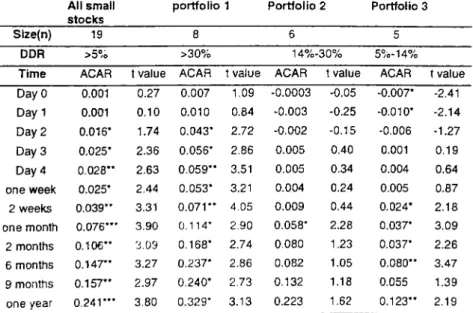
The firms in the sample are divided into two groups, large and small and their ACARs are calculated separately. Table 5.4 summarizes the average abnormal returns of the small firms calculated using market model. As observed for all stocks, small stocks have significant average cumulative abnormal return for all periods after day 2. When small stocks in different defense dependency categories are examined, these results seem to be mainly driven by the highest defense dependent stocks. Portfolio 1 (small and DDR >30%) has significant returns beginning from the day 2 (day 2 ACAR is 4.3%). The abnormal returns of portfolio 1 are increasing over time. After one month, six months and one year from the event day, ACAR values for portfolio 1 are 11.4%, 23.7% and 32.9% re.spectively and all are significant. Portfolio 2 and portfolio 3 have lower ACARs than ACARs of portfolio 1. Both portfolios’ ACARs are even negative on the event day, day 1 and day 2. For portfolio 3, these ACARs are statistically significant. However, one month after the event, the ACAR of portfolio 2 increases to 5.8% with a significant t value and portfolio 3 has sisnificant ACARs such as, 2.4%, 3.7%, 8% and 12.3%, for the periods two weeks, one month, six month and one year after the event day.
Table 5.4 ACARs OF SM A LL FIRM PORTFOLIOS (m arket model)
All small stocks
portfolio 1 Portfolio 2 Portfolio 3 Slze(n) 19 8
DDR >0% >30% 14%-30% 5%-14%
Time ACAR t value ACAR t value ACAR t value ACAR t value Day 0 Day 1 Day 2 Day 3 Day 4 one week 2 weeks one month 2 months 6 months 9 months one year 0.001 0.001 0.016* 0.025* 0.028** 0.025* 0.039** 0.076*** 0.106** 0.147** 0.157** 0.241*** 0.27 0.10 1.74 2.36 2.63 2.44 3.31 3.90 3.09 3.27 2.97 3.80 0.007 0.010 0.043* 0.056* 0.059** 0.053* 0.071** 0.114* 0.168* 0.237* 0.240* 0.329* 1.09 0.84 2.72 2.86 3.51 3.21 4.05 2.90 2.74 2.86 2.73 3.13 -0.0003 -0.003 -0.002 0.005 0.005 0.004 0.009 0.058* 0.080 0.082 0.132 0.223 -0.05 -0.25 -0.15 0.40 0.34 0.24 0.44 2.28 1.23 1.05 1.18 1.62 -0.007* -0.010* -0.006 0.001 0.004 0.005 0.024* 0.037* 0.037* 0.080** 0.055 0.123** -2.41 -2.14 -1.27 0.19 0.64 0.87 2.18 3.09 2.26 3.47 1.39 2.19 *, **, and *** indicate a levels at 0.05, 0.01 and 0.001 respectively
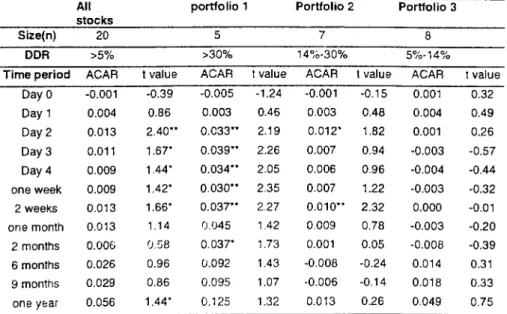
Table 5.5 reports the ACARs of large firm portfolios. The ACARs of large firm portfolios are found to be low comparing to small firm portfolios. The ACARs of large stocks are significant for the periods between day 2 and two weeks. They are also significant one year after the event. Although large and highly defense dependent firms (portfolio 1) have significant ACARs on day 2, day 3, day 4, one week, two-week and two months, their ACAR values are not found to be significant for the other time periods. Portfolio 2 has only significant ACAR on day 2 and two weeks after the event day while portfolio 3 do not have any significant returns. These results mean that the impact of Gulf War for the large defense dependent firms is significant in short term. Although long-term ACAR is significant for all large stocks, it is smaller, 5.6%, compared to the ACAR for small stocks, 24.1 %.
Table 5.5 ACARs O F LARG E FIRM PO RTFOLIOS (m arket model)
All stocks
portfolio 1 Portfolio 2 Portfolio 3
Size(n) 20 8
DDR >5% >30% 14%-30% 5%-14°/
Time period ACAR t value ACAR t value ACAR t value ACAR t value Day 0 Day 1 Day 2 Day 3 Day 4 one week 2 weeks one month 2 months 6 months 9 months one year -0.001 0.004 0.013 0.011 0.009 0.009 0.013 0.013 0.006 0.026 0.029 0.056 -0.39 0.86 240 -1.67* 1.44’ 1.42* 1.6 6* 1.14 0.58 0.96 0.86 1.44* -0.005 0.003 0.033** 0.039** 0.034** 0.030** 0.037** 0.045 0.037* 0.092 0.095 0.125 -1.24 0.46 2.19 2.26 2.05 2.35 2.27 1.42 1.73 1.43 1.07 1.32 -0.001 0.003 0.012* 0.007 0.006 0.007 0.010* * 0.009 0.001 -0.008 -0.006 0.013 -0.15 0.48 1.82 0.94 0.96 1.22 2.32 0.78 0.05 -0.24 -0.14 0.26 0.001 0.004 0.001 -0.003 -0.004 -0.003 0.000 -0.003 -0.008 0.014 0.018 0.049 0.32 0.49 0.26 -0.57 -0.44 -0.32 -0.01 -0.20 -0.39 0.31 0.33 0.75 *, and ” , indicate a levels at 0.10, and 0.05 respectively
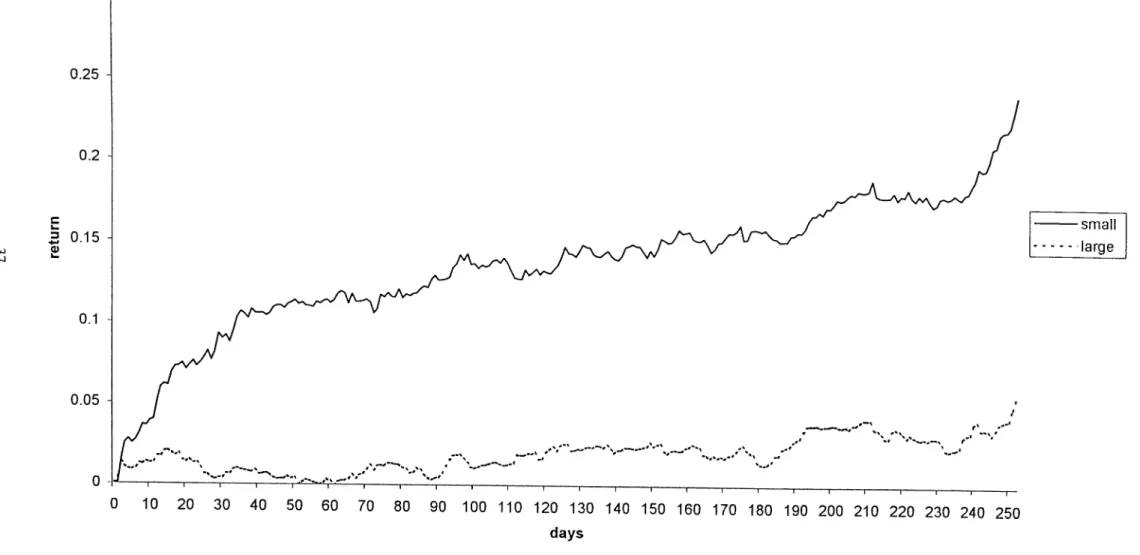
The difference between the ACARs of large and small firms is apparent in figure 5.2 as well. This figure also indicates that the returns of small defense firms are higher than the returns of large defense firms.
In order to test the difference between large and small firms’ ACAR values for short-term (one week) and long-term (one-year) time periods, t test is employed. The third null hypothesis stating that ACARs of small defense firms’ stocks are not higher than those of large defense firms’ stocks is te.sted.
Ho ; ACARS(small firms) " ACARS(|arge firms) — 0 Ha · ACARS(sniall firms) " ACARS(i arge firms) > 0