ORIGINAL PAPER
Opposing roles of the aldo-keto reductases AKR1B1
and AKR1B10 in colorectal cancer
Betul Taskoparan1&Esin Gulce Seza1&Secil Demirkol2&Sinem Tuncer1&Milan Stefek3& Ali Osmay Gure2&Sreeparna Banerjee1
Accepted: 31 August 2017 / Published online: 19 September 2017 # International Society for Cellular Oncology 2017
Abstract
Purpose Aldo-keto reductases (including AKR1B1 and AKR1B10) constitute a family of oxidoreductases that have been implicated in the pathophysiology of diabetes and can-cer, including colorectal cancer (CRC). Available data indicate that, despite their similarities in structure and enzymatic func-tions, their roles in CRC may be divergent. Here, we aimed to determine the expression and functional implications of AKR1B1 and AKR1B10 in CRC.
Methods AKR1B1 and AKR1B10 gene expression levels were analyzed using publicly available microarray data and ex vivo CRC-derived cDNA samples. Gene Set Enrichment Analysis (GSEA), The Cancer Genome Atlas (TCGA) RNA-seq data and The Cancer Proteome Atlas (TCPA) proteome data were analyzed to determine the effect of high and low AKR1B1 and AKR1B10 expression levels in CRC patients. Proliferation, cell cycle progression, cellular motility, adhe-sion and inflammation were determined in CRC-derived cell
lines in which these genes were either exogenously overexpressed or silenced.
Results We found that the expression of AKR1B1 was unal-tered, whereas that of AKR1B10 was decreased in primary CRCs. GSEA revealed that, while high AKR1B1 expression was associated with increased cell cycle progression, cellular motility and inflammation, high AKR1B10 expression was associated with a weak inflammatory phenotype. Functional studies carried out in CRC-derived cell lines confirmed these data. Microarray data analysis indicated that high expression levels of AKR1B1 and AKR1B10 were significantly associat-ed with shorter and longer disease-free survival rates, respec-tively. A combined gene expression signature of AKR1B10 (low) and AKR1B1 (high) showed a better prognostic stratifi-cation of CRC patients independent of confounding factors. Conclusions Despite their similarities, the expression levels and functions of AKR1B1 and AKR1B10 are highly diver-gent in CRC, and they may have prognostic implications. Keywords AKR1B1 . AKR1B10 . Colorectal cancer . Inflammation . Motility . Prognosis
1 Introduction
Recent studies have indicated that the incidences of diabetes and cancer are closely related in many (but not all) countries worldwide [1,2] and that glucose sensitizing drugs can pro-vide significant protection from the development of colorectal cancer (CRC) [3]. Therefore, an evaluation of signaling path-ways that may be affected in both diabetes and CRC is war-ranted. The aldo-keto reductases (AKRs) constitute a large family of oxidoreductases that can catalyze reduction reac-tions in the presence of nicotinamide adenine dinucleotide (phosphate) (NAD(P)H) [4]. AKRs, most commonly Betul Taskoparan and Esin Gulce Seza share equal contribution.
Electronic supplementary material The online version of this article (https://doi.org/10.1007/s13402-017-0351-7) contains supplementary material, which is available to authorized users.
* Sreeparna Banerjee [email protected]
1 Department of Biological Sciences, Orta Doğu Teknik Üniversitesi
(ODTU/METU), Ankara, Turkey
2
Department of Molecular Biology and Genetics, Bilkent Üniversitesi, Ankara, Turkey
3 Department of Biochemical Pharmacology, Institute of Experimental
Pharmacology and Toxicology, Slovak Academy of Sciences, Bratislava, Slovakia
AKR1B1, are involved in the first step of the polyol pathway, where conversion of glucose into sorbitol takes place using NAD(P)H as cofactor. As such, this enzyme has been found to be implicated in the pathophysiology of diabetes [5]. AKR1B10 only weakly reduces glucose, but has been found to be implicated in the metabolism of compounds such as 4-hydroxynonenal, acrolein, retinals and phospholipid alde-hydes [6]. These compounds can also be reduced by AKR1B1 [6]. AKRs have also been found to be involved in the reduction of lipid peroxidation-derived aldehydes and their corresponding glutathione conjugates [7]. These reduced compounds serve as inflammatory signals, which mediate re-active oxygen species (ROS)-related signaling and lead to inflammatory responses [8]. Inflammation has been found to be strongly implicated in the development of CRC [9] and inhibition of the ubiquitously expressed AKR protein AKR1B1 with fidarestat has been found to inhibit inflamma-tion in CRC [10]. Additionally, siRNA-mediated silencing of AKR1B1 in the colon cancer-derived cell line SW480 was found to inhibit tumor growth in a nude mouse xenograft model [11]. AKR1B1 inhibition with fidarestat has been shown to reduce the expression of the oncogenic microRNA miR-21, leading to upregulation of the tumor suppressor pro-teins PTEN [12] and PCDC4 [13] in CRC.
Data on the role of AKR1B10 in CRC is relatively limited. AKR1B10 is abundantly expressed in non-transformed small intestine and colon, while a lower expression has been ob-served in various other organs such as liver, prostate, thymus, testis and skeletal muscle [14]. A significant decrease in the expression of AKR1B10 has been reported for CRCs and adenomas compared to their corresponding normal tissues [15]. Additionally, AKR1B10 has been reported to serve as a direct transcriptional target of p53 and to participate in p53-mediated apoptosis [15]. AKR1B10 can also metabolize elec-trophilic carbonyl compounds to harmless intermediates and, thereby, protect CRC cells from DNA damage [16].
Thus, in spite of the high similarities in structures and enzy-matic activities of AKR1B1 and AKR1B10, the expression levels and functions of the two proteins in CRC appear to be divergent. So far, however, a systematic functional comparison of the two proteins in CRC has not been carried out. Here, we have experimentally established a complete divergence in acti-vation of inflammatory signaling and cellular motility of the two proteins. Gene set enrichment analysis (GSEA) using a publicly available microarray dataset as well as The Cancer Genome Atlas (TCGA) and The Cancer Proteome Atlas (TCPA) data analyses for tumors with high and low AKR1B1 expression levels or high and low AKR1B10 expression levels confirmed these findings. AKR1B1 expression was also found to be associated with oncogenic characteristics, since silencing of the corresponding gene led to reduced cell proliferation and a slower cell cycle progression. Additionally, multivariate Cox proportional hazards regression analysis revealed that a
combination of high AKR1B10 expression and low AKR1B1 expression was of prognostic significance, i.e., it was signifi-cantly associated with a longer disease-free survival of CRC patients, independent of confounding factors.
2 Materials and methods
2.1 Cell culture and transfection
HCT-116 cells were purchased from the Deutsche Sammlung v o n M i k r o o rg a n i s m e n u n d Z e l l k u l t u r e n ( D S M Z , Braunschweig, Germany) and HT-29 cells from ŞAP Enstitüsü, Ankara, Turkey. SW480, RKO, Caco-2 and LoVo cells were purchased from the ATCC (Middlesex, UK). All cell lines were cultured under ATCC-specified conditions in a hu-midified incubator with 5% CO2 at 37 °C. All cell culture
consumables were purchased from Biochrom AG, Germany. Normal colon RNA was purchased from Origene (Rockville, MD, USA).
AKR1B1 expression was knocked down in HCT-116 cells using a SureSilencing shRNA plasmid kit (Catalog no: KH02359, Qiagen, Germany). A pool of 4 shRNA vectors was transfected into ~70% confluent HCT-116 cells in OptiMEM (Thermo Fischer Scientific, USA) using X-tremegene HP at a 1:2 ratio (1 μg vector:2 μl of X-tremegene HP) according to the manufacturer’s protocol. Transfected cells were selected using 500 μg/ml G418 (Roche, Switzerland) for 3–4 weeks after which two clonal lines with a stable knockdown of AKR1B1were chosen for further experiments. As a control, cells stably transfected with a scrambled control vector as provided in the kit was used. The cells were maintained in 225 μg/ml G418. All experi-ments with stably transfected cells were carried out within the 8th passage. For exogenous overexpression of AKR1B1, a pCMV6-AC mammalian expression vector was used (Origene). Cells were transfected at 70% confluency using X-tremegene HP at 1:2 ratio of plasmid to transfection re-agent. After 24 h the cells were harvested and processed for protein or RNA isolation. Where indicated, rescue experi-ments were carried out by overexpressing AKR1B1 in AKR1B1 silenced cells (shB1_Clone 1).
AKR1B10 cDNA, cloned into a pCOLD1 vector, was ob-tained as a gift from Dr. Satoshi Endo, Gifu Pharmaceutical University, Japan [6]. The AKR1B10 cDNA insert was ex-cised using NheI and EcoRI and sub-cloned into a pcDNA3.1 vector using the same restriction sites. Correct insertion was confirmed by sequencing. For exogenous overexpression, HCT-116 cells were transfected at 70% confluency using X-tremegene HP at 1:1 ratio of plasmid to transfection reagent. After 24 h the cells were harvested and processed for protein or RNA isolation. All transient overexpression and silencing experiments were confirmed by Western blotting.
2.2 Protein isolation and Western blotting
Total protein was isolated using a M-PER Mammalian Protein Extraction Reagent (Thermo Fisher Scientific, USA) contain-ing protease and phosphatase inhibitors (Roche, Germany) according to the manufacturer’s instructions. For the isolation of cytoplasmic and nuclear proteins cells were collected, washed with PBS and resuspended in hypotonic buffer (100 mM HEPES pH:7.5, 40 mM NaF, 100μM Na2MoO4
and 1 mM EDTA). Next, the cells were transferred to pre-chilled eppendorf tubes and incubated on ice for 15 min. Then, 40μl of 10% NP-40 was added and mixed, after which the tubes were centrifuged. The supernatant was carefully col-lected as cytoplasmic fraction. Next, the pellets were resus-pended in nuclear extraction buffer (20 mM HEPES pH:7.9, 0.2 mM EDTA, 3 mM MgCl2, 840 mM NaCl, 20% glycerol)
by shaking for 30 min in an orbital shaker with vortexing every 15 min. The resulting suspension was centrifuged at 14000×g for 10 min at 4 °C after which the supernatants were transferred to fresh eppendorf tubes as nuclear fraction. The amounts of proteins were measured using a Coomassie Protein Assay Reagent (Thermo Fisher Scientific, USA) and determined relative to a standard curve generated with bovine serum albumin. For subsequent Western blotting 30–50 μg of proteins from each sample were separated in 10% SDS- poly-acrylamide gels and transferred to polyvinylidene fluoride (PVDF) membranes. Western blotting was carried out using standard protocols. Visualization of the bands was performed using a Clarity ECL Substrate (Bio-Rad, USA) and imaged on a Chemi-Doc MP system (Bio-Rad). The membranes were also incubated with anti-β-Actin or anti-GAPDH antibodies to ensure equal protein loading. Details on the antibodies used and their dilutions are provided in Supplementary Table1. 2.3 cDNA synthesis and qRT-PCR
Total RNA was isolation using a RNeasy RNA Extraction Kit (Qiagen, Hilden, Germany) according to the manufacturer’s guidelines. The RNA was treated with DNAse I (Thermo Scientific) to remove genomic DNA, after which 1μg RNA was converted to cDNA using a RevertAid First Strand cDNA Synthesis Kit (Thermo Scientific). qRT-PCR reactions were carried out in a Rotor Gene Q 6000 system (Qiagen) according to the manufacturer’s instructions. Fold changes were calcu-lated relative to an internal control (β-Actin) using the Pfaffl method [17]. MIQE guidelines were followed in the qRT-PCR reactions [18]. The primer sequences are listed in Supplementary Table1.
2.4 Proliferation assays
To determine the effect of AKR1B1 expression knockdown on cell proliferation a BrdU incorporation assay was used. To
this end, 10,000 cells were seeded per well in a 96-well plate and allowed to attach for 24 h. Next, the cells were incubated with serum-free medium overnight for synchronization [19], after which complete medium was added and at 0, 24 and 48 h the medium was removed followed by a BrdU assay accord-ing to the manufacturer’s instructions (Roche). Measurements were performed using a microplate reader (Thermo Fisher Scientific) at 370 nm within 5–15 min. To determine the effect of exogenous AKR1B10 overexpression, a Trypan blue ex-clusion assay followed by cell counting was carried out. Twenty-four hours after transfection, the cells were collected and mixed with a 0.4% Trypan Blue solution (Bio Rad) after which the cells were counted in a TC20™ Automated Cell Counter (Bio Rad).
2.5 Cell cycle assay
To determine the effects of AKR1B1 expression knockdown or exogenous AKR1B10 overexpression on cell cycle pro-gression, the cells were synchronized overnight in serum free medium. Next, at 0 and 6–8 h for AKR1B1 knockdown and 24 h for AKR1B10 overexpression, the cells were collected and fixed through a drop-wise addition of 70% ice-cold etha-nol and kept at -20 °C for at least 2 h. Next, the fixed cells were washed in PBS, resuspended in a staining solution consisting of 0.1% Triton X-100, 2 mg/ml RNase A (DNase free) and 20 μg/ml Propidium Ioide (Sigma-Aldrich, USA) and incubated for 30 min in the dark at room temperature. The percentages of cells in different stages of the cell cycle were determined using the FL-3 channel of an Accuri C6 Flow Cytometer (BD Biosciences, USA) and compared with scrambled or empty vector controls.
2.6 Luciferase assay
In order to determine the effects of AKR1B1 and AKR1B10 on the transcriptional activity of NF-κB, a Pathdetect reporter plasmid (Agilent Genomics, USA), which contains 5 copies of the binding sites for NF-κB upstream of a firefly gene, was used. A pRL-TK Renilla plasmid (Promega, USA) was used as an internal control. 50,000 cells per well were seeded and allowed to attach in 48 well-plates. Next, the cells were transfected with a 1:250 ratio of Firefly:Renilla vectors for 24 h, harvested and assayed using a Dual-Glo Luciferase Assay Kit (Promega, USA) according to manufacturer’s guidelines in conjunction with the use of opaque 96-well plates in a luminometer (Turner Biosystems, USA).
2.7 Determination of ROS levels
To determine whether AKR1B1 or AKR1B10 expression modification alters the level of reactive oxygen species (ROS) production, a nitro-blue tetrazolium (NBT) assay
was carried out. NBT is a soluble nitro-substituted aromat-ic tetrazolium compound that forms formazan crystals in the presence of cellular superoxide ions that can subse-quently be measured colorimetrically. HCT-116 cells with a stable knockdown of AKR1B1 expression were seeded in 96-well plates (1 × 10⁴cells/well). 24 h after seeding, the cells were incubated with NBT solution (2 mg/ml for each well) for 5 h at 37 °C. Then, the cells were fixed with 100% methanol for 5 min and air dried at room temperature. The blue formazan crystals that were formed were solubilized in 120μl KOH and 140 μl DMSO by thorough pipetting. The absorbance was read colorimetrically at 620 nm in a microplate reader.
2.8In vitro scratch wound healing assay
To determine the effect of AKR1B1 and AKR1B10 expres-sion on cellular motility, a scratch wound healing assay was carried out as described previously [20]. Briefly, stably transfected cells were seeded to 80% confluency. Next, scratch wounds were made in the respective plates using a sterile 100μl-pipette tip. Cell debris was removed by washing the cells twice with cell culture grade PBS. Then, the cells were incubated in complete medium containing 0.5μM mito-mycin C [21] to prevent any cell proliferation and at 0, 24 and 48 h time points, the cell images were captured using a JuLi Smart Fluorescent Cell Imager. Medium containing 0.5μM mitomycin C was refreshed after 24 h. The width of the wounds at each time point was measured using a ruler. 2.9 Transwell migration assay
In order to assess the effects of AKR1B1 or AKR1B10 expression on cellular migration, a Transwell migration as-say was carried out. To this end, the cells were starved overnight, washed twice and resuspended in medium con-taining 1% FBS. Then, the cells were counted using a he-mocytometer and ~5 × 10⁴cells in a 100μl suspension were seeded on Transwell chambers containing membranes with 8μm pores (ThinCert™ Cell Culture Inserts, Greiner Bio-One, Germany). At the same time, the lower chamber was filled with complete medium (10% FBS). The cells were allowed to migrate for 48 h after which the Transwells were taken out and non-migrated cells were removed with sterile cotton swabs. This latter step was repeated at least twice. Next, the Transwells were fixed in 100% methanol for 10 min, stained with Giemsa solution (Merck Millipore, USA) for 2 min at room temperature, and washed with sterile distilled water extensively in order to remove all excess dye. Finally, the Transwells were left to air dry in-side a fume hood. When the Transwell filters were completely dried, the membranes were cut out with a bistoury and mounted on a glass slide with a drop of
immersion oil. The total number of cells was counted at 20× magnification under an inverted light microscope (Leica, Germany).
2.10 Collagen deposition assay
To determine whether AKR1B1 expression knockdown alters cellular motility through collagen deposition, a Sirius red assay was carried out. Briefly, stably AKR1B1silenced HCT-116 cells (5 × 10⁵) were seeded in 12-well plates. 24 h after seeding, the cells were washed once with cell culture grade PBS and then fixed in Bouin’s fluid (prepared as mixture of 15 ml saturated picric acid, 5 ml 37% formaldehyde and 1 ml glacial acetic acid) for 1 h. Next, the wells were rinsed 3× in PBS for 15 min, after which the plates were air-dried and stained with 0.5 ml of 100 mg/ml Sirius Red (Sigma-Aldrich) dissolved in saturated picric acid for 1 h with mild shaking. Subsequently, the dye was removed and the wells were rinsed with 0.01 M HCl to remove the excess dye. The deposited collagen, which stains red, was visualized under an inverted light microscope. 2.11 Hanging drop assay
A hanging drop assay was carried out to determine whether exogenous AKR1B1 overexpression results in alterations in cell-cell adhesion as described previously [20]. Briefly, HCT-116 cells were transfected with 1 or 2μg AKR1B1 expression vector or its corresponding empty vector for 24 h and collect-ed. Drops of these cells (30μl, 2 × 10⁶cells/ml) were pipetted on the inner surface of the lid of a sterile low attachment Petri dish after which the lid was placed on the petri dish and the now‘hanging drops’ were incubated for 48 h in a cell culture incubator. Next, the drops were pipetted onto glass slides, covered with coverslips and imaged. At least 20–30 aggre-gates were photographed for each transfection.
2.12In silico analyses
Gene expression data of tumor datasets were downloaded from Gene Expression Omnibus (GEO) (http://www.ncbi. nlm.nih.gov/geo) and RMA normalized using BRB-array tools (https://brb.nci.nih.gov/BRB-ArrayTools/). Clinical data related to the GSE39582 dataset (n = 585) were obtained from Marisa et al. [22]. Log expression values of AKR1B1 and AK1B10 were determined and plotted. To determine correlations between AKR1B1 or AKR1B10 expression and that of pro-inflammatory genes, Level3 RNA-seq and RPPA (reverse phase protein array)-based ex-pression data of 132 primary CRC tissues were downloaded from The Cancer Genome Atlas (TCGA) data portal (cancergenome.nih.gov). Linear correlation (Spearman) anal-yses between AKR1B1 and AKR1B10 expression and a set of pro-inflammatory genes were performed. Tumor samples
from TCGA were independently ranked according to RNAseq-based AKR1B1 and AKR1B10 expression levels and tumors with top 30% and bottom 30% expression were analysed for each gene. Differential protein expression and GSEA analysis between tumors within the top and bottom 30% were performed for both genes using the Broad Institute’s desktop application (http://software.broadinstitute. org/gsea/downloads.jsp) according to the corresponding guidelines. Collapsing mode was used as maximum probe and Gene OntologyBc5 all^ was used as genesets database. 2.13 Determination of AKR1B1 and AKR1B10 expression in primary CRC samples
Twenty six annotated first-strand cDNA samples (6-normal, 4-stage I, 8-stage II, 4-stage IIIB and 4-stage IV) from the Human Tissue Scan Colon Cancer Tissue qPCR Panel IV, HCRT304 (Origene, USA), were diluted 1:10 after which rel-ative AKR1B1 and AKR1B10 mRNA levels were measured by qRT-PCR using a CFX Connect Real-Time PCR Detection System (BioRad, USA). Cycle threshold (Ct) values of indi-vidual genes were subtracted from Ct values for the reference geneβ-Actin (ΔCt), and subsequently used to calculate fold changes in relative gene expression levels (2–ΔΔCT) relative to one of the normal samples. The primer sequences used are listed in Supplementary Table1.
2.14 Statistical analyses
All experiments were carried out as 2 or 3 independent bio-logical replicates, each with at least 3 technical replicates. GraphPad Prism 6.1 (GraphPad Software Inc., USA) or SPSS Statistics v.19 (IBM, 2010, Chicago, IL, USA) were used for data analysis. One-way ANOVA, Student’s t test or Mann Whitney U test were employed to determine signifi-cance. Kaplan-Meier plots and the log-rank test were used to compare the clinical outcomes among high-low expression groups. Univariate and multivariate Cox proportional hazards regression analysis was performed using SPSS Statistics v.19. p < 0.05 was considered as statistically significant. Log-rank tests using all cut-off values (LRMC) for a given dataset were obtained using an in-house, R-based script [23]. Specific sta-tistical analyses are further explained in the figure legends.
3 Results
3.1 AKR1B1 and AKR1B10 expression in primary colorectal cancer samples and cell lines
To determine the expression of AKR1B1 and AKR1B10 in primary colorectal cancer (CRC) samples, publicly avail-able gene expression data (microarray-based dataset
GSE39582; n = 585) were downloaded from GEO. We found that the expression of AKR1B10 was significantly reduced in the CRC samples compared to normal samples, irrespective of cancer stage (all cancer stages versus nor-mal: p < 0.001) (Fig. 1A). In contrast, we found that the expression of AKR1B1 showed no difference between the CRC (all stages) and normal samples (p > 0.05). A signif-icant decrease in the expression of AKR1B1 was, however, observed in Stage 0 (carcinoma in situ) samples compared to normal control samples (p < 0.0011). To confirm the microarray-based expression data, we decided to determine the AKR1B1 and AKR1B10 mRNA expression levels in an independent set of CRC samples using qRT-PCR anal-ysis. In concordance with the microarray-based data, we observed a significant decrease in AKR1B10 expression in the CRC samples compared to its respective normal samples (Fig. 1B), especially at stages III and IV (Supplementary Fig. 1A), whereas no significant changes in AKR1B1 expression were observed between these sam-ples (Fig.1B) or stages (Supplementary Fig.1B).
We next determined the expression of AKR1B1 and AKR1B10 in several CRC-derived cell lines. Compared to normal colon, the mRNA expression of AKR1B1 was found to be higher in HCT-116 and Caco-2 cells and undetectable in all other cell lines tested. On the other hand, we found that the expression of AKR1B10 was relatively low in all cell lines tested, except HT29 (Fig.1C). Also at the protein level, we found that AKR1B1 was expressed in HCT-116 and Caco-2 cells. An additional band appeared at a slightly higher molec-ular weight in HT-29 cells. A protein BLAST of all AKR family members revealed that AKR1B1 exhibits a 55% sim-ilarity in amino acid sequence with AKR1CL2, a 68% simi-larity with AKR1B15 and a 71% simisimi-larity with AKR1B10 (E.G.S. and S.B., unpublished data). Since we did not detect any mRNA expression of AKR1B1 in these cells, we specu-late that the band observed may correspond to another mem-ber of the AKR family that is also recognized by the antibody used. AKR1B10 was found to be expressed solely in HT-29 cells (Fig.1C). Therefore, to determine whether the expres-sion of AKR1B1 or AKR1B10 plays any role in CRC, we separately silenced AKR1B1 and exogenously overexpressed AKR1B10 in HCT-116 cells (Fig.1D). As a control, AKR1B1 and AKR1B10 were exogenously overexpressed in LoVo cells, which do not express any detectable levels of either protein (Supplementary Fig.1C).
3.2 AKR1B1, but not AKR1B10, affects cellular proliferation and cell cycle progression
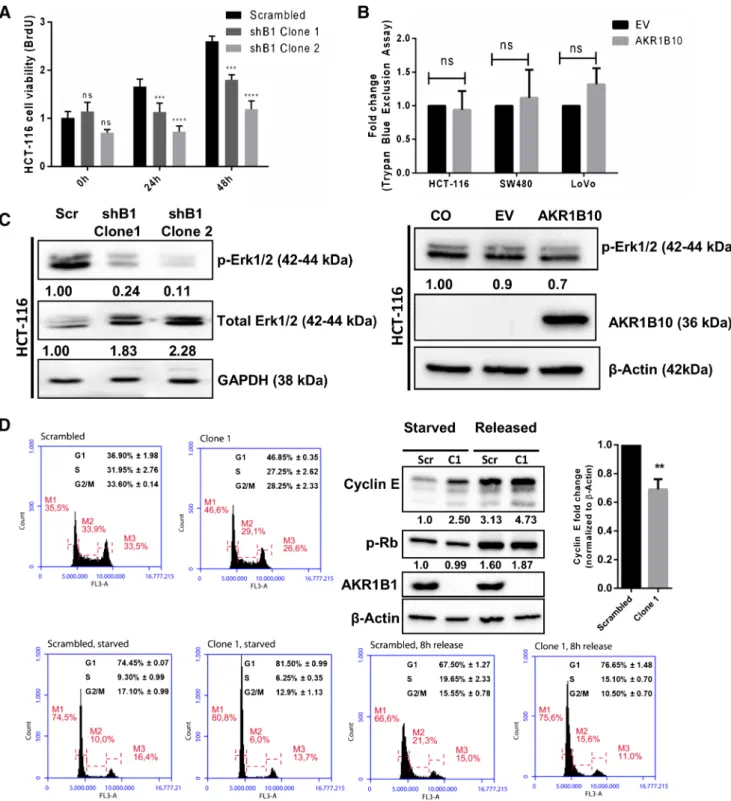
Using a BrdU incorporation assay, we found that AKR1B1 silencing resulted in a decrease in proliferation of HCT-116 cells (Fig.2A). This observation was supported by a reduced phosphorylation of ERK1/2, a mitogenic marker of the MAP
kinase cascade, in cells grown in complete medium (Fig.2C, left panel). To assess the effect of AKR1B10 on cellular pro-liferation, a Trypan blue exclusion assay followed by automat-ed counting was carriautomat-ed out. No differences in cell numbers were observed when AKR1B10 was exogenously overexpressed in HCT-116, SW480 or LoVo cells (Fig.2B), along with no changes in ERK1/2 phosphorylation (Fig.2C, right panel).
To determine effect of AKR1B1 silencing on cell cycle progression, PI staining followed by flow cytometry was used. By doing so, we found that AKR1B1 silencing did not lead to a cell cycle arrest. Rather, a slowing down of the cell cycle was observed whereby a greater proportion of AKR1B1 silenced cells was retained in the G1 phase and entered the S phase later than in the scrambled control c e l l s a t 8 h ( F i g . 2 D, S u p p l e m e n t a r y F i g . 2A ) . Interestingly, we observed increased Cyclin E protein levels in starved (synchronized) and released (6–8 h) cells, as well as in unsynchronized cells in which AKR1B1 was silenced. However, when we determined the fold changes in Cyclin E levels of starved versus released cells for both AKR1B1 silenced and scrambled control cells, we ob-served a statistically significant decrease in Cyclin E in the AKR1B1 silenced cells 6-8 h after release. No ence was observed in Rb phosphorylation. Also, no differ-ence in cell cycle progression was observed in exogenous-l y A K R 1 B 1 0 o v e r e x p r e s s i n g H C T- 1 1 6 c e exogenous-l exogenous-l s (Supplementary Fig.2B).
3.3 AKR1B1 enhances and AKR1B10 reduces cell motility Gene Set Enrichment Analysis (GSEA) [24] of the GSE39582 [22] dataset for the high 30% and low 30% AKR1B1 expressing cases indicated a significant (p < 0.001) enrichment in the Gene Ontology (GO) term BCELL_SUBSTRATE_ JUNCTION^ in tumor samples with a high AKR1B1 expression (Fig. 3A; for the full set of genes for this GO term, see Supplementary Table 2). The Cancer Proteome Atlas (TCPA) was used to mine data from colon and rectal patient samples [25]. Differential expression analysis of proteins between the AKR1B1 high 30% versus the AKR1B1 low 30% patients revealed a sig-nificantly higher expression of the mesenchymal/motility markers collagenVI (p = 0.0003), fibronectin (p = 0.0002) and transglutaminase (p = 0.0019), whereas significantly lower expression levels were seen for the junctional protein claudin-7 (p = 0.0011), which has been associated with epithelial characteristics [26], and FOXO 3a (p = 0.005), a transcription factor that can enhance the expression of antioxidant proteins [27] (Fig. 3B; for the full list of significantly altered proteins see Supplementary Table3). None of these proteins was found to be significantly up-regulated in AKR1B10 high expressing tumors (p > 0.05).
Therefore, we set out to test whether silencing of AKR1B1 or exogenous overexpression of AKR1B10 may result in alterations in cell motility. We found that AKR1B1 si-lenced cells (both clones tested) showed a significantly slower closure in a wound healing assay (Fig. 3C and Supplementary Fig. 3A), while a Transwell migration as-say revealed a significantly lower amount of migrating cells (Fig. 3D, left panel, Supplementary Fig.3B). As the exogenous overexpression of AKR1B10 was carried out transiently, and we thus could not be sure that the cells at the border of the wound in the scratch wound assay would be expressing AKR1B10, we carried out a Transwell gration assay and found a significant decrease in cell mi-gration when AKR1B10 was overexpressed (Fig.3D, right panel, Supplementary Fig.3C).
CollagenVI was found to be highly expressed (p = 0.0003) in the TCPA data set of samples with high AKR1B1expression. Therefore, we carried out a collagen deposition assay using Sirius Red staining on HCT-116 cells in which AKR1B1 was knocked down. We observed a decrease in collagen deposition in cells in which AKR1B1was stably silenced (Fig. 3E). To further sub-stantiate the notion that alterations in cell-cell adhesion in cells expressing AKR1B1 may lead to altered motility, we exogenously overexpressed AKR1B1 in HCT-116 cells using increasing amounts of plasmids and carried out a hanging drop assay. By doing so we found that, while control cells formed large cell clusters indicating good cell-cell contacts, AKR1B1 overexpressing cells showed a clear decrease in the formation of compact cel-lular aggregates (Fig. 3F). This effect was more pro-nounced in cells that were transfected with the higher amount of plasmid. Interestingly, we did not observe any change in expression of well-known epithelial markers, such as E-cadherin, or mesenchymal markers, such as vimentin (data not shown).
Fig. 1 Expression of AKR1B1 and AKR1B10 in primary CRC samples and CRC-derived cell lines. (A). Log2 AKR1B1 and
AK1B10 expression values from the GSE39582 dataset (n = 585) are plotted. The horizontal lines indicate means. Statistical significance was determined by Student’s t-test. No change in AKR1B1 expression and a significant decrease in AKR1B10 expression was observed across stages I-IV compared to normal samples. (B). qRT-PCR analysis of CRC cDNA samples from a Tissue Scan array showing no difference in AKR1B1 expression and a reduction in AKR1B10 expression in CRC versus nor-mal tissues. Statistical analysis was carried out using a non-parametric Mann Whitney U test. (C). qRT-PCR and Western blot-based AKR1B1 and AKR1B10 expression analyses of a panel of CRC-derived cell lines. (D). Western blot confirming the silencing of AKR1B1 (shB1 Clone 1 and shB1 Clone 2) and exogenous overexpression of AKR1B10 in HCT-116 cells. ****p < 0.0001, **p < 0.01
Fig. 2 Effect of AKR1B1 and AKR1B10 expression on cellular proliferation and cell cycle progression. (A). BrdU incorporation assay showing a decrease in proliferation in stably AKR1B1 silenced HCT-116 cells. Statistical analyses were carried out with ANOVA using Tukey’s posthoc test. (B). Trypan blue exclusion assay showing absence of change in proliferation in HCT-116, SW-480 and LoVo cells transiently transfected with an AKR1B10 expression plasmid. (C). Western blot showing that AKR1B1 silencing leads to a decrease in EKR1/2 protein activation, whereas exogenous AKR1B10 overexpression did not result in any alteration. Numbers under the bands indicate band intensities nor-malized to the loading control. (D). Cell cycle distribution of serum
starvation-synchronized AKR1B1 silenced cells collected at 0 and 8 h after release from starvation. The average cell cycle distributions (three independent experiments) of scrambled control and shB1 Clone1 (unsyn-chronized or syn(unsyn-chronized and harvested 6–8 h after release) cells are shown above representative histograms. The delay in cell cycle progres-sion seen in these cells was corroborated by significantly lower fold changes in Cyclin E protein in shB1 Clone-1 cells before and after star-vation compared to control cells. No difference in Rb phosphorylation was observed. Scr refers to control cells transfected with the scrambled plasmid, C1 refers to shB1 Clone 1, C2 refers to shB1 Clone 2, CO refers to cells only
3.4 AKR1B1 expression enhances and AKR1B10 inhibits NF-κB activity
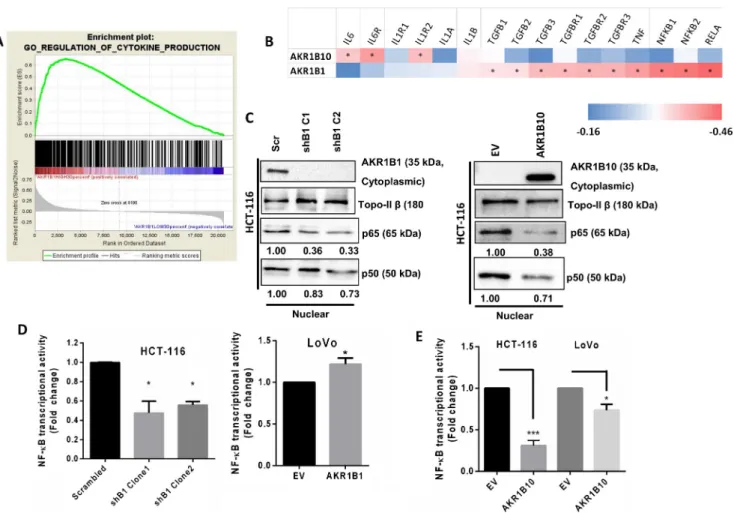
Previously, tumors have been described as unhealed wounds that recruit a vast number of inflammatory cells that can pro-vide a microenvironment that is conducive for further prolif-eration and metastasis [28]. To assess whether the altered motilities observed in the presence of AKR1B1 or AKR1B10 expression are also accompanied by alterations in inflammation, we performed a GSEA for CRC samples exhibiting the highest and lowest 30% AKR1B1 expression levels, using the GSE39582 dataset [22]. A highly significant (p < 0.001) enrichment was observed for the GO term BREGULATION_OF_CYTOKINE_PRODUCTION^ in tu-mors with a high AKR1B1 expression (Fig.4A; for the full set of genes for this GO term, see Supplementary Table2). On the other hand, we found that samples exhibiting the highest 30% AKR1B10 expression did not show a significant enrichment of any GO terms related to inflammation.
Using RNA-seq data from the TCGA portal for primary CRC samples from 132 patients, we next carried out a Spearman correlation analysis between the expression of AKR1B1 or AKR1B10 and a set of 16 pro-inflammatory genes. We found that AKR1B1 expression was positively correlated with 10 of the 16 genes, whereas the expression of AKR1B10 was positively correlated with only 3 of the genes (Fig.4B). Strikingly, no common gene could be identified that was signif-icantly correlated with both AKR1B1 and AKR1B10.
In order to subsequently determine whether inflamma-tory signaling was altered in the cellular models used in the current study, we examined the activation of nuclear factor kappa B (NF-κB). NF-κB is a transcription factor that en-hances the expression of pro-inflammatory genes such as cytokines, chemokines, adhesion molecules and other im-munoregulatory mediators [29]. Nuclear translocation of NF-κB is associated with its transcriptional activation [30]. Nuclear fractions of cell lysates from stably AKR1B1 silenced HCT-116 cells or exogenously AKR1B10 overexpressing HCT-116 cells showed a re-duced translocation of the NF-κB subunits p65 and p50 from the cytoplasm to the nucleus (Fig. 4C). Moreover, when we overexpressed AKR1B1 in AKR1B1-silenced HCT-116 cells, we observed a partial rescue in the nuclear translocation of p65 and p50 (Supplementary Fig. 4A). Additionally, we found a reduced NF-κB activation in lu-ciferase reporter assays when AKR1B1 was silenced in HCT-116 cells. Exogenous overexpression of AKR1B1 in LoVo cells reversed this effect (Fig.4D). On the contrary, we found that exogenous overexpression of AKR1B10 re-sulted in a reduced transcriptional activity of NF-κB in HCT-116 and LoVo cells (Fig.4E). To further comprehend the mechanism underlying enhanced NF-κB activation, we
examined ROS production in the context of AKR1B1 or AKR1B10 expression. We found that AKR1B1 silencing resulted in a significantly lower amount of ROS formation (Supplementary Fig.4B), whereas no change in ROS pro-duction was observed when AKR1B10 was exogenously overexpressed, indicating that for this other mechanisms must be at work (data not shown).
3.5 High AKR1B1 expression correlates with a poor prognosis and high AKR1B10 expression correlates with a good prognosis in CRC patients
We next queried whether the expression of AKR1B1 and AKR1B10 had any prognostic significance by analyzing the GSE39582 dataset [22]. Log-Rank tests were performed be-tween two groups of patients stratified by all possible thresh-old values for each gene. The cut-off values that were within the 25–75 percentiles with the lowest p values were selected for further Kaplan-Meier analyses. By doing so, we found that a high AKR1B1 expression was associated with a shorter disease-free survival (DFS), while a high AKR1B10 expres-sion was significantly associated with a longer DFS (Fig.5A and B). Although we did not observe any statistically signif-icant difference in AKR1B1 expression across different CRC stages in the GSE36582 set, the same dataset showed that a high AKR1B1 expression was associated with a shorter DFS in stage 2, 3 and 4 CRC (Supplementary Fig.5).
To determine whether AKR1B1 and/or AKR1B10 may serve as prognostic indicators for overall CRC survival, we performed an independent multivariate Cox proportional hazards regression analysis (MVA), which revealed that this was indeed the case (Fig.5C). Based on these observations, we generated a com-bined AKR gene signature for prognosis prediction, where AKR1B10-high and AKR1B1-low patients were classified as those with a Bgood^ prognosis, AKR1B1-high and AKR1B10-low patients as those with aBbad^ prognosis, and the rest as those with an Bintermediate^ prognosis (Fig.5D). This classification generated a highly significant prognostic strat-ification with a log rank p value < 0.001 (Fig.5D). An additional MVA that included clinicopathological parameters revealed that the combined AKR gene signature was associated with disease-free survival independent of age, gender, KRAS or BRAF muta-tions, and TNM stage (Supplementary Table4).
4 Discussion
The aldo-keto reductases AKR1B1 and AKR1B10 exhibit a high degree of similarity in amino acid sequence and structure and are able to reduce a number of common substrates [31]. However, AKR1B1 is ubiquitously expressed while the expression of
AKR1B10 is restricted to the gut and adrenal glands. Therefore, based on their distinct expression patterns, we hypothesized that AKR1B1 and AKR1B10 may play distinct roles in CRC. Here, we aimed to systematically test this hypothesis.
To this end, we first examined the expression of AKR1B1 and AKR1B10 in CRC tissues. Microarray and qRT-PCR-based data indicated that the expression of AKR1B1 was
similar in CRC and normal tissues whereas the expression of AKR1B10 was significantly reduced in the CRC samples, particularly in Stages III and IV. AKR1B10 has been reported to be a downstream target of p53. Therefore, loss of p53 ac-tivity may be implicated in loss of AKR1B10 expression [15]. However, p53 inactivation is not a universal phenomenon in CRC. Downregulation of AKR1B10 through promoter
hypermethylation can also be ruled out since no CpG islands could be identified in the AKR1B10 promoter [15]. Moreover, using a cohort of 295 CRC samples present in the TCGA data set for which both methylation and expression information was available, we found that DNA methylation and RNA expression of AKR1B1 were significantly negatively correlat-ed (rank of 143 among 201 genes with Bonferroni correctcorrelat-ed p value < 0.01, r value <−0.70) while AKR1B10 was not found to be significantly correlated (S.D., A.O.G., S.B., unpublished data). Others have reported that in a cohort of 502 CRC cases, 70% of the tumors showed AKR1B1 promoter hypermethy-lation with similar levels of hypermethyhypermethy-lation in both adeno-mas and carcinoadeno-mas [32]. However, these authors also report-ed that re-expression of AKR1B1 was not observreport-ed in a DNMT (DNA Methyl Transferase) null CRC-derived cell line, thereby underscoring the complex regulation of AKR1B1 expression in CRC [32]. Hypermethylation of the AKR1B1 promoter is not restricted to CRC and has also been reported in e.g. breast cancer [33].
We found that AKR1B1 silenced cells showed a signifi-cantly reduced proliferation, without affecting apoptosis. We also observed downregulation of the mitogenic ERK1/2 pro-teins [34] in AKR1B1 silenced cells, which may underlie the reduced proliferation rate. Additionally, we found that a slowed down cell cycle may have contributed to the reduced proliferation rate of AKR1B1 silenced cells. Treatment of growth factor stimulated CRC-derived cells with the aldo-keto reducatse inhibitor sorbinil has been shown to induce G1 arrest through downregulation of G1 cyclins and a reduced
activity of the transcription factor E2F [35]. In the current study, we found that 6–8 h after release from starvation-induced synchronization, a significantly larger proportion of AKR1B1 silenced cells was still in the G1 phase, whereas non-silenced control cells had already moved to the S phase. We also found that the control cells exhibited increased Cyclin E levels 6–8 h after release from starvation, as would be ex-pected for cycling cells [36]. The increase in Cyclin E levels in the AKR1B1 silenced cells 6–8 h after release from starvation was significantly lower. This increase most likely reflects the greater accumulation of these cells in the G1 phase. Of note, we found that AKR1B1 silenced cells in general expressed higher levels of Cyclin E, irrespective of whether the cells were synchronized, starved or not. This was unlikely due to transcriptional upregulation as we did not observe any chang-es in the phosphorylation of Rb. Future studichang-es are required to elucidate the mechanism underlying the high Cyclin E protein levels in AKR1B1 silenced cells. Interestingly, we found that alterations in chromosome segregation and cell cycle regula-tion were among the gene ontology terms that were enriched (albeit non significantly, p = 0.057) in the GSEA of tumors that expressed low amounts of AKR1B1. Overexpression of AKR1B10 in HCT-116 cells did not result in any alteration in proliferation, apoptosis or cell cycle progression. AKR1B10 has been reported to metabolize cytotoxic carbonyl com-pounds to harmless intermediates [16]. Loss of AKR1B10 expression in CRC tissues may hamper the protection of these tissues from DNA damage by carbonyl compounds. It remains to be examined whether AKR1B10 overexpression can lead to alterations in cell cycle arrest in CRC cells with DNA damage. Pharmaceutical inhibition of AKR1B1 in HT-29 cells has been shown to reduce growth factor-mediated adhesion to endothelial cells and expression of cell adhesion molecules [37]. These data were further supported by a reduced hepatic metastasis of KM20 cells in nude mice to which AKR inhib-itors were administered [37]. Additionally, it has recently been found that AKR1B1 may serve as a target of the mesenchymal transcription factor Twist2 and as a major inducer of epithelial to mesenchymal transition in basal-like breast carcinomas [38]. Our analysis of CRC microarray-based expression data (GSEA), TCPA as well as functional studies on CRC-derived cell lines support the notion that high AKR1B1 levels may result in enhanced motility and migration. Conversely, we found that exogenous overexpression of AKR1B10 in HCT-116 cells resulted in a significantly slower cell motility. The role of AKR1B10 in metastasis appears to be highly context dependent. In breast cancer, AKR1B10 has been reported to be significantly associated with metastasis [39] through up-regulation of integrinα5 and δ-catenin [40] whereas, similar to our data, AKR1B10 overexpression in a nasopharyngeal carcinoma-derived cell line was found to result in a slower proliferation and a slower migration [41]. These differences may, at least partly, be explained by the different cell types
Fig. 3 Effect of AKR1B1 and AKR1B10 expression on the metastatic behavior of CRC cells. (A). GSEA showing a high enrichment score (ES) of the Gene Ontology term CELL_ SUBSTRATE_ JUNCTION in patients from the GSE39582 data set exhibiting the highest and lowest 30% AKR1B1 expression levels. The plot reflects the degree to which a gene set is overrepresented at the top or bottom of a ranked list of genes. The score at the peak of the plot (the score farthest from 0.0) is the ES for the gene set. The position of indi-vidual members of the gene set in the ranked list is indicated by vertical lines. (B). TCPA data showing significantly higher expression levels of the mesenchymal/motility markers collagen VI (p = 0.0003), fibronectin (p = 0.0002), and transglutaminase (p = 0.0019) and a low expression of claudin-7 (p = 0.0011) and FOXO 3a (p = 0.005) in the high 30% AKR1B1 expressing samples versus the low 30% expressing samples. (C). Wound healing assay showing a significantly slower wound closure indicating a lower motility in stably AKR1B1 silenced HCT-116 cells. Statistical analyses were carried out using ANOVA and Tukey’s posthoc test, *p < 0.05, **p < 0.01. The cells were treated with mitomycin C (0.5μM) during the experiment to inhibit cell proliferation. (D). Transwell migration assay showing a slower migration of HCT-116 cells in which AKR1B1 was either silenced or AKR1B10 was overexpressed. Statistical analyses were carried out using Student’s t-test, *p < 0.05, ****p < 0.0001. (E). Sirius Red assay showing less collagen deposition (less red color) in AKR1B1 silenced in HCT-116 cells. (F). Hanging drop assay showing a weaker cell-cell adhesion (less tight and well-formed aggregates) in a dose-dependent manner when HCT-116 cells were transfected with increasing amounts of the AKR1B1 overexpression (o/ex) plasmidexamined. The CRC-derived cell line HCT-8 has been found to transition from an epithelial (E) phenotype to a rare more rounded (R) highly metastatic phenotype when grown (20 days) on soft substrates [42]. The‘R’ cells expressed sig-nificantly higher amounts of AKR1B10 than the‘E’ cells. Thus, AKR1B10 expression may generally be reduced in ep-ithelial type CRC cells that predominate in most of the models used to date. Interestingly, it has been found that epithelial type MCF-7 breast cancer-derived cells overexpressing AKR1B10 did not metastasize to lungs in vivo, whereas MDA-MB-231 cells that are more mesenchymal in nature [43] metastasized to the lungs when overexpressing AKR1B10 [40]. It remains to be seen whether primary CRC stem cells express higher amounts of AKR1B10 and whether this influences the metastatic capability of these cells. Fig. 4 Effect of AKR1B1 and AKR1B10 expression of inflammation. (A). GSEA showing high enrichment scores (ES) of the Gene Ontology term REGULATION_OF_CYTOKINE_ PRODUCTION in cases from the GSE39582 data set with the highest 30% AKR1B1 expression compared to the lowest 30%. The score at the peak of the plot (the score farthest from 0.0) is the ES for the gene set. The position of individual members of the gene set in the ranked list is indicated by vertical lines. (B). Using the CoadRead TCGA RNA-sequencing data, we tested whether 16 genes associated with inflammation correlated with either AKR1B1 or AKR1B10 in the same patients. A non-overlapping correlation of AKR1B1 and AKR1B10 was observed for several pro-inflammatory markers. Asterisks represent samples
that are significantly correlated. Correlation r values were marked from lowest (blue) to highest (red). (C). Western blot showing reduced nuclear transloca-tion of NF-κB in stably AKR1B1 silenced and AKR1B10 overexpressing HCT-116. TopoII-β was used as a loading control. Numbers under the bands indicate band intensities normalized to the loading control. (D). Luciferase assay showing reduced NF-κB transcriptional activity in stably AKR1B1 silenced HCT-116 cells. Overexpression of AKR1B1 in LoVo cells resulted in enhanced transcriptional activity. Exogenous AKR1B10 overexpression in both HCT-116 and LoVo cells resulted in reduced NF-κB transcriptional activity. Statistical analyses were carried out using Students t-test. *p < 0.05, ***p < 0.001
Fig. 5 AKR1B1 and AKR1B10 expression as prognostic CRC markers. (A). LRMC plots for AKR1B1 and AKR1B10 showing p values from Log-Rank tests performed between these two groups stratified at each expression threshold value. Blue and red colors were used to indicate association of gene expression with a good or poor prognosis, respectively. The horizontal dotted line corresponds to the significance threshold of 0.05. Vertical lines correspond to expression thresholds of the 25th, 50th and 75th percentiles of patients. (B). Kaplan-Meier plots using patient data from the GSE39582 set based on cut-off levels within the 25-75th percentiles with the lowest p value for either AKR1B1 and AKR1B10 showed that high expres-sion was significantly associated with shorter and longer disease-free survival rates for AKR1B1 and AKR1B10, respectively. (C). Multivariate Cox pro-portional hazards regression analyses with cut-offs in the 25-75th percentiles with the lowest p value were used for both genes, showing that the prognostic associations of AKR1B1 and AK1B10 were independent of each other. (D). An AKR1B1 and AKR1B10 combined gene signature (AKR) can predict the prognosis of patients in the GSE39582 data set
Activation of the polyol pathway can lead to the devel-opment of oxidative stress which, in turn, can enhance the activation of inflammatory transcription factors such as NF-κB and AP-1 [8]. Pharmacological inhibition of AKR1B1 has been shown to reduce NF-κB activity in growth factor stimulated Caco-2 cells [11]. In support of these data, we found that exogenous AKR1B1 overex-pression or silencing in CRC-derived cells was directly correlated with NF-κB activation, most likely through en-hanced ROS production. No additional stimulation with growth factors was necessary to observe these effects. On the contrary, we found that exogenous AKR1B10 overexpression led to a reduced activation of NF-κB. According to TCGA CoadRead RNA-seq data, the ex-pression of a number of distinct non-overlapping sets of inflammatory genes correlated with the expression of AKR1B1 or AKR1B10. We found that AKR1B1 was pos-itively correlated with several pro-inflammatory genes. Among the genes that were positively correlated with the expression of AKR1B10, the highest positive correla-tion was observed for IL1-R2, a negative regulator of interleukin (IL)-1 that binds with high affinity to IL-1β and IL-1α, but does not induce any downstream signaling [44]. Interestingly, the expression of IL-1α was also
found to be significantly positively correlated with AKR1B10, indicating the possibility of negative feedback mechanisms. While it is premature to conclude that AKR1B10 has anti-inflammatory properties, it is likely that the types of inflammation induced by AKR1B1 and AKR1B10 serve different purposes.
The prognostic significances of AKR1B1 and AKR1B10 individually have been reported for several different tumor types [15,41,45–47]. In CRC we found that the expression of AKR1B1 was not altered in cancer cells compared to normal cells, both in silico and in in vitro experiments. This observa-tion is supported by another study in which no significant dif-ference was observed in AKR1B1 expression in CRC, normal colon and ulcerative colitis tissue samples [48]. On the other hand, current and other studies [8, 10,35,49] indicate that AKR1B1 overexpression may be associated with alterations in proliferation, cell cycle progression and the activation of inflammatory pathways. AKR1B1 may also serve as a prog-nostic CRC marker since patients with a high AKR1B1 expres-sion in the GSE39582 dataset showed a significantly shorter disease-free survival (DFS). We found that this notion was also supported by a lack of significant differences in the expression of AKR1B1 using qRT-PCR (TissueScan CRC patient cDNA array) on the basis of available TNM staging, node positivity and differentiation information (data not shown).
AKR1B10 expression is dependent on the site of tumor origin, with a generally lower expression reported for tumors of the head and neck, bladder, stomach and colon compared to their normal counterparts [50]. Moreover, in hepatocellular
carcinoma (HCC), where AKR1B10 has been reported to be strongly upregulated in Hepatitis B virus (HBV)-related tu-mors [51] as well as in primary hepatocellular carcinomas [46], AKR1B10 overexpressing patients have been found to have a more favorable prognosis, a reduced tumor recurrence and a longer survival [50,51]. For CRC, a similar favorable prognosis has been noted for AKR1B10 high expressing tu-mors using three independent data sets [15]. We found that in the AKR1B10 high expressing group in the GSE39582 data set the corresponding patients also showed significantly lon-ger disease-free survival rates. Importantly, we have shown here for the first time that a combined signature of low AKR1B1 and high AKR1B10 expression provides a better prognostic stratification for CRC patients compared to either gene alone, and that this stratification is independent of other confounding factors such as age, TNM stage and KRAS or BRAF gene mutations.
5 Conclusions
In the current study we have shown that the functional effects of alterations in AKR1B1 and AKR1B10 expression in CRC are highly divergent even though both proteins catalyze very similar reactions. Opposite effects were observed on cellular proliferation, cell cycle progression, cellular motility and ac-tivation of inflammatory signaling pathways. Intriguingly, we found that differences in expression and role in inflammation were also observed in patient datasets stratified according to low or high AKR1B1 and AKR1B10 expression. Patients with a high AKR1B10 expression had a more favorable prog-nosis and GSEA showed that cells from these patients expressed genes that were highly enriched in metabolic pro-cesses, as would be expected for an enzyme that has a reduc-tase function. On the other hand, we found that in AKR1B1 overexpressing patients, who had a worse prognosis, the cells showed an enrichment in inflammatory signaling and cell-cell adhesion. This dichotomy is interesting and implies that over-expression of AKR1B1 in CRC may lead to a loss or alteration in its enzymatic function, causing the activation of additional mitogenic signaling processes. This dichotomy is also reflected by a combined gene expression signature where low AKR1B1 and high AKR1B10 expression reflect a better prognostic prediction than the individual genes alone. Future studies are required to establish whether therapeutic targeting of AKR1B1 will yield beneficial effects in CRC.
Acknowledgements We thank Dr. Marta Prnova of the Department of Biochemical Pharmacology, Institute of Experimental Pharmacology and Toxicology, Slovak Academy of Sciences, Bratislava, Slovakia for help-ful discussions. The research was supported by TÜBİTAK Project No: 113S006 (Program 2513, TÜBİTAK-Slovak Academy of Sciences Cooperation Projects) to SB. Seyma Ceyhan is gratefully acknowledged for generating the AKR1B1 silenced cells.
Compliance with ethical standards Conflict of interest None declared.
References
1. N. González, I. Prieto, L. Del Puerto-Nevado, S. Portal-Nuñez, J.A. Ardura, M. Corton, B. Fernández-Fernández, O. Aguilera, C. Gomez-Guerrero, S. Mas, J.A. Moreno, M. Ruiz-Ortega, A.B. Sanz, M.D. Sanchez-Niño, F. Rojo, F. Vivanco, P. Esbrit, C. Ayuso, G. Alvarez-Llamas, J. Egido, J. García-Foncillas, A. Ortiz, Diabetes Cancer Connect Consortium, 2017 update on the relation-ship between diabetes and colorectal cancer: epidemiology, poten-tial molecular mechanisms and therapeutic implications. Oncotarget 8, 18456–18485 (2017)
2. L.A. Flores-Lopez, M.G. Martinez-Hernandez, R. Viedma-Rodriguez, M. Diaz-Flores, L.A. Baiza-Gutman, High glucose and insulin enhance uPA expression, ROS formation and invasive-ness in breast cancer-derived cells. Cell Oncol. 39, 365–378 (2016) 3. P. Papanagnou, T. Stivarou, M. Tsironi, Unexploited antineoplastic effects of commercially available anti-diabetic drugs. Pharmaceuticals 9, 24–44 (2016)
4. R.D. Mindnich, T.M. Penning, Aldo-keto reductase (AKR) super-family: genomics and annotation. Hum. Genomics 3, 362–370 (2009)
5. R. Saraswathy, S. Anand, S.K. Kunnumpurath, R.J. Kurian, A.D. Kaye, N. Vadivelu, Chromosomal aberrations and exon 1 mutation in the AKR1B1 gene in patients with diabetic neuropathy. Ochsner J. 14, 339–342 (2014)
6. S. Endo, T. Matsunaga, H. Mamiya, C. Ohta, M. Soda, Y. Kitade, K. Tajima, H.T. Zhao, O. El-Kabbani, A. Hara, Kinetic studies of AKR1B10, human aldose reductase-like protein: endogenous sub-strates and inhibition by steroids. Arch. Biochem. Biophys. 487, 1– 9 (2009)
7. K.V. Ramana, Aldose reductase: New insights for an old enzyme. Biomol. Concepts 2, 103–114 (2011)
8. S.K. Srivastava, U.C.S. Yadav, A.B.M. Reddy, A. Saxena, R. Tammali, M. Shoeb, N.H. Ansari, A. Bhatnagar, M.J. Petrash, S. Srivastava, K.V. Ramana, Aldose reductase inhibition suppresses oxidative stress-induced inflammatory disorders. Chem. Biol. Interact. 191, 330–338 (2011)
9. S.I. Grivennikov, Inflammation and colorectal cancer: colitis-associated neoplasia. Semin. Immunopathol. 35, 229–244 (2013) 10. A. Saxena, M. Shoeb, R. Tammali, K.V. Ramana, S.K. Srivastava,
Aldose reductase inhibition suppresses azoxymethane-induced co-lonic premalignant lesions in C57BL/KsJ-db/db mice. Cancer Lett. 355, 141–147 (2014)
11. R. Tammali, K.V. Ramana, S.S. Singhal, S. Awasthi, S.K. Srivastava, Aldose reductase regulates growth factor-induced cy-clooxygenase-2 expression and prostaglandin E2 production in hu-man colon cancer cells. Cancer Res. 66, 9705–9713 (2006) 12. A. Saxena, R. Tammali, K.V. Ramana, S.K. Srivastava, Aldose
reductase inhibition prevents colon cancer growth by restoring phosphatase and tensin homolog through modulation of miR-21 and FOXO3a. Antioxid. Redox. Sign. 18, 1249–1262 (2013) 13. A. Saxena, M. Shoeb, K.V. Ramana, S.K. Srivastava, Aldose
re-ductase inhibition suppresses colon cancer cell viability by modu-lating microRNA-21 mediated programmed cell death 4 (PDCD4) expression. Eur. J. Cancer 49, 3311–3319 (2013)
14. D. Cao, S.T. Fan, S.S. Chung, Identification and characterization of a novel human aldose reductase-like gene. J. Biol. Chem. 273, 11429–11435 (1998)
15. T. Ohashi, M. Idogawa, Y. Sasaki, H. Suzuki, T. Tokino, AKR1B10, a transcriptional target of p53, is downregulated in colorectal cancers associated with poor prognosis. Mol. Cancer Res. 11, 1554–1563 (2013)
16. X. Zu, R. Yan, J. Pan, L. Zhong, Y. Cao, J. Ma, C. Cai, D. Huang, J. Liu, F.L. Chung, D.F. Liao, D. Cao, Aldo-keto reductase 1B10 protects human colon cells from DNA damage induced by electro-philic carbonyl compounds. Mol. Carcinog. 56, 118–129 (2017) 17. M.W. Pfaffl, A new mathematical model for relative quantification
in real-time RT-PCR. Nucleic Acids Res. 29(45e) (2001) 18. S.A. Bustin, V. Benes, J.A. Garson, J. Hellemans, J. Huggett, M.
Kubista, R. Mueller, T. Nolan, M.W. Pfaffl, G.L. Shipley, J. Vandesompele, C.T. Wittwer, The MIQE guidelines: minimum in-formation for publication of quantitative real-time PCR experi-ments. Clin. Chem. 55, 611 (2009)
19. N. Iyer, J. Xian, S.-F. Chin, A. Bannister, Y. Daigo, S. Aparicio, T. Kouzarides, C. Caldas, p300 is required for orderly G1/S transition in human cancer cells. Oncogene 26, 21–29 (2007)
20. S. Tunçer, S. Tunçay Çağatay, A.G. Keşküş, M. Çolakoğlu, O. Konu, S. Banerjee, Interplay between 15-lipoxygenase-1 and metastasis-associated antigen 1 in the metastatic potential of colo-rectal cancer. Cell. Prolif. 49, 448–459 (2016)
21. G. Deep, S.C. Gangar, C. Agarwal, R. Agarwal, Role of E-cadherin in antimigratory and antiinvasive efficacy of silibinin in prostate cancer cells. Cancer Prev. Res. 4, 1222 (2011)
22. L. Marisa, A. de Reynies, A. Duval, J. Selves, M.P. Gaub, L. Vescovo, M.C. Etienne-Grimaldi, R. Schiappa, D. Guenot, M. Ayadi, S. Kirzin, M. Chazal, J.F. Flejou, D. Benchimol, A. Berger, A. Lagarde, E. Pencreach, F. Piard, D. Elias, Y. Parc, S. Olschwang, G. Milano, P. Laurent-Puig, V. Boige, Gene expression classification of colon cancer into molecular subtypes: characteri-zation, validation, and prognostic value. PLoS Med. 10, e1001453 (2013)
23. S. Demirkol, I. Gomceli, M. Isbilen, B.E. Dayanc, M. Tez, E.B. Bostanci, N. Turhan, M. Akoglu, E. Ozyerli, S. Durdu, O. Konu, A. Nissan, M. Gonen, A.O. Gure, A combined ULBP2 and SEMA5A expression signature as a prognostic and predictive biomarker for colon cancer. J. Cancer 8, 1113–1122 (2017)
24. A. Subramanian, P. Tamayo, V.K. Mootha, S. Mukherjee, B.L. Ebert, M.A. Gillette, A. Paulovich, S.L. Pomeroy, T.R. Golub, E.S. Lander, J.P. Mesirov, Gene set enrichment analysis: a knowledge-based approach for interpreting genome-wide expres-sion profiles. Proc. Natl. Acad. Sci. U. S. A. 102, 15545–15550 (2005)
25. J. Li, Y. Lu, R. Akbani, Z. Ju, P.L. Roebuck, W. Liu, J.-Y. Yang, B.M. Broom, R.G.W. Verhaak, D.W. Kane, C. Wakefield, J.N. Weinstein, G.B. Mills, H. Liang, TCPA: a resource for cancer func-tional proteomics data. Nat. Methods 10, 1046–1047 (2013) 26. M.J. Kwon, Emerging roles of claudins in human cancer. Int. J.
Mol. Sci. 14, 18148–18180 (2013)
27. P. Storz, Forkhead homeobox type O transcription factors in the responses to oxidative stress. Antioxid. Redox. Signal. 14, 593– 605 (2011)
28. L.M. Coussens, Z. Werb, Inflammation and cancer. Nature 420, 860–867 (2002)
29. A. Wullaert, M.C. Bonnet, M. Pasparakis, NF-κB in the regulation of epithelial homeostasis and inflammation. Cell. Res. 21, 146–158 (2011)
30. K. Vazquez-Santillan, J. Melendez-Zajgla, L. Jimenez-Hernandez, G. Martinez-Ruiz, V. Maldonado, NF-κB signaling in cancer stem cells: a promising therapeutic target? Cell. Oncol. 38, 327 (2015) 31. Y. Shen, L. Zhong, S. Johnson, D. Cao, Human aldo-keto
reduc-tases 1B1 and 1B10: a comparative study on their enzyme activity toward electrophilic carbonyl compounds. Chem. Biol. Interact. 191, 192–198 (2011)
32. I. Cebola, J. Custodio, M. Muñoz, A. Díez-Villanueva, L. Paré, P. Prieto, S. Aussó, L. Coll-Mulet, L. Boscá, V. Moreno, M.A. Peinado, Epigenetics override pro-inflammatory PTGS transcriptomic signature towards selective hyperactivation of PGE2 in colorectal cancer. Clin. Epigenetics 7, 74–84 (2015) 33. J.S. De Groot, X. Pan, J. Meeldijk, E. Van Der Wall, P.J. Van Diest,
C.B. Moelans, Validation of DNA promoter hypermethylation bio-markers in breast cancer— a short report. Cell. Oncol. 37, 297–303 (2014)
34. W. Zhang, H.T. Liu, MAPK signal pathways in the regulation of cell proliferation in mammalian cells. Cell. Res. 12, 9 (2002) 35. K. V Ramana, R. Tammali, and S. K. Srivastava, Inhibition of
aldose reductase prevents growth factor-induced G1-S phase tran-sition through the AKT/phosphoinositide 3-kinase/E2F-1 pathway in human colon cancer cells, Mol. Cancer Ther. 9, 813 (2010) 36. H.C. Hwang, B.E. Clurman, Cyclin E in normal and neoplastic cell
cycles. Oncogene 24, 2776 (2005)
37. R. Tammali, A.B.M. Reddy, A. Saxena, P.G. Rychahou, B.M. Evers, S. Qiu, S. Awasthi, K.V. Ramana, S.K. Srivastava, Inhibition of aldose reductase prevents colon cancer metastasis. Carcinogenesis 32, 1259–1267 (2011)
38. X. Wu, X. Li, Q. Fu, Q. Cao, X. Chen, M. Wang, J. Yu, J. Long, J. Yao, H. Liu, D. Wang, R. Liao, C. Dong, AKR1B1 promotes basal-like breast cancer progression by a positive feedback loop that ac-tivates the EMT program. J. Exp. Med. 214, 1065–1079 (2017) 39. J. Ma, D.-X. Luo, C. Huang, Y. Shen, Y. Bu, S. Markwell, J. Gao, J.
Liu, X. Zu, Z. Cao, Z. Gao, F. Lu, D.-F. Liao, D. Cao, AKR1B10 overexpression in breast cancer: association with tumor size, lymph node metastasis and patient survival and its potential as a novel serum marker. Int. J. Cancer 131, E862–E871 (2012)
40. C. Huang, S. Verhulst, Y. Shen, Y. Bu, Y. Cao, Y. He, Y. Wang, D. Huang, C. Cai, K. Rao, D.F. Liao, J. Jin, D. Cao, AKR1B10 pro-motes breast cancer metastasis through integrinα5/δ-catenin medi-ated FAK/Src/Rac1 signaling pathway. Oncotarget 7, 43779–43791 (2016)
41. Y. Guo, W. Luo, Z. Hu, J. Li, X. Li, H. Cao, J. Li, B. Wen, J. Zhang, H. Cheng, W. Guo, T. Tan, D. Luo, Low expression of Aldo–keto reductase 1B10 is a novel independent prognostic indicator for nasopharyngeal carcinoma. Cell. Biosci. 6, 18 (2016)
42. X. Tang, T.B. Kuhlenschmidt, Q. Li, S. Ali, S. Lezmi, H. Chen, M. Pires-Alves, W.W. Laegreid, T.A. Saif, M.S. Kuhlenschmidt, A
mechanically-induced colon cancer cell population shows increased metastatic potential. Mol. Cancer 13, 131–145 (2014)
43. B.D. Lehmann, J.A. Bauer, X. Chen, M.E. Sanders, A.B. Chakravarthy, Y. Shyr, J.A. Pietenpol, Identification of human triple-negative breast cancer subtypes and preclinical models for selection of targeted therapies. J. Clin. Invest. 121, 2750–2767 (2011)
44. C. Garlanda, F. Riva, E. Bonavita, A. Mantovani, Negative regula-tory receptors of the IL-1 family. Semin. Immunol. 25, 408–415 (2013)
45. A.K. Reddy, P. Uday Kumar, M. Srinivasulu, B. Triveni, K. Sharada, A. Ismail, G. Bhanuprakash Reddy, Overexpression and enhanced specific activity of aldoketo reductases (AKR1B1 & AKR1B10) in human breast cancers. Breast 31, 137–143 (2017) 46. J. Jin, W. Liao, W. Yao, R. Zhu, Y. Li, S. He, J. Ferlay, S.F.
Altekruse, K.A. McGlynn, M.E. Reichman, D. Cao, S.T. Fan, S.S. Chung, B. Laffin, J.M. Petrash, K.A. Matkowskyj, S. Heringlake, M. Woenckhaus, S. Fukumoto, J. Breton, H.B. Yao, J. Ma, H. Yoshitake, Y.T. Chung, C. Wang, N.J. Pyne, K.J. Schmitz, S.Y. Ha, D.X. Luo, J. Jin, Z. Liu, G.K. Balendiran, H.J. Martin, Y. El-Hawari, E. Maser, S. Sato, J. Jin, Q. Zhu, W. Liao, Aldo-keto reductase family 1 member B 10 mediates liver cancer cell prolif-eration through sphingosine-1-phosphate. Sci. Rep. 6, 22746 (2016)
47. H.B. Yao, Y. Xu, L.G. Chen, T.P. Guan, Y.Y. Ma, X.J. He, Y.J. Xia, H.Q. Tao, Q.S. Shao, AKR1B10, a good prognostic indicator in gastric cancer. Eur. J. Surg. Oncol. 40, 318–324 (2014)
48. C. Nakarai, K. Osawa, M. Akiyama, N. Matsubara, H. Ikeuchi, T. Yamano, S. Hirota, N. Tomita, M. Usami, Y. Kido, Expression of AKR1C3 and CNN3 as markers for detection of lymph node me-tastases in colorectal cancer. Clin. Exp. Med. 15, 333–341 (2014) 49. R. Tammali, K.V. Ramana, S.K. Srivastava, Aldose reductase
reg-ulates TNF-alpha-induced PGE2 production in human colon cancer cells. Cancer Lett. 252(299–306) (2007)
50. B. Laffin, J.M. Petrash, Expression of the aldo-etoreductases AKR1B1 and AKR1B10 in human cancers. Front. Pharmacol. 3, 104 (2012)
51. Y. Wang, L. Qi, J. Zhong, H. Qin, J. Ye, S. Lu, L. Ma, B. Xiang, L. Li, X. You, High expression of AKR1B10 predicts low risk of early tumor recurrence in patients with hepatitis B virus-related hepato-cellular carcinoma. Sci. Rep. 7, 42199 (2017)