Identifying the Most Valuable Developers using Artifact
Traceability Graphs
H. Alperen Cetin
Bilkent University Ankara, Turkey [email protected]ABSTRACT
Finding the most valuable and indispensable developers is a crucial task in software development. We categorize these valuable devel-opers into two categories: connector and maven. A typical connector represents a developer who connects different groups of developers in a large-scale project. Mavens represent the developers who are the sole experts in specific modules of the project.
To identify the connectors and mavens, we propose an approach using graph centrality metrics and connections of traceability graphs. We conducted a preliminary study on this approach by using two open source projects: QT 3D Studio and Android. Initial results show that the approach leads to identify the essential developers.
CCS CONCEPTS
• Software and its engineering → Programming teams.
KEYWORDS
traceability, developer categories, social networks, artifact graphs
ACM Reference Format:
H. Alperen Cetin. 2019. Identifying the Most Valuable Developers using Artifact Traceability Graphs . In Proceedings of the 27th ACM Joint European Software Engineering Conference and Symposium on the Foundations of Soft-ware Engineering (ESEC/FSE ’19), August 26–30, 2019, Tallinn, Estonia. ACM, New York, NY, USA,3pages.https://doi.org/10.1145/3338906.3342487
1
RESEARCH PROBLEM
In a typical software project, there are many different roles such as project manager, software architect and software developer. Soft-ware developer is the most prevalent role in a softSoft-ware project, and developer turnover is a critical risk for software projects [10] [17]. Therefore, identifying the valuable and essential developers is a vital and challenging task for project management.
In the book The Tipping Point [12] by Gladwell, the reasons behind word-of-mouth epidemics are discussed. In The Law of Few chapter, he justifies that three kinds of people are responsible for tipping ideas: connector, salesman and maven. Connectors have connections to different social groups, and they allow ideas to spread between these groups. Salesmen have a charisma that allows them to persuade people and change their decisions. Mavens have a great knowledge and thus help people to make informed decisions.
Permission to make digital or hard copies of part or all of this work for personal or classroom use is granted without fee provided that copies are not made or distributed for profit or commercial advantage and that copies bear this notice and the full citation on the first page. Copyrights for third-party components of this work must be honored. For all other uses, contact the owner/author(s).
ESEC/FSE ’19, August 26–30, 2019, Tallinn, Estonia © 2019 Copyright held by the owner/author(s). ACM ISBN 978-1-4503-5572-8/19/08.
https://doi.org/10.1145/3338906.3342487
Since there are traceable links among software artifacts as the connections among people in real life, we propose to use a similar categorization, connector and maven, as described in the book to find the most valuable and indispensable developers in a software project. A typical connector represents a developer who involves in different (sub)projects or different groups of developers. Connect-ing divergent (sub)projects increases the developer’s significance because touching different parts of a project means collective knowl-edge from different fields. Maven category represents the developers who are masters in details of specific modules in the project. Being the rare experts of specific parts of the source code makes these developers difficult to replace. In the following sections, we hypoth-esize that the centrality measures and connections in the artifact traceability graph can be used to determine connectors and mavens.
2
RELATED WORK
Some previous studies examined developer types from different per-spectives. Kosti et al. [15] investigated archetypal personalities of software engineers. They chose extraversion and conscientiousness as their main criteria and focused on the binary combinations of them. Cheng and Guo [7] made an activity-based analysis of Open Source Software (OSS) contributors, then adopted a data-driven approach to find out dynamics and roles of the contributors. Also, Crowston et al. [9] examined core and periphery of OSS team com-munications. Joblin et al. [13] made an empirical study on core and peripheral developers by using count and network metrics. They established evidence that the network-based operationalizations of developer roles outperform count-based operationalizations.
Besides developer types, researchers worked on communication networks of developers. Wu and Goh [19] studied the long term effects of communication patterns on success, and performed exper-iments about how graph centrality, graph density and leadership centrality affect the success of OSS project. Moreover, Allaho and Lee [4] conducted a social networks (SN) analysis on OSS projects, and found that OSS SNs follow a power-law distribution which means a small number of developers dominates the projects. The researchers, also, tried to find how many developers have to quit the project before a it is incapacitated (i.e. truck factor) [5] [8] [18].
3
APPROACH
3.1
Constructing Artifact Traceability Graph
Artifact traceability graphs include software artifacts and the con-nections among them. We denote nodes for developers, change sets (e.g. commits in Git), source files and undirected edges for commits, reviews, includes relations. Developers can commit or review change sets, and change sets can include a set of source files. Figure1shows a sample traceability graph.
ESEC/FSE ’19, August 26–30, 2019, Tallinn, Estonia H. Alperen Cetin
Figure 1: Sample traceability graph. (D: developer)
Figure 2: Constructing developer relation graph by using the sample traceability graph in Figure1. (D: developer)
3.2
Constructing Developer Relation Graph
Let D denote the array of the lengths of all possible different paths (i.e. all possible different distances) between two developers. We define a new metric, Reciprocal of Sum of Reciprocal Distances (RSRD)=hÍD
dd−1
i−1
, to represent the relationship between these two developers. Reciprocals of distances make larger contributions to the score for closer nodes. After summing the contributions of all reciprocal distances, larger values represent a better connection. To use centrality metrics, we need to inverse the result of this summa-tion. At the end, smaller RSRD score represents a closer relationship between two developers. Figure2shows how to construct a devel-oper relation graph with RSRD scores for the example graph in Fig-ure1. For example, the RSRD value between D1 and D2 in Figure2is calculated as following: (2−1+4−1+4−1+4−1)−1= 1 1
2+14+14+14 = 0.8.
3.3
Metric Definitions on Graphs
Freeman [11] discusses that betweenness centrality is related with control of communication. Also, Bird et. al [6] used betweenness centrality to find the gatekeepers in the social networks of mail cor-respondents. Therefore, we hypothesize that betweenness centrality on a developer relation graph can be a measure to find connectors. For maven type, we need to measure developers’ knowledge of the source code. We directly use commit relations between source code files and developers in the artifact traceability graph. We find the files committed by only one developer. Since other developers do not know that file in detail, this relation represents a specific knowledge. Thus, we define mavenness, as the ratio of the number of files changed only by a developer to the total number of files.
High betweenness and mavenness scores would correspond to connectors and mavens respectively. In Figure1, D1 and D2 are the mavens, with mavenness scores of 0.5 for D1, 0.25 for D2 and 0 for others. In Figure2, D1 and D2 have 0.17 (highest) betweenness score; therefore, they are the connectors.
4
CASE STUDY
We mined QT 3D Studio Git repository [1] between Oct 6, 2017 and Jul 6, 2018. The dataset contains 33 developers, 941 commits and 3092 files. Each commit has an author and the changed files.
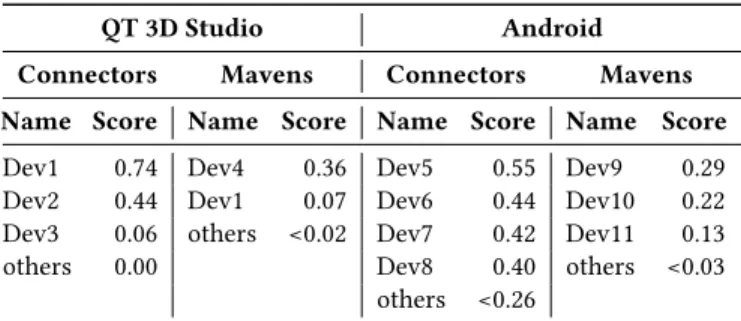
Table 1: Connectors and mavens in the case studies.
QT 3D Studio Android
Connectors Mavens Connectors Mavens
Name Score Name Score Name Score Name Score
Dev1 0.74 Dev4 0.36 Dev5 0.55 Dev9 0.29
Dev2 0.44 Dev1 0.07 Dev6 0.44 Dev10 0.22
Dev3 0.06 others <0.02 Dev7 0.42 Dev11 0.13
others 0.00 Dev8 0.40 others <0.03
others <0.26
Commit messages have reviewer names following Reviewed-by phrase. Secondly, we used the Android dataset mined from Gerrit by Lipcak and Rossi [16]. It includes 372 developers, 4968 commits and 26872 source files from between Oct 24, 2008 and Jan 26, 2012. We constructed the graphs as described in Section 3 by using NetworkX 2.3 [2] for both case studies. Table1shows the scores.
For QT 3D Studio, Dev1 and Dev2 have large betweenness cen-trality scores. Because these scores are calculated on the developer relation graph which has 86% graph density, they show that many shortest paths pass through Dev1 and Dev2. Therefore, they con-nect people who do not have any strong direct relationship, and they are classical connectors. When it comes to mavenness, Dev4 has the largest score. He is the sole committer of 36% of the files in the project. Because of this we argue for that he is an indispensable member of the team and a typical maven.
Showing that the same metrics work for a project with a large number of artifacts is important to validate our approach. In An-droid case study, the density of the developer relation graph is 20% that is to say most developers have no direct relation in the graph and the betweenness scores are high for many developers. There are 13 developers having betweenness scores between 0.11 and 0.55, but we can say that the first 4 developers Dev5, Dev6, Dev7 and Dev8 are the connectors because of their higher betweenness cen-trality values. Also, %64 of source files in the project are committed by Dev9, Dev10 and Dev11; therefore, they are mavens.
There is no ground truth or findings about the same categoriza-tion on the same datasets to compare our results, however we can say that our findings correspond to the conclusions of Allaho and Lee [4]. They claim that the OSS SNs follow a power-law distribu-tion, and our results show that a small group of developers pervade and dominate the project. Also, Agrawal et al. [3] assert that most projects, particularly medium to large projects, depend on hero developers which are mavens and connectors in our case.
5
FUTURE WORK
Although we conducted two case studies with thousands of com-mits and hundreds of developers, our method and metrics cannot be generalized. As future work, we recommend to (1) make further case studies for both OSS and proprietary projects by using simi-lar categorization described in this paper and datasets with more artifact data such as issue and test history; (2) conduct a survey among developers to find the golden set of mavens and connectors to validate this approach; (3) cluster developers using traceabil-ity graph and find categories by interpreting the clusters; and (4) use graph convolutional networks to classify developer nodes in a semi-supervised manner [14].
Identifying the Most Valuable Developers using Artifact Traceability Graphs ESEC/FSE ’19, August 26–30, 2019, Tallinn, Estonia
REFERENCES
[1] 2018. QT 3D Studio. https://code.qt.io/cgit/qt3dstudio/qt3dstudio.git/
[2] 2019. NetworkX 2.3. https://networkx.github.io/
[3] Amritanshu Agrawal, Akond Rahman, Rahul Krishna, Alexander Sobran, and Tim Menzies. 2018. We don’t need another hero?: the impact of heroes on software development. In Proceedings of the 40th International Conference on Software Engineering: Software Engineering in Practice. ACM, 245–253.
[4] Mohammad Y Allaho and Wang-Chien Lee. 2013. Analyzing the social ties and structure of contributors in open source software community. In Proceedings of the 2013 IEEE/ACM International Conference on Advances in Social Networks Analysis and Mining. ACM, 56–60.
[5] Guilherme Avelino, Leonardo Passos, Andre Hora, and Marco Tulio Valente. 2016. A novel approach for estimating truck factors. In 2016 IEEE 24th International Conference on Program Comprehension (ICPC). IEEE, 1–10.
[6] Christian Bird, Alex Gourley, Prem Devanbu, Michael Gertz, and Anand Swami-nathan. 2006. Mining email social networks. In Proceedings of the 2006 interna-tional workshop on Mining software repositories. ACM, 137–143.
[7] Jinghui Cheng and Jin LC Guo. 2019. Activity-Based Analysis of Open Source Software Contributors: Roles and Dynamics. arXiv preprint arXiv:1903.05277 (2019).
[8] Valerio Cosentino, Javier Luis Cánovas Izquierdo, and Jordi Cabot. 2015. Assessing the bus factor of Git repositories. In 2015 IEEE 22nd International Conference on Software Analysis, Evolution, and Reengineering (SANER). IEEE, 499–503. [9] Kevin Crowston, Kangning Wei, Qing Li, and James Howison. 2006. Core and
periphery in free/libre and open source software team communications. In Pro-ceedings of the 39th Annual Hawaii International Conference on System Sciences (HICSS’06), Vol. 6. IEEE, 118a–118a.
[10] Mívian Ferreira, Marco Tulio Valente, and Kecia Ferreira. 2017. A compari-son of three algorithms for computing truck factors. In Proceedings of the 25th International Conference on Program Comprehension. IEEE Press, 207–217. [11] Linton C Freeman. 1978. Centrality in social networks conceptual clarification.
Social networks 1, 3 (1978), 215–239.
[12] Malcolm Gladwell. 2000. The Tipping Point : How Little Things Can Make a Big Difference. Little, Brown and Company, Chapter 2.
[13] Mitchell Joblin, Sven Apel, Claus Hunsen, and Wolfgang Mauerer. 2017. Clas-sifying developers into core and peripheral: An empirical study on count and network metrics. In 2017 IEEE/ACM 39th International Conference on Software Engineering (ICSE). IEEE, 164–174.
[14] Thomas N Kipf and Max Welling. 2016. Semi-supervised classification with graph convolutional networks. arXiv preprint arXiv:1609.02907 (2016).
[15] Makrina Viola Kosti, Robert Feldt, and Lefteris Angelis. 2016. Archetypal person-alities of software engineers and their work preferences: a new perspective for empirical studies. Empirical Software Engineering 21, 4 (2016), 1509–1532. [16] Jakub Lipcak and Bruno Rossi. 2018. A Large-Scale Study on Source Code
Reviewer Recommendation. In 2018 44th Euromicro Conference on Software Engi-neering and Advanced Applications (SEAA). IEEE, 378–387.
[17] Audris Mockus. 2010. Organizational volatility and its effects on software de-fects. In Proceedings of the eighteenth ACM SIGSOFT international symposium on Foundations of software engineering. ACM, 117–126.
[18] Peter C Rigby, Yue Cai Zhu, Samuel M Donadelli, and Audris Mockus. 2016. Quantifying and mitigating turnover-induced knowledge loss: Case studies of Chrome and a project at Avaya. In 2016 IEEE/ACM 38th International Conference on Software Engineering (ICSE). IEEE, 1006–1016.
[19] Jing Wu and Khim Yong Goh. 2009. Evaluating longitudinal success of open source software projects: A social network perspective. In 2009 42nd Hawaii International Conference on System Sciences. IEEE, 1–10.