© TÜBİTAK
doi:10.3906/elk-1808-63 h t t p : / / j o u r n a l s . t u b i t a k . g o v . t r / e l e k t r i k /
Research Article
Particle swarm optimization-based collision avoidance
Timur İNAN1∗,, Ahmet Fevzi BABA2,
1Department of Computer Programming, Vocational School, İstanbul Arel University, İstanbul, Turkey 2Department of Electrics-Electronics Engineering, Faculty of Technology, Marmara University, İstanbul, Turkey
Received: 07.08.2018 • Accepted/Published Online: 08.01.2019 • Final Version: 15.05.2019
Abstract: Collision risk assessment and collision avoidance of vessels have always been an important topic in ocean
engineering. Decision support systems are increasingly becoming the focus of many studies in the maritime industry today as vessel accidents are often caused by human error. This study proposes an anticollision decision support system that can determine surrounding obstacles by using the information received from radar systems, obtain the position and speed of obstacles within a certain time period, and suggest possible routes to prevent collisions. In this study we use a neural network to predict the subsequent positions of surrounding vessels, a fuzzy logic system to obtain the risk of collision, and a particle swarm optimization algorithm to find the safe and shortest path for collision avoidance.
Key words: Particle swarm optimization, collision avoidance, collision risk assessment, neural network, fuzzy
1. Introduction
Collision risk assessment and collision avoidance of vessels are both equally significant subjects in the field of ocean engineering. For safe navigation, it is necessary to calculate the collision possibility of a vessel with surrounding vessels and to take measures against these odds. Since 84%–88% of all tanker accidents are caused by human error, employing decision support systems has become very popular in recent years. Human error also accounts for 79% of towing vessel groundings and 89%-–96% of vessel collisions [1]. Therefore, collision avoidance is an important subject for safe navigation. In the literature, there are many studies conducted on prevention of vessel collisions. Liu et al. presented a fuzzy-neural system to determine a vessel’s possible action, turning angle, and time frame for action to prevent collisions [2]. Zhuo et al., on the other hand, proposed an anticollision decision-making support system that utilizes a vessel mathematical model to evaluate the maneuvering conditions of the vessel. The researchers employed an adaptive neuro-fuzzy inference system (ANFIS) network to obtain when and where to take action for maneuvering and implemented this on various scenarios [3]. Ahn et al. presented a study on the collision avoidance of a vessel using neural networks and fuzzy logic. This study involved a fuzzy and a neural network to identify the optimal collision avoidance route. The study also compared fuzzy and neural network results in order to find the optimal route [4]. Another study conducted by Simsir et al. proposed a vessel traffic system-based collision avoidance system for the Bosphorus Strait in İstanbul. In their study, the authors put forward a collision avoidance system that uses a neural network trained by information on the vessels’ previous passages (route, heading, speed, etc.) to predict and prevent collisions [5]. In a similar study, Perera et al. proposed an on-board collision avoidance system for critical collision situations through a fuzzy method [6]. Researchers also proposed an intelligent fuzzy-Bayesian-∗Correspondence: [email protected]
based navigation system for collision detection and avoidance [7]. Zhou et al. in another study suggested a system that aims to minimize the bunker consumption of vessels while maneuvering to prevent collisions. The system uses the vessel domain to calculate risk magnitude and figure out collision avoidance routes [8]. Optimization algorithms, and more specifically genetic algorithm and colony algorithms, have also been used in many studies to identify the optimal route in collision situations. Smierzchalski et al. in their study used an evolutionary algorithm to figure out the optimal routes for collision avoidance [9]. In another study, Zeng et al. offered a collision prevention model by using a genetic algorithm. In their study, the authors used radar-based information to calculate the risk magnitude, a Markov–based model to predict the coordinates, and a genetic algorithm to find the optimal route [10]. Ito et al. in their research also used a genetic algorithm to find the optimal routes for collision avoidance [11]. Tsou et al. offered a decision support system based on a genetic algorithm that uses an automatic radar plotting aid (ARPA) system for collecting environmental information such as speed, direction, and route of obstacle vessels [12]. Smierzchalski proposed a modified genetic algorithm for the trajectory planning of vessels in traffic areas [13]. Another study conducted by Tsou et al. suggested a system that uses an ant colony algorithm to find the optimal collision prevention route [14]. Lazarowska also proposed an ant colony-based navigational decision support system [15]. Chen et al. proposed a system that uses an artificial fish swarm algorithm and AIS data to prevent collisions of vessels [16]. Fang et al. proposed a study on prevention of collisions in heavy traffic areas. In the study, the authors used a six-dimensional maneuvering modeling group (MMG) model to simulate the ship’s motion [17]. To summarize, for collision risk assessment and collision avoidance, fuzzy-based systems, neural networks, ship domains, genetic algorithms, and ant colony algorithms are all used and claimed to be successful. In this study, we propose a system that consists of four main parts: a radar system to find obstacles around a vessel, a neural network to predict the vessel’s next positions, a fuzzy system to calculate the risk magnitude, and a particle swarm optimization-based collision avoidance system to identify an anticollision route. Detailed explanations are given in Section 2.
1.1. Radar system
To simulate the vessel’s own movement and target vessels around the perimeter, a mathematical model of the vessel was used. The mathematical model employed was presented by Fossen [18]. The radar simulation system plots the surrounding obstacles and stores their voyage information until the obstacles are visible in the scanning area. The radar system can be seen in Figure 1.
When the complete system is applied to a vessel, the movement of the vessel will not match the
mathematical model used, because of the fact that the mathematical model was prepared for a specific vessel and every vessel has its own specifications (length, breadth, speed, draft, etc.). In order to overcome this problem, an artificial neural network, which can be trained by using the information obtained from the radar, should be established for the vessel where the system is applied. For this purpose, a system has been developed that can predict the vessel’s location in 1-s intervals. In order to train the artificial neural network, the model was cruised at random departure and destination ports at random speeds. During the navigation of the vessel, target vessels traveling to and from random departure and destination ports at random speeds were added. The navigation information obtained was then recorded in a database. The overall scheme can be seen in Figure 2.
Figure 2. The overall scheme of the system.
1.2. Collision risk assessment
In order to determine the level of risk, the vessels were moved using the artificial neural network in order to calculate the closest transit distance (DCPA) and the closest transit time in which they would arrive (TCPA), where DCPA stands for distance of the closest point of approach and TCPA time to the closest point of approach [3]. To complete the risk assessment, a Mamdani-type fuzzy system that calculates the risk magnitude was created. A detailed explanation of the system can be found in Section 2. The testing window of the risk assessment is presented in Figure 3, which shows that the system was installed, then navigated from the port of
Stratoni to the port of Akra-Kavonisi. The vessels that appear in red are those with a superior status according to the International Regulations for Preventing Collisions at Sea (COLREGs), while the vessels in black are those without. In this study, the target vessel’s situation, the situation of the vessel with the installed system, and decision columns were used to determine the transition rule according to COLREGs. A detailed explanation is given in the Section 2.
Figure 3. Risk assessment and collision avoidance testing system.
1.3. Collision avoidance system
Once the risk of colliding with any of the surrounding vessels has been calculated, the route of the vessel under study must be altered to prevent collision. After the alteration of the route of the ship, it must maintain a certain distance from other ships or stay clear from them completely and must not deviate from the new route. A survey of the literature shows that algorithms such as artificial neural networks, fuzzy algorithms, and genetic and ant colony algorithms have been widely used to identify the optimal route. This study, on the other hand, uses the particle swarm optimization method. The structure and details of the algorithm are presented in the Section 2. After finding the optimal route, the results are shown in the “Collision Avoidance Decision” section of Figure 3.
2. Methods
In this study, an artificial neural network was used to estimate the subsequent positions of the obstacles, fuzzy logic was used for collision risk assessment, and particle swarm optimization was used for collision avoidance. Furthermore, a genetic algorithm and ant colony algorithm were utilized for collision avoidance to draw a comparison between the methods. The system can provide optimal route recommendations for two–vessel crossings or multiple–vessel crossings.
2.1. Estimation of subsequent positions
In this study, a neural network was created in order to estimate the subsequent positions. As explained in Section 1 and in Figure 2, the navigation information of the studied vessel and the target vessels was recorded into a database. To be able to create position estimates of the studied vessel and target vessels, the data accumulated in the database were used. The generated artificial neural network is a nonlinear autoregressive (NARX) type of neural network. The Levenberg–Marquardt algorithm was then used to train the artificial neural network [19]. For this, 70% of the information obtained from the operation of the radar system was used for training, 15% for verification, and 15% for testing purposes. The network uses 50 hidden neurons to make predictions. The tan-sigmoid transfer function was employed for the hidden layers, while a linear transfer function was used for the output layers. The network created can be seen in Figure 4. This network has two
Figure 4. Network architecture.
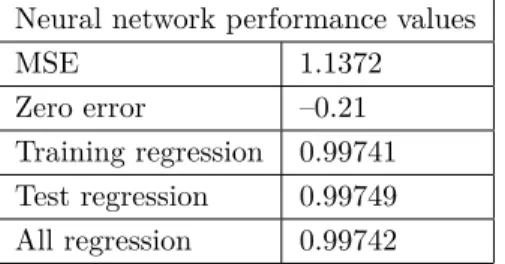
inputs and two outputs. The inputs include the vessel’s route and speed data while the outputs contain the vessel’s displacement for latitude and longitude. As seen in Figure 4, the network was turned into a closed loop network to make predictions based on the previous ones. Performance analysis, error histograms, and regression analysis were then employed to measure the accuracy of the artificial neural network; these values are shown in Table 1.
Table 1. Network performance values. Neural network performance values
MSE 1.1372
Zero error –0.21
Training regression 0.99741 Test regression 0.99749 All regression 0.99742
The fact that the MSE (mean squared error) is very close to 1 indicates that the error is relatively small. When the error histogram is examined, it can be seen that the error usually occurred at –0.21, which means that the error value is very low.
2.2. Fuzzy risk assessment
As mentioned in the Section 1, it is necessary to calculate the DCPA and TCPA at which the vessels in the vicinity will approach the studied vessel in order to perform the risk assessment. The TCPA and DCPA values were calculated as explained in Algorithm 1.
Algorithm 1 How to determine TCPA and DCPA.
set previousdistance to a large number (for example 106); set actualdistance to a smaller number than actual distance; set time to 0;
while actualdistance <previousdistance do
previousdistance =actualdistance;
move the studied vessel and target vessel using neural network; calculate actualdistance;
time++;
end while
dcpa= actualdistance; tcpa =time;
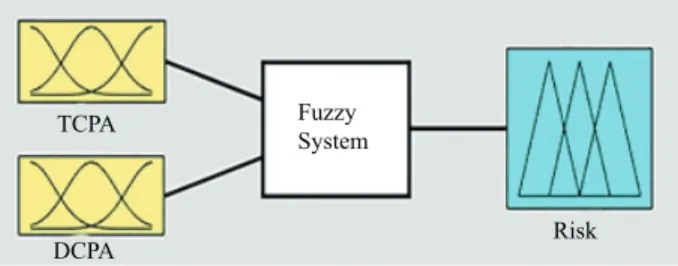
At this point, a risk factor must be established by using the TCPA and DCPA values. Therefore, a Mamdani-type fuzzy system was used to calculate the risk magnitude [20]. The risk magnitude value should be between 0 and 1, where 0 represents the lowest risk and 1 the highest risk. The TCPA and DCPA values were then fed as inputs into the fuzzy logic system through fuzzification. The overall scheme of the fuzzy system can be seen in Figure 5.
Figure 5. Fuzzy system for risk assessment.
The fuzzification of the TCPA and DCPA values, defuzzification of the risk magnitude value, and the surface of the system can be seen in Figure 6.
The abbreviations used for the fuzzy system inputs and output are explained in Table 2.
2.3. COLREGs
The International Regulations for Preventing Collisions at Sea, also known as COLREGs, is a set of rules that all vessels at sea must comply with during their voyages. It is these international rules that determine the vessels with superior status and which ones are subject to course alteration. As seen in Figure 8, each vessel is represented by a red color on the port side and a green color on the starboard side. If the fore of the vessel is assumed to be 0 degrees and the target vessel is located between 350◦ and 10◦ relative to the studied vessel, then this means that the target vessel can see the fore light. However, if the target vessel is located between 247.5◦ and 350◦ then this means it sees the red light. If it is located between 247.5◦ and 112.5◦ then the aft light is seen, and if it is located between 10◦ and 112.5◦, then it can see the green light. The evaluations were conducted assuming the studied vessel and the target vessels were acting in compliance with international transitional rules. According to the COLREGs, in a risky situation:
Figure 6. Parameters of fuzzy system.
Table 2. Abbreviations used in fuzzy risk assessment system. Abbreviations
TCPA DCPA RISK
SZ Small Time SM Small Distance LR Low Risk
SMZ Small to Medium
Time SMM
Small to Medium
Distance LMR Low to Medium Risk
MZ Medium Time MM Medium Distance MR Medium Risk
MLZ Medium to Large Time MLM Medium to Large Distance MHR Medium to High Risk
LZ Large Time LM Large Distance HR High Risk
HHR High to Very High Risk VHR Very High Risk
• If any vessel sees another vessel’s red light, its route must be changed to avoid collision. • If any vessel sees the aft light of another vessel, its route should be changed to avoid collision.
. .
. .
Figure 7. Vessel navigation lights, top view.
Table 3. Decisions to be made by the vessel under study related to vessel positions. Target vessel
1 2 3 4
Studied vessel
1 Give way Steady Give way Give way 2 Give way Steady Give way Give way
3 Steady Steady Steady Give way
4 Steady Steady Give way Steady
2.4. Particle swarm optimization
Particle swarm optimization is an optimization method based on the behaviors of a multiple-member swarm during a food search [21]. Every particle has its own coordinate, speed, and fitness values. In every iteration, all particles test their fitness function by using their own coordinate and speed values. At the end of every iteration, all particles update their positions (pBest). The fitness values of all particles are compared in order to identify the swarm’s best possible position (gBest). The pBest and gBest values are used to establish the particle’s new coordinate and speed values to test the next fitness situation as explained in Eq. (1) and (2).
vin= vin+ c1∗ r1∗ (pBestn− pActualn) + c2∗ r2∗ (gBesti− pActualn) (1)
xin= xin+ vin (2)
Here, vin denotes the speed of the n th particle in the ith iteration, whereas c1 denotes the effect coefficient of particle’s best position on the particle’s new speed. r1 is a weight value that determines the final effect of the best position of the particle and is a random number between 0 and 1. c2 represents the effect coefficient of the swarm’s best position to the new speed. r2 is the weight value that determines the final effect of the best position of the swarm and is a random number between 0 and 1. pBestn represents the nth particle’s best position, pActualn presents the nth particle’s actual position, and gBesti is the swarm’s best position at the ith iteration. To determine the shortest path using PSO, the position parameter is decoded into a priority array. The number of elements in the priority array is equal to the sum of all nodes. In order to solve the
collision avoidance problem by using the PSO algorithm, a safe area of 0.2 nautical miles in radius was created around the target by determining the target’s collision location. Then a circle was drawn with its center on the collision point, and the circle’s radius was set to the distance between the studied vessel and the collision point. The position of the studied vessel was established as the starting point, and the opposite side of the circle was the finishing point. Then random points were created between these two points. The next step was to find the
Algorithm 2 Algorithm for PSO collision avoidance. for i = 1 to numberofparticles do
for j = 1 to numberofnodes do
particle(i).speedarray(j)=Random number between −1 and +1
end for
particle(i). c1=Random number between 0 and 1 particle(i). c2=particle(i).c1∗ 2
particle(i). r1=Random number between 0 and 1 particle(i). r2=Random number between 0 and 1
for j = 1 to numberofnodes do
particle(i).priorityarray(j)=Random number between −100 and +100
end for end for
define mostsuccesfullparticle with a high score to save best solutions
for i = 1 to iterationnumber do for j = 1 to numberofparticles do
particle(j).path=startingpoint
while particle(j).path(end) ! = f inishingpoint do
find the node that is not in path
array and has the maximum priority and add it to path array
end while
if particle(j).path intersects target vessel’s safe circle then
particle(j).score=106; end if if particle(j).score<particle(j).bestscore then particle(j).bestscore=particle(j).score particle(j).pBest=particle(j).priorityarray end if end for
calculate the best particle
if bestparticle.score<mostsuccesfullparticle.score then
mostsuccesfullparticle=bestparticle
end if
update all particles’ speeds and priority arrays according to Eqs. (1) and (2)
end for
shortest path from the starting point to the ending point without entering the safe area of the target. To be able to discover the shortest way, the method proposed by Mohemmed et al. was used [22]. Each particle has a node array that could be considered its own shortest path, and its own priority array, which represents the effect of each node on finding the shortest path. All particles have their own speed array, c1, c2, r1, r2, and priority array values. The algorithm is explained in Algorithm 2.
3. Results
The system proposed in this study was created using object-oriented programming logic with the MATLAB environment. The computer that ran the system had a Windows operating system, an Intel core i7 processor at 3.6 Ghz, and 8 GB RAM. The collision avoidance system was tested for various transit conditions of the vessels. The positions and routes of the vessels were calculated and shown relative to true north. The letter W over the figures denotes the way-point of the studied vessel with the tested system installed.
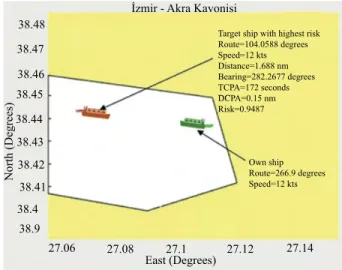
3.1. Scenario 1
The first scenario can be seen in Figure 8. The studied vessel is departing the port of İzmir for the port of Akra Kavonisi. The studied ship is on a course of 266.9◦ and has a speed of 12 knots. The target vessel, on the other hand, is on a course of 104.08◦ and proceeds at the speed of 12 knots. In Figure 9, the maneuvering points are shown in sequential order in Figures 9a–9f for both the studied vessel and the target vessel.
Figure 8. Scenario 1.
3.2. Scenario 2
As can be seen in Figure 10, the studied vessel is leaving the Pachi-Oil Terminal for the port of Akra Kavonisi on a course of 130.96◦ with a speed of 12 knots, while target vessels are approaching the port. The riskiest vessel is on a course of 314◦ and has a speed of 10.22 knots, but will begin maneuvering for the new way-point before the point of collision. Therefore, there is no need to calculate a new route. The route recommendation shows the way to the maneuvering point. The way-points for the anticollision route can be seen in Figures 11a and 11b.
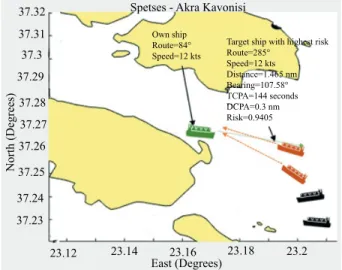
3.3. Scenario 3
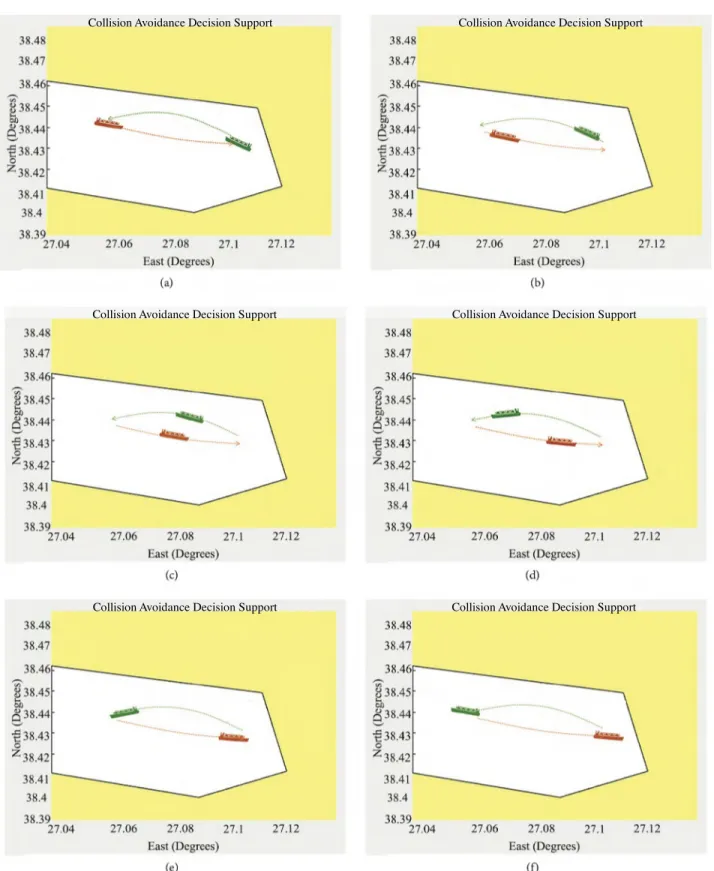
As can be seen in Figure 12, the studied vessel is departing from the port of Spetses for the port of Akra Kavonisi on a course of 84◦ with a speed of 12 knots. The target vessel is heading to the port of Spetses on a course of 284.97◦ and has a speed of 12 knots. The studied vessel alters its course to starboard since a port-to-port passage is advised by the system. Even though the image shows the vessel as close to land, the closest distance to land is observed as 0.3 nautical miles. The way-points for the anticollision route can be seen in Figures 13a–13d.
Collision Avoidance Decision Support Collision Avoidance Decision Support Collision Avoidance Decision Support Collision Avoidance Decision Support
Collision Avoidance Decision Support Collision Avoidance Decision Support
Figure 10. Scenario 2.
Figure 11. (a) Way-point 1, (b) Way-point 2 for Scenario 2.
Collision Avoidance Decision Support Collision Avoidance Decision Support Collision Avoidance Decision Support Collision Avoidance Decision Support
Figure 13. (a) Way-point 1, (b) Way-point 2, (c) Way-point 3, (d) Way-point 4 for Scenario 3.
3.4. Scenario 4
As can be seen in Figure 14, the studied vessel is leaving the port of Kalimnos for the port of Akra Kavonisi. The vessel is on a route of 144.49◦ and has a speed of 12 knots. The target vessel is also leaving the port of Kalimnos, on a course of 139.93◦, and has a speed of 11 knots.
According to COLREGs, if a vessel is approaching another vessel from the aft, it must keep clear from the port or starboard side. As can be seen in Figures 15a–15d, the collision avoidance system keeps the studied vessel from colliding and calculates the way to the next way-point.
3.5. Scenario 5
The system presented in this study has also been used for multivessel collision avoidance. When collision avoidance is calculated for more than one vessel, a more complex problem arises. When the optimal route is being calculated with PSO, the vessels surrounding the studied ship move when the studied ship moves in order to maintain their proximity to each other. The duration for calculating the collision avoidance route is longer when there are multiple vessels nearby due to the complexity of the calculation. Figure 16 shows a collision avoidance scenario with several vessels.
The studied vessel leaves the port of Kuşadası for the port of Akra Kavonisi on a course of 230.5◦ with a speed of 11.3 knots. In this scenario there are two risky vessels that are following each other on a course of 50.49◦. The speed of both vessels is 12 knots. The way-points for the anticollision route can be seen in Figures 17a–17e.
4. Discussion
The aim of the system presented in this study was to prevent possible collisions between vessels. The system was successfully tested on different scenarios as seen in Section 3. Since the system uses a ship model, the routes obtained in this study can be considered suitable for vessel maneuvering behavior. In order to prove that the PSO algorithm is effective in collision avoidance, the ant colony algorithm and the genetic algorithm were also used to confirm the results (Figure 18). As can be seen in Figure 18, the vessel under study departs the port of Bodrum, while the target vessel is moving towards the port.
To compare the success of the algorithms, the scenario in Figure 18 was applied using the above-mentioned three algorithms with different individual numbers. The calculations were then performed using different individual numbers for all algorithms. The termination criterion was set to the same figures with the top 5 most successful outcomes for all algorithms. The best results of the three algorithms were then saved based on the distance and the number of iterations. As a result of the calculations, it was observed that the proposed PSO algorithm gave shorter paths than the proposed genetic and ant colony algorithms. The comparison of the results can be seen in Table 4 and Figure 19. In Table 4, PSO represents the particle swarm optimization algorithm, GA the genetic algorithm, and ACO the ant colony optimization algorithm.
The number of iterations computed by the algorithms to find the best results were recorded and are shown in Figure 19. As can be seen in Figure 19, the PSO algorithm was the most successful algorithm in calculations with varying individual numbers, in an average of 10 iterations.
5. Conclusion
In light of the information obtained from the radar simulation, this study proposes a calculation system that can compute the possibility of colliding with vessels in the vicinity and offer route advice to eliminate the risk of collision. The PSO algorithm was used to calculate how to perform collision avoidance maneuvers in the
Figure 15. (a) Way-point 1, (b) Way-point 2, (c) Way-point 3, (d) Way-point 4 for Scenario 4.
Figure 17. (a) Way-point 1, (b) Way-point 2, (c) Way-point 3, (d) Way-point 4, (e) Way-point 5 for Scenario 5.
project. As described in detail in the previous sections, the PSO algorithm was proved to be successful and the measurements were indicated in graphical form. For the system to function on an actual vessel, the artificial
Figure 18. A collision case for comparison of algorithms. .
. .
Figure 19. Comparison of the algorithms.
neural network should be trained by connecting the radar and the GPS devices instead of the proposed radar simulation system and by cruising the vessel. When the radar and GPS connections are made, the system is considered feasible in real life. It is also possible to use a programming language other than MATLAB that can in turn slightly increase the speed of the system and improve the speed of visual operations (such as map operations). In future studies, the plan is to calculate the collision maneuvering under different wind, wave, and current parameters by adding environmental factors to the system.
Table 4. Comparison of the algorithms through shortest anticollision route and iteration number to find the best solution. Anticollision route distance (miles) Number of iterations to best solution of algorithm
Individuals PSO ACO GA PSO ACO GA
5 2.3 3.56 5 13 42 14
10 2.3 3.56 2.4 10 12 13
15 2.3 3.24 2.4 8 10 13
20 2.3 3.24 2.4 8 10 12
References
[1] Apostol-Mates R, Barbu A. Human error-the main factor in marine accidents. “Mircea cel Batran” Naval Academy Scientific Bulletin 2016; 19 (2): 451-454. doi: 10.21279/1454-864X-16-I2-068
[2] Liu Y, Shi C. A fuzzy-neural inference network for ship collision avoidance. In: International Conference on Machine Learning and Cybernetics Conference; Guangzhou, China; 2005. pp. 4754-4759. doi: 10.1109/ICMLC.2005.1527778 [3] Zhuo Y, Hearn GE. A ship based intelligent anti-collision decision-making support system utilizing trial manoeuvres. In: Chinese Control and Decision Conference; Yantai China; 2008. pp. 3982-3987. doi: 10.1109/CCDC.2008.4598079 [4] Ahn J, Rhee K, You Y. A study on the collision avoidance of a ship using neural networks and fuzzy logic. Applied
Ocean Research 2012; 37: 162-173. doi: 10.1016/j.apor.2012.05.008
[5] eSimsir U, Amasyali M, Bal M, Celebi U, Ertugrul S. Decision support system for collision avoidance of vessels. Applied Soft Computing 2014; 25: 369-378. doi: 10.1016/j.asoc.2014.08.067
[6] Perera LP, Carvalho J, Soares G. Fuzzy logic based decision making system for collision avoidance of ocean navi-gation under critical collision conditions. Marine Science and Technology 2011; 16 (1): 84-99. doi: 10.1007/s00773-010-0106-x
[7] Perera LP, Carvalho J, Soares G. Intelligent ocean navigation and fuzzy-Bayesian decision/action formulation. IEEE Journal of Oceanic Engineering 2012; 37 (2): 204-219. doi: 10.1109/JOE.2012.2184949
[8] Zhou K, Chen J, Liu X. Optimal collision-avoidance manoeuvres to minimise bunker consumption under the two-ship crossing situation. Journal of Navigation 2018; 71 (1): 151-168. doi: 10.1017/S0373463317000534
[9] Smierzchalski R, Michalewicz Z. Modeling of ship trajectory in collision situations by an evolutionary algorithm. IEEE Transactions on Evolutionary Computation 2000; 4 (3): 227-241. doi: 10.1109/4235.873234
[10] Zeng X, Ito M. Planning a collision avoidance model for ship using genetic algorithm. In: IEEE International Confer-ence on Systems, Man and Cybernetics; Tucson, AZ, USA; 2001. pp. 2355-2360. doi: 10.1109/ICSMC.2001.972909 [11] Ito M, Zhang F, Yoshida N. Collision avoidance control of ship with genetic algorithm. In: IEEE International Conference on Control Applications; Kohala Coast, HI, USA; 1999. pp. 1791-1796. doi: 10.1109/CCA.1999.801243 [12] Tsou M, Kao S, Su C. Decision support from genetic algorithms for ship collision avoidance route planning and
alerts. Journal of Navigation 2010; 63 (1): 167-182. doi: 10.1017/S037346330999021X
[13] Smierzchalski R. Evolutionary trajectory planning of ships in navigation traffic areas. Journal of Marine Science and Technology 1999; 4 (1): 1–6. doi: 10.1007/s007730050001
[14] Tsou M, Hsueh C. The study of ship collision avoidance route planning by ant colony algorithm. Journal of Marine Science and Technology 2010; 18 (5): 746-756.
[15] Lazarowska A. Ant colony optimization based navigational decision support system. In: 18th International Confer-ence on Knowledge-Based and Intelligent Information & Engineering Systems - KES2014; Gdynia, Poland; 2014. pp. 1013-1022. doi: 10.1016/j.procs.2014.08.187
[16] Chen P, Shi G, Liu S, Zhang Y. Decision support based on artificial fish swarm for ship collision avoidance from AIS data. In: International Conference on Machine Learning and Cybernetics; Chengdu, China; 2018. pp. 31-36. doi: 10.1515/pomr-2016-0058
[17] Fang M, Tsai K, Fang C. A simplified simulation model of ship navigation for safety and collision avoidance in heavy traffic areas. Journal of Navigation 2018; 71 (4): 837-860. doi: 10.1017/S0373463317000923
[18] Fossen TI. Mathematical models of ships and underwater vehicles. In: Baillieul J, Samad T (editors). Encyclopedia of Systems and Control. London, UK: Springer London, 2013. pp. 1-9.
[19] Marquardt DW. An algorithm for least-squares estimation of nonlinear parameters. Journal of the Society for Industrial and Applied Mathematics 1963; 11 (2): 431-441. doi: 10.1137/0111030
[20] Zadeh LA. Fuzzy sets. Information and Control 1965; 8 (3): 338-353. doi: 10.1016/S0019-9958(65)90241-X [21] Kennedy J, Eberhart R. Particle swarm optimization. Neural Networks 1995; 4: 1942-1948. doi:
10.1109/ICNN.1995.488968
[22] Mohemmed A, Sahoo N, Geok T. Solving shortest path problem using particle swarm optimization. Applied Soft Computing 2008; 8 (4): 1643-1653. doi: 10.1016/j.asoc.2008.01.002