i
PERFORMANCE ANALYSIS OF TURKISH MUTUAL
FUNDS & RELATIONSHIP BETWEEN COMMISSIONS
AND PERFORMANCE
ALĠ CAN KAYA
108664012
ĠSTANBUL BĠLGĠ ÜNĠVERSĠTESĠ
SOSYAL BĠLĠMLER ENSTĠTÜSÜ
ULUSLARARASI FĠNANS YÜKSEK LĠSANS PROGRAMI
TEZ DANIġMANI : PROF. DR. ORAL ERDOĞAN
2010
ii
PERFORMANCE ANALYSIS OF TURKISH MUTUAL FUNDS & RELATIONSHIP BETWEEN COMMISSIONS AND PERFORMANCE
TÜRK YATIRIM FONLARININ PERFORMANS ANALĠZĠ VE KOMĠSYON ORANLARI ĠLE ĠLĠġKĠSĠ
ALĠ CAN KAYA 108664012
Tez DanıĢmanının Adı Soyadı (ĠMZASI) : PROF.DR. ORAL ERDOĞAN Jüri Üyelerinin Adı Soyadı (ĠMZASI) : DR. ENGĠN KURUN
Jüri Üyelerinin Adı Soyadı (ĠMZASI) : KENAN TATA
Tezin Onaylandığı Tarih : 11/11/2010
Toplam Sayfa Sayısı : 55
Anahtar Kelimeler (Türkçe) Anahtar Kelimeler (Ġngilizce)
1) Mutual Fund 1) Yatırım Fonu
2) Commission 2) Komisyon
3) Performance 3) Performans
4) Selective Ability 4) Seçme Yeteneği
iii
Özet
Bu çalıĢmada yatırım fonlarının komisyon oranlarının fon performansına
etkisi incelenmiĢtir. Performans ölçütü olarak fon yöneticilerinin zamanlama ve seçicilik yetenekleri hesaplanılmıĢ, sonrasında bu veriler fonların komisyonları ile karĢılaĢtırılmıĢtır. Sonuç olarak fon yöneticilerinin
sadece bir kısmının kaynaklarını performansa çevirme konusunda baĢarılı olduğu gözlemlenmiĢtir.
iv
Abstract
This paper aims to analyze the performance of Turkish A Type mutual
funds in terms of market timing and selectivity, and investigate any possible
relationship between the performance and commissions of mutual funds.
Drawing on monthly data from 2001-2009, the analysis does not show a
strong relation between micro and macro forecasting skills of fund
managers and the commission fee rates of the respective funds which
implies that not all the fund managers are able to convert extra resources
v
Table of Contents
Abstract ………... iv
Table of Contents ………... v
List of Tables ………... vi
List of Figures ... vii
List of Abbreviations ... viii
1. Introduction …:..……….……... 1
1.1 Institutional Investments…………... 3
1.2 Mutual Funds ..….………...…... 8
1.3 Commission Fees of Mutual Funds ...………... 11
1.4 Taxation of Institutional Investments ……….…... 13
2. Literature Review……….. 15
3. Empirical Test: Market Timing and Asset Selection Abilities of Turkish Mutual Funds ... 22
3.1 Data ...………... 22 3.2 Methodology………... 23 3.3 Results ………... 29 4. Conclusion ………...………... 38 References ………...…… 41 Appendices...…... 44
vi
List of Tables
Table 1: Yearly Number of Investment Institutions and Net Asset
Values, 2009... 5
Table 2: Yearly Net Asset Value of Turkish Mutual Funds... 8
Table 3: Yearly Commission Rates of Turkish Mutual
Funds... 12
Table 4: Load Fees and Expense Ratios for US Mutual Funds, by
basis points... 13
Table 5: Summary of the Results of Selectivity and Timing
Abilities... 30
Table 6: Selectivity and Timing Performances of Mutual Funds…
Table 7: Arithmetic Means of Selective and Timing Coefficients
According to Fund Type ……… 30
vii
List of Figures
Figure 1: Financial Assets of Institutional Investors in
2007, % of GDP ... 4
Figure 2: Number of Listed Companies and Market
Capitalization of ISE... 5
Figure 3: Cashflows of SSI... 7
Figure 4: Relationship between micro and macro forecasting 31
Figure 5: Selective Ability over Commission Rates .…... 32
Figure 6: Timing Ability over Commission Rates………..…
Figure 7: 0,00015% Daily Commissioned Funds’
Performance……….…… 32
33
Figure 8: 0,00008% Daily Commissioned Funds’
Performance……….…… 33
Figure 9: 0,00010% Daily Commissioned Funds’
Performance……….…… 34
Figure 10: Performance of Mixed Funds ……..……..……... 35
Figure 11: Performance of Stock Funds ……….…….... 35
Figure 12: Performance of Index Funds ……….…….... 36
viii
List of Abbreviations
ISE Ġstanbul Stock Exchange
ICI Investment Company Institute
EFEMA European Fund and Asset Management Association
SSI Social Securities Institution
EMT Efficient Market Theory
CAPM Capital Asset Pricing Model
CMB Capital Markets Board
OECD Organization for Economic Co-operation and
Development
PAYG Pay As You Go
DC Defined Contribution
1
1. INTRODUCTION
The Investment Companies Institute (ICI) defines institutional investors as
“businesses, nonprofit organizations, and other similar investors who own funds and other securities on behalf of theirorganizations.”
The concept behind institutional investment is to provide support to
individuals who lack the time, information, ability or resources to efficiently
manage their savings; instutional investors’ core service consists of the pooling those individuals’ capital and its management within the restrictions set by legal provisions, internal fund regulations and predefined fund goals.
Individuals are incentivized to use services of institutional investment if
lacking the ability to follow market developments and creating rational
portfolios in the framework of portfolio theories and risk diversification
with their savings; moreover, the amount of their savings might only allow
for a limited scope of investment due to high transaction costs. Via
institutionally managed instruments such as mutual funds, investment trusts,
exchange traded funds, pension funds or portfolio management services of
banks, investors can benefit from professional capital management in
exchange for a commission fee (and other expenses in some cases, such as
load charges) whichever instrument fit into their risk perception. When
working with institutional investment agencies, individuals can choose the
degree of risk they wish to bear by making a choice from a huge variety of
2
instruments only to high risk funds that invest on volatile equity stocks or a
combination of both via funds that invest on both high and low risk
instruments in their portfolios.
The Turkish Capital Markets Board (CMB) lists the advantages of investing
in funds to be;
Savings of individuals are managed by professionals who are more informed about investment regulations and principles.
It is possible to lower return risks by spreading investments over different assets such as stocks, fixed return assets and instruments
based on foreign exchange.
Individuals no longer have to spend time and resources on events evaluating securities and following coupon, interest and dividend
payment schedules.
Individuals have a chance to invest in securities that cannot be included in a small portfolio.
As the changes in fund values are calculated daily, investors can cash out their investment with accumulated gains fully or in part
whenever they want.
Commission fees are lowered by large-scale fund purchases and sales.
Certain investment funds allow investors to write checks over their participation shares.
3
Aside from the advantages, disadvantages of the mutual funds are listed by
SEC to be ,
Individuals pay commissions and other charges even when the fund records losses.
Investors no longer have any decision power over their savings, and cannot influence the trades of fund managers.
While prices of stocks are available on a real time basis, the price of contribution shares (NAV – net asset value) of funds are usually
calculated once a day. Investors might pay for losses not yet realized
during the day through their share purchases.
Aside from offering individual investors direct benefits, investment
institutions also are essential for capital markets and the wider economy.
They enable individuals’ savings to reach financial markets, which in return lowers the volatility of financial assets by increasing the liquidity, and also
helps mitigating the problem of scarcity of capital stocks. The assumption
that professionals are better-informed and more qualified decision-makers
than non-professional individuals, implies that institutional investment
serves market efficiency.
1.1 Institutional Investments
Institutional investors play a significant role in the developed world’s
contemporary capital markets. The Organization for Economic Co-operation
-4
based insurance companies, pension funds and investment companies in the
year 2007 equaled 46%, 78% and 86% of the United States’ GDP
respectively. By the end of 2009, US mutual funds alone were managing a
portfolio worth more than 11 trillion USD while US retirement assets have
comprised 16 trillion USD.
According to European Fund and Asset Management Association
(EFAMA) International Statistical Release 2009:Q4, total worldwide mutual
fund assets amounted to 23 trillion USD by the end of 2009. US-based
mutual funds held 48%, Europe-based funds 33% and funds based in other
continents 18% of worldwide total net assets held by mutual funds.
5
-
,
OECD numbers show that institutional investment is an underdeveloped
field in Turkey, compared to its status in developed countries. The main
reasons for the underdevelopment of professional investments are Turkey’s
comparatively low GDP per Capita, low historical capital accumulation, the
rather recent introduction of private pension funds, the of public social
security systems’ cashflow problems and a relatively low consciousness for insurances.
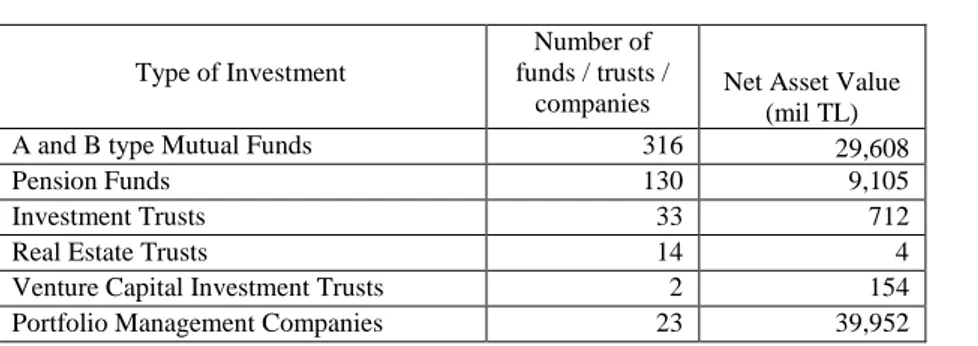
Table 1 : Number of Investment Institutions in Turkey and Net Asset Values, 2009
Type of Investment
Number of funds / trusts /
companies Net Asset Value (mil TL)
A and B type Mutual Funds 316 29,608
Pension Funds 130 9,105
Investment Trusts 33 712
Real Estate Trusts 14 4
Venture Capital Investment Trusts 2 154
Portfolio Management Companies 23 39,952
6
Private retirement has only been in late 2001; however, the sector has
accumulated more than 9 bn TL of assets and over 5 million contributors so
far. Although private pension funds are a recent phenomenon in Turkey they
are becoming increasingly popular, a development partly due to public
social security system’s enforcement of increased retirement age and tax benefits.
Erdoğan and Özer (1998) point out that social security institutions are the most important component among institutional investors in developed
capital markets, however these institutions show to be fund demanding
rather than providing in economies whose social security system’s revenue
generation ability does not cover the exepnses of the system.
In contrast to private pension funds, which are contributing to both
economic growth and market stability, the public social security system
(Social Security Institution, SSI) records large-scale monthly deficits, which
are then compensated through via the central government budget by capital
transfers in Turkey, such as the case in other countries like
Public social security system in Turkey runs under SSI, which is based on
the “Pay As You Go” model in which the cash inflows to the system from active workers at a given time are required to at least meet the amount of
cash outflows caused by pension payments of retired (passive) workers plus
healthcare insurance spendings at that particular moment. The main problem
with this model is that it requires a high active/retired worker ratio in order
to be able to compensate for the costs and function properly. or this reason
7
Schemes”. Unfortunately, the aging of society along with the increase in healthcare spendings and other factors cause the system to be dependent on
continuous government funding, as it is the case in Turkey. A quick
transition from the PAYG model to a private individual pension funds
system is a complex process, considering the current amount of retirees
expecting salaries and healthcare to be paid off the contributions of workers
today and tomorrow. All workers are required by law to be registered to the
SSI, private individual insurances are optional as a secondary insurance.
As an alternative to this model, the private social security system allows
individuals to make monthly deposits into a private pension fund of their
chosen degree of risk. The funds accumulating in the private retirement
funds are then invested on different assets and capital market instruments by
professional fund managers. For the United States, retirement assets
invested in different plans added up to 16.0 trillion USD by the end of 2009.
Individual retirement accounts (IRA) and employer sponsored defined
contribution plans (DC) held 4.2 and 4.1 trillion USD, respectively. A
survey conducted in May 2009 shows that 68% of US households hold a DC
8
1.2 Mutual Funds
Mutual funds are the biggest subdivision in Turkish institutional
investments. As CMB regulations allow, funds can be founded by banks,
stock brokerage houses, insurance companies, the Social Security Institution
and private retirement institutions such as OYAK (Armed Forces Pension
Fund). Fund founders can sign fund management contracts with portfolio
management companies and stock brokerage houses that are licensed by the
Capital Markets Board. The net value of the fund is calculated by adding up
the market values of the fund’s instruments and the net debt of the fund
itself. The value of a participation share is found by dividing the net value of
the fund by the number of shares. The investment funds do not pay yearly
dividends but instead investors’ gains are realized and taxed by the change on the value of participation shares when they are sold.
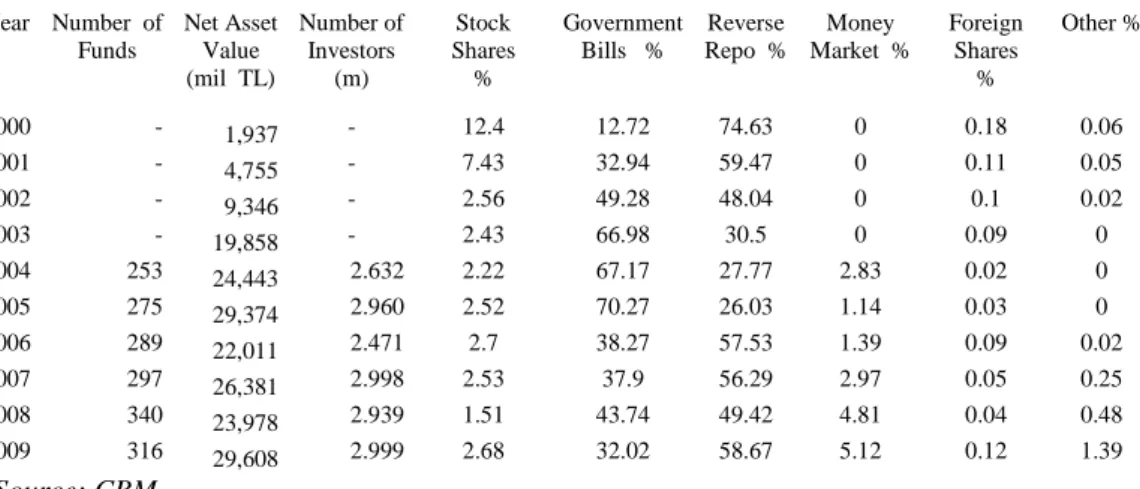
Table 2 : Net Asset Value of Turkish Mutual Funds
Year Number of Funds Net Asset Value (mil TL) Number of Investors (m) Stock Shares % Government Bills % Reverse Repo % Money Market % Foreign Shares % Other % 2000 - 1,937 - 12.4 12.72 74.63 0 0.18 0.06 2001 - 4,755 - 7.43 32.94 59.47 0 0.11 0.05 2002 - 9,346 - 2.56 49.28 48.04 0 0.1 0.02 2003 - 19,858 - 2.43 66.98 30.5 0 0.09 0 2004 253 24,443 2.632 2.22 67.17 27.77 2.83 0.02 0 2005 275 29,374 2.960 2.52 70.27 26.03 1.14 0.03 0 2006 289 22,011 2.471 2.7 38.27 57.53 1.39 0.09 0.02 2007 297 26,381 2.998 2.53 37.9 56.29 2.97 0.05 0.25 2008 340 23,978 2.939 1.51 43.74 49.42 4.81 0.04 0.48 2009 316 29,608 2.999 2.68 32.02 58.67 5.12 0.12 1.39 Source: CBM
Turkish Capital Markets Board divides Turkey’s investment funds into the
9
Government Bonds and Treasury Bills Fund : Funds which invest a minimum of 51% of their portfolio on public and/or private sector debt
instruments.
Stock Fund : Funds investing minimum of 51% of their portfolio on stocks of companies based in Turkey.
Sector Fund : Funds investing minimum of 51% of their portfolio on stocks of companies on one specific industrial sector (such as cement or textile).
Affiliate Companies Fund : Funds which invest a minimum of 51% of their portfolio on the subsidiaries of its founder.
Group Fund : The funds that invest minimum of 51% of their portfolio on
securities of companies of a specific capital group (such as Koç Holding)
Foreign Securities Fund : Funds which invest minimum 51% of their portfolio on foreign public and/or private securities.
Gold Fund : Funds investing a minimum of 51% of their portfolio on gold or gold-backed securities that are traded in domestic or foreign markets.
Gold and Other Precious Metals Fund : Funds investing minimum 51% of their portfolio on gold or other valuable minerals or securities with these
underlying assets that are traded on domestic or international markets.
Composite Fund : Funds which are composed of at least two of stocks, debt instruments, gold, other valuable minerals and related capital market
instruments in which neither component composes less than 20% of the
10
Liquid Fund : Funds that have a weighted average of 45 days to maturity and only invest on capital market instruments which have a maximum of
180 days to maturity.
Variable Fund : Funds that do not fit into any of these categories in terms of portfolio limitations.
Index Fund : Funds that are required to resemble(?) 90% correlation coefficient to the index targeted at 80% of its portfolio and is composed of
either all of the securities listed in the index or some of them chosen by
sampling.
Fund of Funds: Funds investing a minimum of 80% of their portfolio on other investment funds.
Private Fund : Funds whose participation shares are only dedicated to predeterminated individuals or institutions.
Hedge Fund : Funds whose participation shares are sold only to qualified investors.
In addition to this grouping, funds that keep a minimum of 25% of their
portfolio on stocks of companies based in Turkey (including Public
Economic Enterprises that are planned to be privatized) are considered A
Type Funds while the rest is called B type funds.
1.3 Commission Fees of Mutual Funds
Financial service companies charge different types of fees on investors to
11
between different fund types, fund families and countries. The main types of
fees are one time load charges and periodic commission rates. Sale loads are
one time payments upon purchase or sale of shares of a fund while ongoing
expenses are commission rates that are deducted on a daily basis from
investors. Some fund families have different procedures regarding loads
such that if an investor purchases shares of a fund in the related fund family,
he or she then is able to switch between other funds in that specific family
without paying load charges for the second time.
In the literature, load fees are usually annualized by dividing over a certain
number of years that an investor is thought of holding the funds until
cashing in. For example, Khorana et al. (2009) used an estimated period of
five years while Luo (2002) used 3 years while calculating total yearly
commission rates.
The ICI reports that asset weighted average of total fees expenses for US
stock, bond and money market funds have been %0.99, %0.75 and %0.34
respectively. The ICI also notes that the fees and expenses have been
halved in the last decade.
“Since 1990, the average fees and expenses paid by mutual fund investors have fallen by half. In 1990, investors on average paid 198 basis points (or
$1.98 for every $100 in assets) to invest in stock funds. By 2009, that figure
had fallen to 99 basis points. Over the same period, the average fees and
expenses paid by investors in bond funds dropped from 189 basis points to
12
This decline is explained by changes in the brokerage system, waiving of
load charges on retirement (such as 401(k) plans) investments and the
development of a breakpoint system which lowers the load rates as the
amount invested increases.
According to data from fonmarket.com and internal regulations of the funds,
the current commissions of the Turkish Mutual funds are as listed below;
Table 3 : Yearly Commissio Rates of Turkish Mutual Funds
A TYPE B TYPE TOTAL
Number of Funds 112 179 291
Average Yearly Commission
(%) 3.98 4.40 3.45
Maximum (%) 7.28 5.46 7.28
Minimum (%) 0.1019 0.1019 0.1019
13 Table 4 : Load Fees and Expense Ratios for US Mutual Funds, basis points
Stock Funds Bond Funds Money Market Funds Fees and Expenses Annualized Load Fees Ongoing Expenses Fees and Expenses Annualized Load Fees Ongoing Expenses Ongoing Expenses 1990 198 99 100 189 100 89 55 1991 191 90 100 179 90 89 53 1992 177 76 101 165 77 87 53 1993 165 65 101 153 69 85 52 1994 164 59 105 149 63 85 52 1995 155 51 104 145 58 86 52 1996 147 46 102 136 51 85 52 1997 139 41 98 129 46 84 51 1998 131 35 96 121 39 82 51 1999 127 33 94 113 34 79 50 2000 128 29 98 103 26 76 49 2001 124 25 99 97 22 75 47 2002 125 25 100 94 21 73 45 2003 122 23 99 95 21 74 43 2004 118 23 95 92 20 72 42 2005 110 20 90 87 17 70 42 2006 106 18 88 82 15 67 41 2007 101 16 85 78 13 65 39 2008 99 15 84 75 12 63 38 2009 99 13 86 75 10 65 34 Source: ICI
1.4 Taxation of Institutional Investments
With the recent changes in September 2006 in Turkish income tax code,
investors are responsible for 10% taxation on their returns upon sale of their
shares of mutual funds. Before this change, funds were taxed internally and
their share prices were tax included.
According to the current tax code, mutual fund investors pay 10 % income
14
between purchase and sale share price of the fund minus commissions and
fees paid to portfolio management company and brokerage. Investors that
hold shares of a mutual funds which keep at least 51% of its portfolio on
publicly traded equity stocks in ISE at all times, are exempt from taxation.
For the pension funds, the legislation provides certain advantages.
Contributions on retirement fund of oneself or spouse during active work
years are tax deductible up to 10 percent for employees, and also employers
can account their shares of contributions for the employees directly as costs.
If a contributor wishes to cash out of the system, they are taxed 3.75% if
retired, 10% if contributed for at least ten years but left the system before
retirement, and 15% if they have not contributed for 10 years, on their
15
2. LITERATURE REVIEW
Measuring performances of mutual funds since their inception has been an
attractive topic in economics research. Pioneers of the field Sharpe (1966)
and Treynor (1965) have built up performance indices to rank mutual funds.
Economist Jack L. Treynor (1965) defends that individuals can choose the
riskiness of their portfolio by additionally investing or borrowing on risk
free instruments, so the core element of performance analysis of a fund
should be its return per risk as defined in the equation below
Treynorp = Risk Premium / Index of Undiversifiable Risk
Treynorp = ( p – RFR ) / βp
W.F. Sharpe (1966) analyzes the risk-adjusted return performance of funds
by dividing the premiums for risk taken to find their reward to variability
ratio. In his wording, “The predicted performance of a portfolio is described with two
measures: the expected rate of return (Ei) and the predicted variability or risk, expressed as
the standard deviation of return (σi).”
Sharpep = Risk Premium p / Total Riskp
Sharpep = ( p – RFR ) / σp
The risk-adjustment in Sharpe’s approach holds penalizes upside and
16
another method called “Sortino’s Ratio” has been developed which aims to
differentiate upside and downside risk and penalize returns only below the
benchmark. Noted by Kurun et al. Sortino’s Ratio is often used as a
performance measurement method for hedge funds.
Sortinop = ( p – Minimum Acceptable Returnp ) / Downside Riskp
Jensen (1968) noted “A number of people in the past have attempted to evaluate the performance of portfolios (primarily mutual funds), but almost
all of these authors have relied heavily on relative measures of performance
when what we really need is an absolute measure of performance.” . He used the CAPM model and defined alpha values of funds as their selective
ability.
Michael C. Jensen also uses the simple regression model y = α + βx + є and
substitutes risk premium instead of return:
i,t – RFR t = αi + βi ( m,t – RFR t) + є
Where,
βi = Covariance(ri,t - RFRt )(rm,t - RFRt ) / Variance ( rm,t - RFRt )
α in this model represent excess return (positive or negative) on the portfolio regardless of the market returns, which means it shows the ability of fund
17
His conclusion is that “.. not only that these 115 mutual funds were on average not able to predict security prices well enough to outperform a
buy-the-market-and-hold policy, but also that there is very little evidence that
any individual fund was able to do significantly better than that which we
expected from mere random chance.”
As Ippolito (1993) notes in his account of Sharpe and Jensen, “Based on
these results, Sharpe concluded that the evidence is consistent with EMT
that funds' expenditures seemingly are at least partly wasted. These results
were soon confirmed by Jensen. Jensen used the so-called market equation
to calculate alphas for his funds. He had 115 funds in his sample, 56 of
which had 20 years of data starting in 1945 and 59 of which had 10 years of
data starting in 1955. He found the average alpha in his funds to be minus
110 basis points.”, first studies on the subject matter concluded that the
funds were underperforming the market and the fees paid to the fund
managements did not compensate themselves.
“It is commonly believed that mutual fund investment performance is consistent with the original version of the so-called efficient market theory,
hence that expenditures of money on research and trading are wasted
because securities prices already reflect all available information. This
impression is attributable primarily to two well-known studies done in the
1960s (referring to Sharpe and Jensen), which showed that mutual funds
underperformed common market indexes. But most of the other empirical
studies performed over a 30- year period contradict these two studies. The
18
fees and expenses are wasted. They are generally consistent with the
hypothesis that mutual funds are sufficiently successful in finding and
implementing new information to offset their expenses. The results fit neatly
into a modified version of efficient markets, which takes account of the
simple proposition that information is not free.”
As Fama (1970) defines a market to be efficient if it “fully reflects all available information” at any time. Efficient Market Theory (EMT) defends
that the current prices reflect all the available information and thus, it is not
possible to attain a better insight of markets by spending resources on
reaching a higher level of information to outguess the market. Therefore, it
should not be possible to reach continuous and statistically significant
positive α values if the market structure is efficient, on the long term
average, funds could only attain neutral or negative α values due to fees and commissions. Grossman and Stiglitz (1980) later oppose this theory and
defend that “…because information is costly, prices cannot perfectly reflect the information which is available, since if it did, those who spent resources
to obtain it would receive no compensation. There is a fundamental conflict
between the efficiency with which markets spread information and the
incentives to acquire information.” In other words, since publicly available information does not cover the complete set of information, any resources
spent in this manner can yield more attractive investment returns and alpha
values of mutual funds might be significantly positive if nonpublic
19
Francis and Ibbotson suggest that the “Sharpe, Treynor and Alpha tools are well suited to evaluating a portfolio’s asset selection ability.”
Apart from
these methods that evaluate the selective ability of managers, another
method has beendeveloped which tests the ability of fund managers to
forecast and act on broad market movements.
Treynor and Mazuy (1966) note that most common stocks fluctuate with a
correlation and thus it is possible in this context to speak about broad market
movements. They subsequently ask whether the professional fund managers
can anticipate major turns in the markets and prepare their portfolios
accordingly, such that if a rise/decline in markets is expected, fund
managers would shift their portfolios towards assets with high /low market
correlation and high/low volatility.
Therefore, the authors test if the volatility of mutual funds were higher in
periods of bull markets and vice versa. In order to test the ability of fund
managers, Treynor and Mazuy draw the “characteristic lines” of each fund by least squares regression as a quadratic function of performance to check
for any curvature in the lines.
If the fund manager is able to outguess the market, the characteristic line of
the fund would show an increasing slope as the market returns are
increasing, and decreasing slope when the market is sloppy. They find that
out of 57 funds they test, only one fund shows market timing ability and
conclude that “Our results suggest that an investor in mutual funds is completely dependent on fluctuations in the general market. This is not to
20
of return that is higher in both bad times and good than the return provided
by the market averages, but it does suggest that the improvement in rate of
return will be due to the fund manager’s ability to identify underpriced
industries and companies, rather than to any ability to outguess turns in the
level of the market as a whole.”
Kon (1983) examined 37 funds on a monthly return basis between 1960 and
1976. 14 had positive timing estimates but none was statistically
significant.
Chang and Lewellen (1984) have examined a total of 67 mutual funds
between 1971 and 1979 on a monthly basis and conclude that “... those same results suggest that neither skillful market timing nor clever security
selection abilities are evident in abundance in observed mutual fund return
data, and the general conclusion of prior literature that mutual funds have
been unable collectively to outperform a passive investment strategy still
seems valid.”
Henriksson (1984) analyzed 116 open-end mutual funds for the period
between February 1968 and June 1980. He found 62% of the funds having
negative market timing coefficients and only 3 out of 116 had positive
coefficients within 95 % confidence interval.
Ippolito (1989) tests the performance of 143 mutual funds over the period
1965-1984 in terms of any relation between fees and expenses to fund
returns and states “Mutual funds, net of all fees and expenses, except load charges, outperformed index funds on a risk-adjusted basis; these results
21
evidence of negative alphas [Friend et al., 1962; Friend, Blume, and
Crockett, 1970; Jensen, 1968; Sharpe, 1966]. … These results showed that mutual funds with higher turnover, fees and expenses earn rates of return
sufficiently high to offset the higher charges. These results are consistent
with the notion that mutual funds are efficient in their trading and
information gathering activities [Grossman, 1976; Grossman and Stiglitz,
1980]. In addition, load funds earned rates of return sufficiently high to
offset their sales charges compared with no-load funds. These results
persisted in the face of numerous model specifications and fund subsamples.
More reliable empirical work could be done if tractable models of informed
trading”
Lee and Rahman (1990) studied monthly returns of 93 mutual funds
between 1977 and 1984 for 87 months. Out of those 93, 14 had statistically
significant and positive selectivity coefficient and 10 had statistically
significant and negative α selectivity coefficients. 4 had significant selection with no timing skill and 5 had significant timing with no selection skill. 10
funds had both significant timing and selectivity skills.
Philippas (2002) studied market timing and selectivity abilities of 19 Greek
mutual funds between 1993 and 1998 and states that “The empirical findings do not reveal any general ability of the fund managers to time the
market correctly.”
Erdoğan and Berk (2004) have used Treynor & Mazuy model to test timing
ability of Turkish mutual funds between 1988 and 1996. They found only 2
22
3. EMPIRICAL TEST OF MARKET TIMING AND
SELECTION ABILITIES OF TURKISH MUTUAL FUNDS
3.1 Data
We used monthly returns of 63 A Type private, variable, equity stock,
mixed and affiliate companies funds between the years of 2001 and 2009,
consisting of 108 periods. The return data of the funds have been taken from
fonbul.com. ISE-100 Index has been taken as the benchmark market index.
Funds that invest on foreign equities have been removed from the database
as the ISE 100 Index benchmark would not give meaningful results for their
market timing analysis.
We used the data of 90 day treasury bills performance index of ISE for the
risk free rate. The market return and risk free rates are taken from
imkb.gov.tr.
ISE 100 index does not include dividend payments of stocks listed within.
For this reason, the results are going to be biased in favor of the fund
managers as the dividend payments are reflected in the fund prices, but not
in the benchmark. Another potential source of error is that the fund
managements have different benchmarks, often some combination of
different indices and their real performance in respect to their specific
benchmark can be different than the values calculated in this research.
Choice of benchmark has been a generally tough problem for researchers.
23
and systematic risk coefficients to be miscalculated. Later, Reilly and
Akhtar (1995) uses six different benchmarks for calculating beta values and
finding very different results for their sample group of enterprises.
The dataset might have survivorship bias. As Elton et al.(1996) note,
“Mutual fund attrition can create problems for a researcher because funds that disappear tend to do so due to poor performance.” No further research has been done to include any information about funds that ceased to exist.
Another systematical error in the dataset is that prices before September
2006 are tax included. There has been a change in Turkish income tax code
ending internal taxation. Therefore, real returns of the funds before
September 2006 might have been higher than the values used in this test.
3.2 Methodology
We have used the model applied by Lee and Rahman (1990).
Fama (1972) names the selective and timing abilities of fund managers
microforecasting and macroforecasting. For microforecasting
measurements, Jensen (1968) uses the equation (1) to capture any ability of
forecasting security prices by the α value. Since the equation has an error term ũpt which is expected to have a value of zero and an intercept that is not
bound by origin, α is expected to explain the fund management’s success of asset picking.
24
However this model alone is not able to identify any macroforecasting skills
due to βp being a fixed coefficient without any time subscript. Jensen (1968)
acknowledges that the risk parameter can vary in time as the market factor
(π) expectation of fund managers change in time. In order to include the variability in the risk parameter, he defines p as;
pt = βp + pt (2)
..where pt is a normally distributed random variable with E( pt)=0. Jensen
defines this pt as a “vehicle through which the manager may attempt to
capitalize on any expectations he may have regarding the behaviour of
market factor in the next period.” Since now the manager is able to
forecast and implement market movements into the portfolio to some extent,
there should be a positive relation, which can be expressed as;
pt = ap t + jt (3)
With the assumption jt to be normally distributed with E( jt)=0. The ap
coefficient will show the manager’s ability to forecast market turns and its magnitude will reflect his aggressiveness on risk taking with this forecast.
25 pt - Rft = αp + (βp + pt ) ( mt - Rft) + ũp,t (4)
And
E( pt) = (5)
For the regression of pt on coefficients of t and t2,
pt = c1 + c2 t + c3 t2 + ũp,t (6)
Jensen states that;
plim c1 = αp + βpE m) + θ(p2 – 1) σπ2 (7)
plim c2 = p2θE m) + βpt (8)
plim c3 = θp (9)
p being correlation between predicted and realized t.
Pfleiderer and Bhattacharya (1983) object to Jensen’s derivations on this point.
“Jensen assumed that the expected return on the market was known or could be measured with precision. He also allows the target level of β to take on any value – it is not constrained to equal θє m). If his expressions for the
probability limits of ɳ 0, ɳ 1, ɳ 2 [c1, c2 and c3 in the notation used in this
26
notice that in the calculation of these values (specifically in the plim of ɳ 2)
it is implicitly being assumed that the covariance between t and pt is zero.
We have argued that it is not.”
Finally rewriting the equation as;
p = c1 + [c2 – c3E m) ] E m) ) (10)
Pfleiderer and Bhattacharya (1983) notes that this model is able to detect
macro and microforecasting abilities due to positive α and c2, however it
does not allow ranking. c2 i can be related to both the well-informedness of
the manager or give false conclusions due to the fund manager’s
aggressiveness of. Another disadvantage of this model is that it requires
precise E m) estimations. The amendments made by Pfleidrer et al. on
Jensen’s model are shown in equation 6.
First, they replace t by m as t is not observable as long as E m) is
unknown.
pt = c 1 + c 2 mt + c 3 mt2 + t (11)
27
= αp + θE m) (1- ) mt +θ mt)2 + θ t mt + ũpt (12)
Since t is a forecast error independent of the return,
plim 1 = αp (13)
plim 2 = θE( m) (1 – ) (14)
plim 3 = θ (15)
The error term in equation 11 has two parts;
pt = θ t mt + ũpt (16)
Pfleiderer et al. note that the second term ũpt is assumed to be independent of
both t and t, however the first term has valuable information about
performance of the fund manager. In order to extract that information, they
suggest a regression in the form of;
( pt)2 = θ2 2σє2 mt2 + t (17)
And
28
By this derivation, we can obtain σє2, since t and ũpt are independent of mt,
and t is uncorrelated with mt. By the consistent estimate of θ in
equation 11, it is possible to calculate σє2. It is now possible to estimate
= (σπ2 / (σπ2 + σє2)) = p2 (19)
Pfleiderer and Bhattacharya (1983) state that at this point it is possible to
calculate θ by using the estimation of “What may not be immediately obvious is the fact that our ability to distinguish p from θ allows us to
recover E( m). This we do using 1. 1 is a consistent estimate of
θ(1-2
)E m). Since both θ and p are known, E( m) is easily obtained.”
Lee and Rahman (1990) use the method proposed by Merton (1980) to
calculate t which allows them to estimate the variance without estimating
the mean and saving one degree of freedom.
π2 = { mt)2] } / n (20)
They have used generalized least squares (GLS) method with correction for
heteroscedasticity by using the variances of pt in equation 11 and t from
29
σω2 = θ2 2σє2 mt2 + σu2 (21)
σζ2 = 2θ4 4σє4 mt4 + 2σu4 + 4θ2 2σє2 mt2σu2 (22)
σω2, σu2 and σζ2 are variances of t, ũpt and t respectively. σu2 and σє2
estimations are necessary to predict σω2 and σω2 and σζ2. σє2 is estimated by
equations 11 and 17 and σu2 is obtained from equation 1.
Finally, the variables in equation 11 are divided by σω2 and those in equation
17 are divided by σζ2; subsequently OLS is applied to transformed
observations.
After calculating the coefficients of selection and timing, we have separately
regressed them over commission rates in order to check for a positive or
negative relation in the form of y = α + βx.
In addition, we have tested timing and selection abilities over each other to
investigate any significant relation in either direction.
3.3 Results:
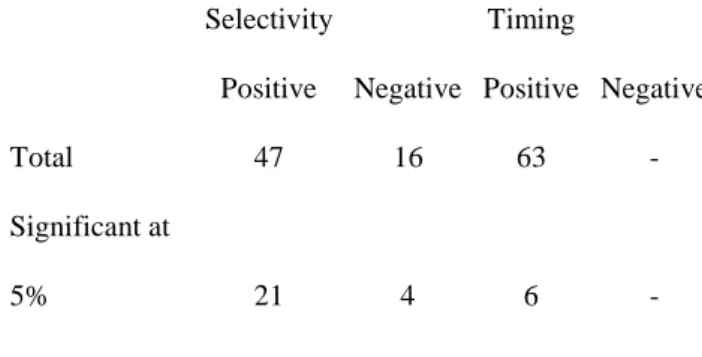
Empirical testing shows that a significant majority of mutual fund managers
have microforecasting ability. Out of 63 funds tested, 47 had positive alpha
where 21 of which have been found to be statistically significant at .05
confidence interval. Only 6 funds were statistically significant at .05
30 Table 5 : Summary of the Results of Selectivity and Timing Abilities
Selectivity Timing
Positive Negative Positive Negative
Total 47 16 63 -
Significant at
5% 21 4 6 -
Table 6 : Selectivity and Timing Performances of Mutual Funds
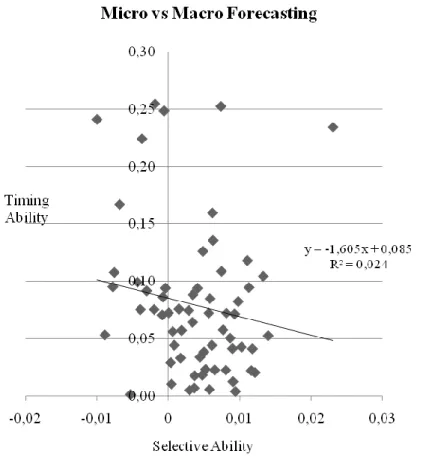
There is also evidence of weak negative relation between the selective and
timing coefficients suggesting that the fund managers or relative research Selectivity Timing Selectivity Timing
Fund 1 0.00340 0.06435 Fund 33 0.00151 0.075892 Fund 2 0.00978 * 0.08243 Fund 34 0.01215 * 0.020632 Fund 3 0.00475 0.01843 Fund 35 -0.00434 0.099310 Fund 4 0.00297 0.00530 Fund 36 0.00744 0.108637 Fund 5 -0.00085 0.07067 Fund 37 -0.00075 0.086294 Fund 6 0.01179 * 0.04132 Fund 38 0.00484 0.126126 Fund 7 0.01332 * 0.10441 Fund 39 0.00185 0.057329 Fund 8 -0.00200 0.07547 * Fund 40 -0.00369 0.224061 Fund 9 0.01402 * 0.05270 Fund 41 0.00521 0.023463 Fund 10 0.01109 * 0.11812 Fund 42 0.00443 0.034008 Fund 11 -0.00187 0.25453 Fund 43 0.00084 0.044431 Fund 12 0.00044 0.01063 Fund 44 -0.00890 * 0.053365 Fund 13 0.00286 0.07464 Fund 45 0.00499 0.038622 Fund 14 0.00366 0.00714 Fund 46 0.00815 0.072357 * Fund 15 -0.00532 0.00151 Fund 47 -0.00305 0.091751 * Fund 16 -0.00042 0.09410 Fund 48 0.00003 0.072565 * Fund 17 0.00908 * 0.01272 Fund 49 -0.01001 * 0.240920 Fund 18 0.00901 * 0.04153 Fund 50 0.00577 * 0.005914 Fund 19 0.00567 * 0.07238 Fund 51 0.00410 0.093992 Fund 20 0.00620 * 0.15954 Fund 52 0.01164 * 0.022333 Fund 21 0.00767 * 0.05782 Fund 53 0.00735 0.252238 Fund 22 0.00370 0.01787 Fund 54 0.00612 0.044396 * Fund 23 0.00585 0.08499 Fund 55 0.00172 0.033182 Fund 24 0.00868 * 0.05059 Fund 56 -0.00760 * 0.107689 Fund 25 0.01026 * 0.04291 Fund 57 -0.00684 0.166906 Fund 26 -0.00392 0.07543 Fund 58 -0.00780 * 0.095214 * Fund 27 0.00345 0.08837 Fund 59 -0.00061 0.248296 Fund 28 0.00652 * 0.02294 Fund 60 0.00628 0.135654 Fund 29 0.02311 * 0.23411 Fund 61 0.00930 * 0.071554 Fund 30 0.00061 0.05631 Fund 62 0.00807 * 0.022763 Fund 31 0.00033 0.02922 Fund 63 0.01131 * 0.094622 Fund 32 0.00941 * 0.00419
31
departments tend to specialize in one aspect over another. The linear
regression of coefficients yield a negative slope, which fails to be
statistically significant at .05 interval.
Figure 4: Relationship between Micro and Macro Forecasting
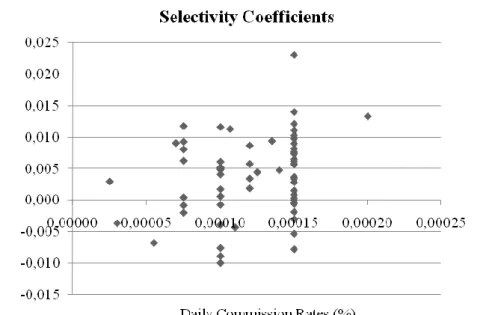
The commission rates have a positive but very slight relation with both
micro and macro forecasting skills. This alone is not enough to conclude
that fund managers are able to turn the extra resources into better
information and improve their decision making. Furthermore, the degree of
efficiency in this process has not been tested and it is possible that the extra
performance of high commission funds do not cover the extra fees for the
32 Figure 5: Selective Ability over Commission Rates
Figure 6: Timing Ability over Commission Rates
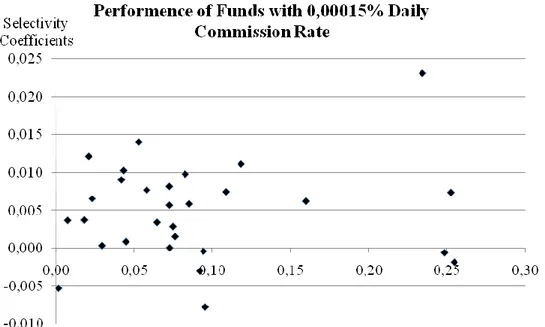
A better way to compare fund performances can be taking a closer look at
33
funds in this research have a daily commission rate of 0,00015%, 12 have a
rate of 0,00010% and 7 are grouped in the rate of 0,00008%.
Figure 7: Performance of Funds with 0.00015% Daily Commission Rate
34 Figure 9: Performance of Funds with 0.00010% Daily Commission Rate
As seen on cluster testing, the funds of same commission levels have
significantly different timing and selective performances. Based on this
evidence, it can be claimed that not all fund managements are able to
efficiently convert their commissions to performance and therefore there are
differences amongst funds of same commission levels in terms of their
returns. At least some fund managements are violating the fiduciary
ownership principle.
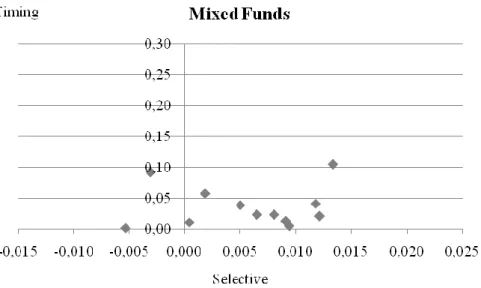
It is possible to investigate performances of similar types of funds with each
other as well. Out of 63 funds used in this research, 27 were variable, 11
were stocks, 2 were private, 12 were mixed, 8 were index and 2 were
35 Figure 10: Performance of Mixed Funds
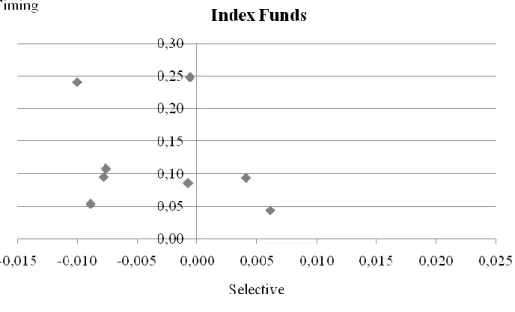
36 Figure 12: Performance of Index Funds
37
Mixed funds show lowest selective performance due to the relatively higher
proportion of fixed return assets included in their portfolios. Index and
stock funds seem to capitalize the market movements better than others due
to higher ratio of equity stocks held (and also due to our choice of
benchmark index) but they differ from each other on selective ability which
is explainable by their different limitations and aims.
Table 7: Arithmetic Means of Selective and Timing Ability Coefficients According to Fund Type
Selective Timing
Variable 0.0048 0.0684
Index -0.0032 0.1213
Stocks 0.0049 0.1116
38
4. CONCLUSION
The performance of professional portfolio managers has been questioned
many times in the literature. Main motive behind this might be trying to see
if it is possible to outguess the market and continuously perform above the
average. Conflicting answers has been given by many different authors to
this question.
In this study, selectivity and market timing abilities of Turkish mutual fund
managers and relation between commission fees and performance have been
tested. Monthly data for 9 year period was used for 63 A Type mutual funds
and the tests found vague evidence of micro and macro forecasting abilities
being positively related to fund fees. However funds that are good on one
aspect on average has performed slightly worse in the other aspect.
Positive relation between fund fees and performance is not strong enough to
conclude information is not free, and managers with more resources tend to
be more successful in information gathering and processing over those with
less resources. Cluster testing of funds with same commission rates shows
great variance among performance enough to say that at least some mutual
funds are violating the fiduciary ownership principle since they are not able
to yield higher returns with with each marginal commission fee paid by an
investor.
There has been no evidence of fund managers being successful at both
39
It must be noted that despite the slight positive relation between
commissions and forecasting abilities has been found, the degree of this
relation has not been examined. It is possible that on average, although
funds with higher commissions generate higher yields than others, this extra
income might not be sufficient to offset the extra commission fee payments
and investors might still be better off on investing on low fee – low
performance funds. Further testing is necessary for making any claims on
this topic, which has not been the scope of this research.
The systematical errors in the dataset might have influenced the result to be
in favor of fund managers. The dataset was survivorship based, meaning
funds that performed badly might have ceased to exist and the sample tested
might not represent the population. The fund returns were uncommissioned,
which tells that from an investor’s point of view, statistical conclusions might not represent the performance enjoyed by the investors. In addition,
the benchmark index did not include the dividend payments of public stocks
which are represented in fund returns, causing results to be even more
biased in favor of the fund managers. Another possible source of error is
that we have compared the performance shown in a 9 year period of
2001-2009 with the commission rates of 2010. If there has been a significant
change in fund fees over the period, our findings might be misleading. A
final disturbance is that there has been a change in the tax code which
affected the calculation of fund returns. The returns used prior to 2006 have
40
2006 are untaxed. This difference might have affected the calculation of
timing and selection ability coefficients.
Fund managers might be using different frequencies when making their
plans and acting upon, so monthly intervals might not be the best frequency
to analyze the skills. For further research and higher confidence levels,
reapplying the same test over different time periods (semi-annually,
41
REFERENCES
Chang E.C. and Lewellen W.G., “Market Timing and Mutual Fund Investment Performance”, The Journal of Business (1984) pp. 57-72 Erdoğan O. and Özer L., 1998, “Sermaye Piyasasında Kurumsal Yatırımcılar”, IMKB
Erdoğan O. And Berk N., “Menkul Kıymet Piyasalarında Kurumsal Yatırımlar ve Performans: Türkiye Örneği” 2004 Türkiye Ġktisat Kongresi Fama E., 1972, Components of Investment Performance”, Journal of Finance 27, pp551-567
Fama E., 1970, "Efficient Capital Markets: A Review of Theory and Empirical Work," Journal of Finance 25, pp. 383-417.
Francis J.C. and Ibbotson R., 2001, “Investments: A Global Perspective”, Prentice Hall
Friend I. and Blume M., 1970, “Measurement of Portfolio Performance under Uncertainity”, The American Economic Review 60, pp561-575 Grinblatt M.and Titman S., 1989,“Mutual Fund Performance: An Analysis of Quarterly Portfolio Holdings”, The Journal of Business 62, pp. 393-416 Grossman S. and Stiglitz J., 1980, "On the Impossibility of Informationally Effi- cient Markets", American Economic Review 70, pp. 393-408.
Hansson I. and Stuart C., 1989, “Social Security as Trade among Living Generations”, the American Economic Review 79, pp. 1182-1195 Henriksson R.D. and Merton R.C., 1981, “On Market Timing and Investment Performance. II.Statistical Procedures for Evaluating Forecasting Skills”, The Journal of Business 54, pp. 513-533
Henriksson R., 1984, 'Market Timing and Mutual Fund Performance: An Empirical Investigation," Journal of Business 57, pp. 73-96
Ippolito R. A., 1989, "Efficiency with Costly Information: A Study of Mutual Fund Performance, 1965-1984," Quarterly Journal of Economics 104, pp. 1-23.
Ippolito R.A., 1993, “On Studies of Mutual Fund Performance, 1962-1991”, Financial Analyst Journal 49, pp. 42-50
Jensen M. C., 1968, "The Performance of Mutual Funds in the Period 1945- 1964," Journal of Finance 23, pp. 16-26
42
Khorana A., Servaes H. and Tufano P., 2009, “Mutual Fund Fees Around the World”, The Review of Financial Studies 22, pp. 1279-1310
Kon S. and Jen F., 1979, "The Investment Performance of Mutual Funds: An Empirical Investigation of Timing, Selectivity and Market Efficiency," Journal of Business 52, pp. 263-89.
Kon S.J., 1983, “The Market Timing Performance of Mutual Fund Managers”, The Journal of Business 56, pp. 323-347
Kurun E., Akçay B., Dayıoğlu A., Yücel S., “Yatırım Fonlarının Performans Analizinde Kullanılan Risk Bazlı Ölçüm Teknikleri ve Türk Yatırım Fonları Üzerinde Bir Uygulama”, 2008
Lee C.F. and Rahman S., 1990, “Market Timing, Selectivity and Mutual Fund Performance: An Empirical Investigation”, The Journal of Business 63, pp. 261-278
Lehmann B.N. and Modest D.M., 1987, “Mutual Fund Performance Evaluation: A comparison of Benchmarks and Benchmark Comparisons”, The Journal of Finance 42, pp. 233-265
Luo G.Y., 2002, “Mutual Fund Fee-Setting, Market Structure and Mark-Ups”, Economica New Series 69, pp.245-271
McDonald J.G., 1974, “Objectives and Performance of Mutual Funds, 1960-1969”, The Journal of Financial and Quantitative Analysis 9, (1974), pp.311-333
Merton R.C., 1981 “On Market Timing and Investment Performance. I. An Equilibrium Theory of Value for Market Forecasts”, The Journal of
Business 54, pp.363-406
Pfleiderer P. and Bhattacharya S., 1983, “A Note on Performance
Evaluation,” Stanford Graduate School of Business Technical Report No. 714
Philippas N., 2002, “Market Timing and Selectivity: An Empirical Investigation into the Features of Greek Mutual Fund Managers”, The Journal of Applied Business Research 18, pp. 97-108
Reilly F.K. and Akhtar R., 1995, “The Benchmark Error Problem with Global Capital Markets,” The Journal of Portfolio Management, pp. 33-52
Roll, R., 1978, “Ambiguity When Performance is Measured by the Securities Market Line”, The Journal of Finance, pp. 1051-1069
43
Sharpe W. F., 1966, 'Mutual Fund Performance," Journal of Business 39, pp. 119-38,
Sortino F. and Lee N.P. 1994, “Performance measurement in a downside risk framework”, Journal of Investing
Sortino F., van der Meer R., Plantinga A., 2001, “The impact of downside risk in risk-adjusted performance funds in the Euronext markets”, Geneva Papers
Treynor J. and Mazuy K., 1966,"Can Mutual Funds Outguess the Market?" Harvard Business Review 44, pp. 131-36.
Treynor J., 1965, “How to Rate Management of Investment Funds,” Harvard Business Review, pp.63-75
Online Resources: http://www.ici.org 25 March 2010 http://www.spk.gov.tr 4 April 2010 http://www.oecd.org 4 April 2010 http://www.tkyd.org.tr 15 April 2010 http://www.bireyselemeklilik.gov.tr 17 March 2010 http://www.egm.org.tr 17 March 2010 http://www.sgk.gov.tr 20 February 2010 http://www.efema.org 3 March 2010 http://www.sec.gov 3 March 2010 http://www.takasbank.com.tr 28 March 2010 http://www.fonbul.com 5 February 2010 http://www.fonmarket.com 9 March 2010
44
Appendix 1 : Types and Number Codes of Funds Abank (A) Anadolu Özel Fund #1 Private
Abank A Tipi Değ. Fund #2 Variable
EczacıbaĢı A Tipi Değ. Fund #3 Variable
Acar A Tipi Değ. Fund #4 Variable
Denizbank A Tipi Hisse Fund #5 Stocks Denizbank A Tipi Karma Fund #6 Mixed Evgin Men A Tipi Karma Fund #7 Mixed Finansbank A Tipi Değ. Fund #8 Variable Fortis Bank A Tipi Küçük Ve Orta Ölçekli ĠĢl.
Hisse Sen. Fund #9 Stocks
Garanti Ban. A Tipi Hisse Senedi Fund #10 Stocks Gedik Yat. A Tipi Hisse Fund #11 Stocks Gedik Yat. A Tipi Karma Fund #12 Mixed Global Menkul A Tipi Değ. Piri Reis Fund #13 Variable Global Menkul A Tipi Değ. Fund #14 Variable Global Menkul A Tipi Karma Aktif Strateji Fund #15 Mixed Halkbank A Tipi DeğiĢken Fund #16 Variable Halkbank A Tipi Karma Fund #17 Mixed HSBC Bank A Tipi Değ. Fund #18 Variable ING Bank A Tipi Değ. Fund #19 Variable ING Bank A Tipi Hisse Fund #20 Stocks ĠĢ Bank A Tipi Değ. Fund #21 Variable ĠĢ Bank A Tipi Hisse Fund #22 Stocks
ĠĢ Bank A Tipi ĠĢtirak Fund #23 Affiliate Companies Kalkınma Ban A Tipi Değ. Fund #24 Variable
ĠĢ Yatırım A Tipi Değ. Fund #25 Variable Meksa Yat A Tipi Değ. Fund #26 Variable
Akbank A Tipi Hisse Fund #27 Stocks
Ata Yat A Tipi Karma Fund #28 Mixed
Strateji Men A Tipi Değ. Fund #29 Variable ġekerbank A Tipi Değ. Fund #30 Variable Tacirler Men A Tipi Değ. Fund #31 Variable Tacirler Men A Tipi Karma Fund #32 Mixed Taib Yat. A Tipi Değ. Fund #33 Variable
Teb A Tipi Karma Fund #34 Mixed
Unicorn Capital Ġstanbul A Tipi DeğiĢken Fund #35 Variable Vakıfbank A Tipi Değ. Fund #36 Variable Vakıfbank A Tipi U30 End. Fund #37 Index Yapı Kredi Yat. A Tipi Değ. Fund #38 Variable Yapı Kredi Yat. A Tipi Karma Fund #39 Mixed
Yapı Kredi Yat. A Tipi Koç ġrk. ĠĢtirak Fund #40 Affiliate Companies Yatırım Finansman A Tipi DeğiĢken Fund #41 Variable
YKB A Tipi Allianz Sig. Özel Fund #42 Private
45
YKB A Tipi ĠMKB U100 End. Fund #44 Index
YKB A Tipi Karma Fund #45 Mixed
Tekstilbank A Tipi Hisse Fund #46 Stocks Global Menkul A Tipi Karma Fund #47 Mixed Teb Yat A Tipi Hisse Fund #48 Stocks ĠĢ Bank A Tipi U30 End. Fund #49 Index
Akbank A Tipi Değ. Fund #50 Variable
ING Bank A Tipi ĠMKB Ulusal 30 Endeks Fund #51 Index Ziraat Yat. A Tipi Değ. Fund #52 Variable
TSKB A Tipi Hisse Fund #53 Stocks
YKB A Tipi Özel Bank. U30 Endeks Fund #54 Index Yapı Kredi Yat. A Tipi Özel Portföy Yön. Değ. Fund #55 Variable Akbank A Tipi U30 End. Fund #56 Index Anadolubank A Tipi Değ. Fund #57 Variable Garanti Ban. A Tipi U30 End. Fund #58 Index
Ata Yat (A) U30 Fund #59 Index
Finansbank A Tipi Hisse Fund #60 Stocks Finans Yat. A Tipi Değ. Fund #61 Variable Finans Yat. A Tipi Karma Fund #62 Mixed Garanti Men A Tipi Port.Yön.Hiz.DeğiĢken Fund #63 Variable
Appendix 2: Investment Funds Structure of Portfolio as of May 2010
Asset Type Value (mio $)
T-BILLS - G-BONDS 5,308
TURKISH EUROBONDS -FOREIGN SECURITIES 142
REVERSE REPO 12,940
STOCKS 602
ISE SETTLEMENT AND CUSTODY BANK MONEY
MONEY MARKET 1,256
TOTAL 20,248
46
Appendix 3 : Investment Funds Portfolio Size by Fund Type as of May 2010
Fund Type Value (mio $)
Government Bonds and Treasury Bills Fund 1,641
Private Fund 174
Variable Fund 1,689
Liquid Fund 15,226
Affiliate Companies Fund 105
Protected Fund 670
Fund of Funds 10
Composite Fund 214
Foreign Securities Fund 72
Gold and Other Precious Metals Fund 164
Hedge Fund 93 Sector Fund 0 Guaranteed Fund 166 Stock Fund 104 Index Fund 134 TOTAL 20,461
source: ISE Settlement and Custody Bank
Appendix 4 : Pension Funds Structure of Portfolio as of May 2010
Asset Type Value (mio $)
T-BILLS - G-BONDS 4,286
TURKISH EUROBONDS -FOREIGN SECURITIES 230
TIME DEPOSIT 433
REVERSE REPO 1,049 STOCKS 730
ISE SETTLEMENT AND CUSTODY BANK MONEY MARKET 15
TOTAL 6,743 source: ISE Settlement and Custody Bank Appendix 5 : Pension Funds Portfolio Size by Fund Type as of May 2010 Fund Type Value (mio $) Public TL Debt Instruments Fund 3,754 Public FX Debt Instruments Fund 238
Composite Fund 58
International Composite Fund 7
International Debt Instruments Fund 14
Liquid Fund - Public 809
Liquid Fund - Composite 16
Flexible Fund 1,450 Stock Fund 343
Index Fund 26
Composite Debt Instruments Fund 16
Balanced Fund 74
TOTAL 6,806
47
Appendix 6 : Exchange Traded Funds Structure of Portfolio as of May 2010
Asset Type Value (mio $)
T-BILLS - G-BONDS 35.9
TURKISH EUROBONDS -FOREIGN SECURITIES 0,00
TIME DEPOSIT 0,00
REVERSE REPO 0.5
STOCKS 37.3
ISE SETTLEMENT AND CUSTODY BANK MONEY
MONEY MARKET 0,00
TOTAL 73.7
source: ISE Settlement and Custody Bank
Appenix 7 : Investment Trusts Structure of Portfolio as of May 2010
Asset Type Value (mio $)
T-BILLS - G-BONDS 206
TURKISH EUROBONDS -FOREIGN SECURITIES 4
TIME DEPOSIT 0
REVERSE REPO 115
STOCKS 148
ISE SETTLEMENT AND CUSTODY BANK MONEY
MONEY MARKET 0
TOTAL 474