THE REPUBLIC OF TURKEY
BAHÇEŞEHİR UNIVERSITY
ENERGY SOURCES AND INVESTMENT PROJECT
ASSESSMENT: A CASE STUDY ABOUT WIND ENERGY IN
TURKEY
Master’s Thesis
AYÇA AY
THE REPUBLIC OF TURKEY
BAHÇEŞEHİR UNIVERSITY
THE INSTITUTE OF SOCIAL SCIENCESCAPITAL MARKETS AND FINANCE
ENERGY SOURCES AND INVESTMENT PROJECT
ASSESSMENT: A CASE STUDY ABOUT WIND ENERGY IN
TURKEY
Master’s Thesis
AYÇA AY
PROF. DR. NİYAZİ BERK
iii
ACKNOWLEDGEMENTS
There are several people who I am indebted to for their help and support during the course of my thesis. First of all, I would like to thank my advisor Prof. Dr. Niyazi Berk with his crucial contributions added significant value to this thesis. I am also grateful to Prof. Dr. Ümit Erol for his support enabled me to complete this thesis. I would like to thank also Asst. Prof. Hakkı Öztürk who encouraged me during the whole process.
I owe particular gratitude to Anna Maria Beylunioğlu and Boran Turhan for their invaluable contribution, support and patience.
Last but not least, I owe a dept of gratitude to my lovely family and especially to my mother Tülay Ay. This thesis would not have been possible without my mother sharing her love and experiences with me. Finally, I wish to thank my father for his infinite trust which gave me the power to complete this difficult work.
iv
ABSTRACT
ENERGY SOURCES AND INVESTMENT PROJECT ASSESSMENT: A CASE STUDY ABOUT WIND ENERGY IN TURKEY
Ay, Ayça
Capital Markets and Finance Supervisor: Prof. Dr. Niyazi Berk
June, 2010, 142 Pages
All over the world, energy resources have always been a subject of interest. Some countries have become a monopoly in energy production and export. These resources are required in many different areas. It is well known that the production and consumption of energy is an indication of civilization. With this understanding, the importance of energy resources and investments made toward their acquisition is undeniable.
The purpose of this thesis is to analyze the proper distribution methods of limited funds, especially in the installation stage of projects that require major investments. The objective of investment in energy costs with their components correctly identified, as well as deviations which may arise in the future, and the ensuing results contribute to findings.
As companies cannot embark upon new projects with exact figures at hand, those that will make the most accurate estimates are the ones that will succeed. Investment decisions for financing projects are vital for a company’s future. In this regard, the state or private sector alone will lack the necessary funds and therefore must act together. As an alternative to fossil resources, renewable energy resources need the backing of governments and international organizations. Feasibility research for investment in fossil energy resources has over time come to yield predictable results. However, as yet, this is not the case with renewable energy sources.
Renewable energy sources are environmentally-friendly, are low cost and sustainable, and therefore the most obvious choice for the future. Developed countries, especially, have begun to acknowledge this fact and act accordingly in terms of investment. Investing in renewable energy will contribute to a country’s economic development, supply its energy demands, and create a cleaner environment.
Keywords: Energy Resources, Investment Decisions and Projects, Renewable Energy, Fossil Based Energy, Wind Energy
v
ÖZET
ENERGY SOURCES AND INVESTMENT PROJECT ASSESSMENT: A CASE STUDY ABOUT WIND ENERGY IN TURKEY
Ay, Ayça
Sermaye Piyasaları ve Finans Tez Danışmanı: Prof. Dr. Niyazi Berk
Haziran, 2010, 142 Sayfa
Enerji kaynakları her zaman bütün dünyayı ilgilendiren bir konu olmuştur. Bazı ülkeler bu kaynakları ithal ederek elde ederken, bazı ülkelerde bu kaynakları üretme konusunda tekel konumuna gelmiştir.Bu kaynakların hepsi farklı alanlarda talep edilmektedir. Ama şu bilinmektedir ki enerji kaynakları medeniyetleşmenin bir göstergesi olmuştur.Bu kaynakların öneminin kavranması ile birlikte bu alana yatırımlar yapılmaya başlanmıştır.
Bu tezin amacı bu kaynakların özellikle projenin kurulum aşamasında büyük yatırımlara ihtiyaç duymasından ve sağlanacak fon kaynaklarının kısıtlı olmasından dolayı nasıl bir dağılım yapılabileceğini gösterebilmektir.Buradaki amaç enerji yatırımlarının maliyet ayaklarının doğru belirlenmesi ile birlikte gelecekte ortaya çıkacak sapmalardan bu kalemlerin ne şekilde etkilenip etkilenmeyeceği bilinmesidir.
Yatırımlar yapılırken her zaman tahmini rakamlardan yola çıkılır. Firmaların elinde kesin rakamlar yoktur ancak ne kadar tahmine yakın olunursa firma o kadar başarılı olacaktır.Yatırıma karar verirken firmalar için finansman ihtiyacı tesbitide en önemli kararlardan biridir. Bu durumda devlet veya özel sektörün tek başına sağladığı kaynaklar eksik kalmaktadır. Devlet ve özel sektörün birlikte hareket etmesi gerekmektedir.Özellikle fosil kaynaklara alternatif olarak çıkan yenilenebilir enerji kaynaklarının devlet ve uluslararası kuruluşlar tarafından daha çok desteğe ihtiyacı olduğu anlaşılmıştır. Çünkü fosil enerji kaynaklarına yapılan yatırımlar çok eskiden beri yapıldığı için fizibilite aşaması daha tahmin edilebirdir. Ancak bu yenilenebilir enerji kaynakların fizibilite aşaması için geçerli olamamaktır.
Yenilenebilir enerji kaynaklarının çevreci olması ve dış maliyetlerinin çok düşük olması ve sürdürülebilir kalkınma açısından etkin olması, bu kaynakları geleceğin enerji kaynakları yapmaktadır. Bu doğrultuda özellikle gelişmiş ülkelerde yenilenebilir kaynak yatırımlarına ciddi yönelmeler vardır. Yenilenebilir kaynaklara yatırım yapmak hem ülke ekonomisine, hem ülke enerji ihtiyacına hemde dünyamızda daha temiz bir çevre yaratma isteğine katkıda bulunacaktır.
Anahtar Kelimeler: Enerji Kaynakları, Yatırım Kararları ve Projeleri, Yenilenebilir Enerji, Fosil Kaynaklar, Rüzgar Enerjisi
vi
TABLE OF CONTENTS
LIST OF TABLES ... viii
LIST OF FIGURES ...ix
LIST OF ABBREVIATIONS ... x
1. INTRODUCTION ... 1
2. SOURCES AND USES OF ENERGY RESOURCES ... 3
2.1. FOSSIL BASED ENERGIES (NON-RENEWABLE ENERGY) ... 12
2.1.1. Coal ... 16
2.1.2. Oil... 18
2.1.3. Gas ... 22
2.1.4. Nuclear Power ... 24
2.2. RENEWABLE ENERGY RESOURCES ... 28
2.2.1. Solar Power ... 31 2.2.2. Wind Power ... 33 2.2.3. Tidal Power ... 36 2.2.4. Hydroelectric Power ... 39 2.2.5. Biomass ... 40 2.2.6. Geothermal Power... 42 2.2.7. Wave Power ... 43
3. APPRAISAL OF ENERGY INVESTMENT PROJECT ... 47
3.1. PROJECT DEVELOPMENT ... 51
3.2. ANALYSIS OF THE COST STRUCTURE OF THE INVESTMENT PROJECT ... 54
3.2.1. Fixed Investment ... 54
3.2.2. Business Capital Investment ... 56
3.3. METHODS OF PROJECT ANALYSIS ... 57
3.3.1. The Methods of Ignoring Time Value of Money ... 59
3.3.1.1. Rate of return method (ROR) ... 60
3.3.1.2. Payback period method ... 60 3.3.2. The Methods of Consideration Time Value of Money (Discounted Cash ...
vii
Flows Method) ... 62
3.3.2.1. Net present value method ... 62
3.3.2.2. Profitability index method (rate of net present value) ... 65
3.3.2.3. Internal rate of return (IRR)... 66
4. FINANCING THE ENERGY PROJECT... 69
4.1. EQUITY FINANCING ... 72
4.2. DEBT FINANCING ... 76
4.3. PROJECT FINANCING ... 78
5. ENERGY IN THE TURKISH MARKET AND A CASE STUDY OF ... 81
WIND ENERGY IN THE TURKISH MARKET ... 81
5.1. A CASE STUDY ABOUT WIND ENERGY IN TURKEY... 87
5.2. ANALYSING NEW ENERGY TREATIES ... 120
5.2.1. Baku-Tbilisi-Ceyhan (BTC) ... 120
5.2.2. NABUCCO Project ... 121
5.2.3. Kyoto Protocol ... 123
5.3. TREASURY ENCOURAGEMENT FOR RENEWABLE ENERGY IN TURKEY ... 125
5.3.1. Ministry of Energy and Natural Resources ... 125
5.3.2. The Facilities of Investment and Development Banks ... 128
6. CONCLUSION ... 132
viii
LIST OF TABLES
Table 3.1 : Component of fixed investment ... 55
Table 3.2 : Cost structure of business capital ... 56
Table 5.1 : Consumption of electricity per person, kwh ... 82
Table 5.2 : Global distribution of total wind capacity between countries (GWEC, 2006) .. 89
Table 5.3 : Wind installed projects in Turkey ... 90
Table 5.4 : Association EWEA 2006 average data of fixed cost. ... 97
Table 5.5 : Unit cost calculation ... 99
Table 5.6 : Total investment of project and capital structure ... 100
Table 5.7 : Interest and principle calculation ... 102
Table 5.9 : Interest and principal payments ... 102
Table 5.10: Operation cost table ... 103
Table 5.12: Cost structure of wind energy ... 103
Table 5.13: Wind energy revenue ... 103
Table 5.14: Proforma income and net cash flow statements ... 104
Table 5.15: Payback period ... 106
Table 5.16: Liquidity analyses... 109
Table 5.17: Depreciation expense for turbine (yearly) ... 111
Table 5. 18: Adjusting total investment of project and capital structure ... 112
Table 5.19: Adjusting cost structure of wind energy ... 113
Table 5.20: Adjusting proforma income and net cash flow statements ... 113
Table 5.21: Adjusting payback period ... 115
Table 5.22: Adjusting liquidity analyses ... 119
ix
LIST OF FIGURES
Figure 2.1 : World energy consumption... 5
Figure 2.2 : World energy consumption; OECD and Non- OECD, 1980-2030 ... 6
Figure 2.3 : Marketed energy use by region (1990-2030) ... 7
Figure 2.4 : Marketed energy use in the Non-OECD economies by region (1980-2030) ... 8
Figure 2.5 : World marketed energy use by fuel type (1980-2030)... 9
Figure 2.6 : Energy prices (2007-2009)... 13
Figure 2.7 : Energy consumption at OECD and Non-OECD countries ... 15
Figure 2.8 : Coal consumption in selected world regions (1980-2030) ... 17
Figure 2.9 : World oil prices in three price cases (1980-2030) ... 20
Figure 2.10: World liquid consumption in three price cases (2030) ... 21
Figure 2.11: World nuclear generating capacity by region, 2006,2015 and 2030 ... 26
Figure 2.12: World renewable electricity generation by source, 2006-2030 ... 29
Figure 2.13: Solar pv capacity(2003-2008) ... 32
Figure 2.14: Wind capacity ( 2003-2008) ... 35
Figure 5.1 : Consumption of electricity per person... 81
x
LIST OF ABBREVIATIONS
Build Operate Transfer :BOT
Build Own Operate :BOO
Commonwealth of Independent States :CIS
Concentrating Solar Power :CSP
Development Bank of Turkey :TKB
Electricity Generation Company :EUAS
Energy Information Administration :EIA Energy Market Law :EML
Energy Market Regulatory Authority :EMRA
European Union :EU
European Wind Energy Association :EWEA General Directorate of Electric Power Resources :EIE
General Directorate of State Hydraulic Works :DSI Industrial Development Bank of Turkey :TSKB
Internal Rate of Return :IRR
International Bank for Reconstruction and Development :IBRD
Kilowatt :KW
Megawatt :MW
Ministry Of Energy And Natural Resources :MENR
Net Present Value :NPV
Organization for Economic Co-operation And Development :OECD Organization of Petroleum Exporting Countries :OPEC
Prototype Carbon Fund :PCF
Rate of Return :ROR
Special Purpose Debt Facility :SPDF
Tons Equivalent of Petroleum :TEP
Turkish Electricity Distribution Company :TEDAS Turkish Electricity Trading And Contracting Company :TETTAS
xi
Turkish Electricity Transmission Company :TEIAS
United Kingdom :UK
1. INTRODUCTION
Energy is a subject that has preserved its popularity for several centuries and about which many books have been written, a lot of research has been conducted. It is crucial for all countries and it caused many conflicts and wars between nations in the past. The turning point for energy came with the increasing need of the world for new resources, especially renewable energy. The reason why this resource is so sought after is, firstly, the considerable decrease in fossil based reserves around the world. Secondly, there is an increasing awareness of protecting the environment, particularly against global warming, calving of glaciers, and ozone layer depletion. Human beings have always been consumers but this outlook needs to change in current era and precautions need to be taken by each country. In this regard, the Kyoto Protocol’s being accepted by almost every country in the world is a sign of change.
Focusing on Turkey’s geopolitical position, it can be seen that Turkey is surrounded by energy reserves on three sides. Despite political and economical limitations and the limitations on efficient use of those reserves, Turkey has the potential to be an energy bridge between countries.
The importance of balanced consumption of energy sources should not be underestimated, especially considering that these sources are in a decline globally. Finding new sources of energy is crucial in solving this problem and this can only be possible by changing traditional understanding. Most countries’ policy about energy is that it should be affordable and reliable. Developed countries implement such policies; on the other hand, the policies of developing countries are generally composed of weak and short-term solutions.
Energy can be divided into two categories: renewable and non-renewable energy resources. This is the focus of this study, as well as how these resources are perceived by certain countries’ governments (presented in graphs.) Investing in renewable energy resources, with the help of international firms, is considered in a favorable light.
2
This study is also an examination of which resources attract investors and which are promising for investment. In this regard, the second section defines both renewable and fossil resources by giving detailed information with graphics; this section also examines the annual global usage of energy resources.
In the third section, economical research and the decision making process for investment projects are analyzed; the five methods of project assessment that can be used during this phase are also analyzed in this section.
The fourth section deals with how investment projects are supported financially. Projects can be financed by equity, loans and other project financing methods. These applications are important to construction and project maintenance.
In the final section, Turkey’s position in terms of the aforementioned resources and funds is examined. An investment project on wind energy in Turkey is focused on as a case study. The study includes actions taken by the government, the regulations passed by the parliament of the Turkish Republic, and international agreements on energy resources.
3
2. SOURCES AND USES OF ENERGY RESOURCES
Energy is categorized in different ways: primary and secondary sources; commercial and non-commercial sources; but the focus of this study is what the United Nations (UN) defines as renewable and non-renewable (fossil based) energy sources.
Fossil based energy resources contain coal, oil, gas and nuclear power. Renewable energy resources consist of solar, wind, tidal, hydroelectric, biomass, geothermal and wave power. These energy resources are among the following topics that will be discussed below.
Before mentioning these categories of energy, it will be useful to focus on the role of energy in the life of human beings. Energy plays a crucial role in all areas of our life, especially on sustainable development. It influences all social, economical, and political activities; the state of the environment and the climate are influenced by it, and often it determines whether nations will live in peace or conflict. According to Steinhagen and Nitsch (2005, p.290), when renewable energy resources are combined with technological advances and conventional energy, sustainable and socially acceptable development is possible. With technological advances, the use of renewable energies has created a variety of resources and has increased levels of energy from Watts to Megawatts. These technologies can be adapted to any kind of energy service and are compatible with modern energy supply systems.
As Steinhagen and Nitsch puts it (2005, p. 288) ‘With extended networks of centralized and decentralized power plants and heat supply systems, security of supply can be ensured. Because of the foreseeable increase in conventional energy prices, a forceful strategy for accelerated introduction of renewable energy sources is not only a requirement for sustainable growth, but also an economically sound policy.’
Renewable energy should also be sustainable, clean and should not cause environmental damage. With the increase of the negative impacts of fuel ( coal, oil and gas) on the climate and with the depletion of major fossil fuel reserves, talks on renewable energy are more
4
prevalent than ever before and are becoming crucial for political stability and reliability (Thomas 2010).
As Tony Hayward states, with the help of governments, renewable energy resources have become widespread when they are used to provide the total of the energy required. However, when renewable and non-renewable sources are combined to provide energy, renewable sources comprise a small portion of the mix. Some countries, especially developed ones, have been calling attention to wind, solar and geothermal power capacity as sources for energy(Bp Statistical Review 2008, p.5).
Energy is on demand everywhere and we always need it. The most important question is how we can obtain the sources we need and how we can consume them in the most balanced way. If we are really conscious about how we use our resources, energy consumption in the future will be less than today. But if we are insistent on being careless and indulgent, depletion of reserves will be a significant problem in the future. It is obvious that solar power can not be the source for all energy production. So, the question is how to supply the energy demand (Uyar 2007, pp.6-9).
Rather than focusing on the supply of energy, concentrating on the consumption of it is very important here because if energy consumption is reduced and prices decrease accordingly, demand will enter a falling trend. The Energy Information Administration (EIA) (2010) estimates that, world energy consumption will increase by 59 percent by 2010. As a result, since resources will be limited in supply, prices will rise relatively. However, renewable energy resources have the potential to meet this demand and are therefore favorable for government investment, providing a solution to the problem. When we consider all this in the long term, this should be kept in mind (http://www.eia.doe.gov/ 2010).
According to the World Energy Council, the energy sector will be affected the most in the 21st century by the economic crisis. Globally, total investment on energy sources was
5
(http://www.worldenergy.org/documents/energy_efficiency_es_final_online.pdf 2008, p.3).
The energy sector is not only responsible for energy production but also for conversion of energy into other forms of energy, for storage, consumption, and assessment of the resulting waste (National Renewable Energy Laboratory 2000, p.18).
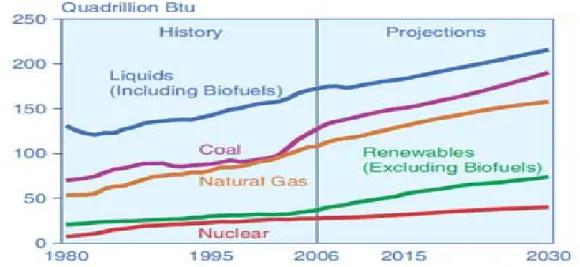
Figure 2.1: World energy consumption
Source: History: Energy Information Administration (EIA), international annual 2006(June-December 2008). Projections: EIA World energy projection plus (2009)
According to the EIA (2009, p.8) reports (see figure 2.1), world energy consumption is expected to increase by 44 percent by 2030 when compared to 2006 (forecasted figures). From 1980 to 2006, world energy consumption increased 66 percent (final figures). There is a decrease in estimated future energy consumption when compared to previous years thanks to the quest for new sources. Apart from this, awareness and sensitivity pertaining to energy consumption are also factors affecting future consumption. In the past, energy consumption increased sharply; but in the future, countries will take measures with new policies to prevent this. When we examine levels of consumption between the years 1980 and 2030, there is a 140 percent increase. If we look on the bright side, this indicates a
6
developing civilization and growth. However, when we look at the rate of consumption, we see that we have to take certain measures to maintain sustainable energy. The most effective of these measures will be to give up old methods and replace non-renewable sources with renewable ones.
Figure 2.2: World energy consumption; OECD and
Non- OECD, 1980-2030 Source: History: Energy Information Administration
(EIA), international annual 2006
(June-December 2008). Projections: EIA World energy projections plus (2009)
When we look at figure 2.2 of OECD and non- OECD countries, we see a discrepancy in annual consumption rates. Until 2006, energy consumption in OECD countries was greater than non-OECD countries; but after 2006, projections change and non-OECD countries’ consumption becomes greater. I think the most significant reason for this is the development of technology and industry, and the increase in energy demands of non-OECD countries such as China and India. Besides this, new environment related carbon emissions agreements which are signed by OECD countries, such as the Kyoto agreement, to adopt more careful practices while consuming energy resources, is a consideration (International Energy Outlook data 2009, p.9).
7
Figure 2.3: Marketed energy use by region (1990-2030) Source: History: Energy Information Administration (EIA),
international annual 2006 (June-December 2008). Projections: EIA World energy projections plus (2009)
It is important to examine figures 2.3 and figure 2.4 together. In these figures, we can see the use of energy resources in different regions and countries differ in intensity and distribution is not balanced. Upon general examination, China and India in particular are leaders in energy consumption and use. These two countries, after 2010 year, will take up a considerable share (International Energy Outlook data 2009, p.9).
According to Energy Information Administration data (2009):
China and India are the fastest-growing non-OECD economies, and they will be key world energy consumers in the future. Since 1990, energy consumption as a share of total world energy use has increased significantly in both countries. China and India together accounted for about 10 percent of the world’s total energy consumption in 1990, but in 2006 their combined share was 19 percent. Strong economic growth in both countries continues over the projection period, with their combined energy use increasing nearly two fold and making up 28 percent of world energy consumption in 2030 in the reference case. In contrast, the U.S. share of total world energy consumption falls from 21 percent in 2006 to about 17 percent in 2030.
8
Figure 2.4: Marketed energy use in the Non-OECD economies by region (1980-2030)
Source: History: Energy Information Administration (EIA), international annual 2006(June- December 2008). Projections: EIA World energy projections plus (2009)
When we examine figure 2.4, we get an idea of non-OECD countries’ share of energy sources. Non-OECD countries such as Russia, China, and India comprise a serious factor in global energy consumption so it is important to take into consideration regions of these non–OECD countries. Non-OECD Asian countries like China and India have had significant increases in their energy consumption over the years. Non-OECD Eurasian countries such as Russia and the countries that made up the former Soviet Union (CIS) are not massive consumers. Energy consumption continues to be stable among these countries. Non-OECD Middle Eastern countries such as Iran, Iraq etc. also do not have a very large share. Also, in African countries, energy consumption is minimal because industry is not very developed in this region. As is generally known, Russia, Iran and Iraq are leaders in energy production and export but are not great consumers. In China and India, fast growing industry has had a direct effect on energy consumption and takes up a large portion of the energy consumed in those countries (International Energy Outlook data 2009, p.11).
In addition, in reference to non-OECD countries’ energy uses as demonstrated in figure 2.4, I would like to outline in detail the Energy Information Administration’s explanation of the
9
effects of global crises on financial systems as related to energy costs. Recent problems within the global financial system have made taking out loans from banks and other institutions difficult in non-OECD European and Eurasian countries such as Russia, Kazakhstan, and the Ukraine. The impact was softened somewhat by higher world market prices for commodity exports but not in the short term because of the collapse of commodity prices and worsening global economic situation. High global oil prices affect the energy sector, especially the Caspian region, influencing their investment prospects. With the changes in energy market prices, it is not likely that the economies of non-OECD European and Eurasian countries will be able to sustain the growth rates recently achieved until they achieve more broad-based diversification from energy production and exports. The Former Soviet Republic countries’ economies are supported economically in a variety of ways and will make further improvements domestically in their financial markets in the long-term (International energy outlook 2009, p.12).
Figure 2.5: World marketed energy use by fuel type (1980-2030)
Source: History: Energy Information Administration (EIA), international annual 2006 (June-December 2008). Projections: EIA World energy projections plus (2009)
Figure 2.5 above demonstrates approximately how much and which energy resources are being used yearly. Figure 2.5 provides a visual representation of the facts and presents new
10
energy sources and determines the course of the trend. It is a complicated and long process which requires extensive feasibility studies to leave behind old methods, develop new models, pursue different courses of action; and one that necessitates a lot of cash flow (International Energy Outlook data 2009, p.15).
This is a part of my dissertation that is still in progress, and I will provide more detailed information presently. If we examine the above statements, there are many indications that make it appear that nuclear can not be much in demand. It is does not constitute a large share of the global market. Fossil based energy resources, such as coal and liquid fuels, make up a significant share of these total sources. Attempts have been made to make room for renewable energy sources and usage over the years is expected to increase. But if we look at the data provided by the EIA (2009, p.18) presented in figure 2.5, in detail, we can see that there is not room allocated to renewable energy, as expected. Although these sources are on the agenda worldwide, it would appear actual implementation is intangible. Perhaps leaving history behind and abandoning retrospective views is not favored and therefore, currently, it is difficult to find the place for renewable energy that it deserves. Because the usage of renewable energy sources is a new concept, making the necessary investments and getting things running efficiently will take approximately 7-8 years. In the production of electricity, all resources are used efficiently. Liquid fuels are not the preferred resource for electricity production. On the contrary, coal is. The demand for natural gas and renewable sources are parallel. The most important point here is that nuclear power is more in demand than liquid fuels. As a result, fossil based sources still remain popular; and the addition of new sources and the usage of renewable sources are starting to be seen in a favorable light.
In analyzing the data on the table provided by the Energy Information Administration (EIA) in detail, we can see that it is important to determine which areas demand the most energy and is their average growing demand from year to year. Energy sources are most commonly used in the commercial sector, the industrial sector and the transportation sector.
11
According to the Energy Information Administration web-site, the commercial sector is sometimes referred to as the services sector or the services and institutional sector, and contains businesses, institutions and organizations that provide services. The commercial sector contains many different types of buildings and a wide range of activities related to energy services. Facilities in this sector include: schools, hotels, stores, restaurants, museums, etc. but the most energy is used in buildings or structures that supplying services such as heating, lighting, water heating and cooling. In addition, besides buildings, energy is also needed for traffic lights and city water; these types of usage also fall into the commercial energy use category. Also, economic growth determines the degree to which additional facilities and activities are offered and utilized in the commercial sector. If there are high levels of sustainable economic growth, this means that the demand for energy in hotels and restaurants, cultural canters, theatres, galleries and sporting venues will influence the business cycle. According to EIA, “In the commercial sector, as in the residential sector, energy use per capita in the non-OECD countries is much lower than in the OECD countries. Non-OECD commercial energy consumption per capita averaged only 1.3 million Btu in 2006, compared with the OECD average of 16.3 million Btu.” These statistics are in reference to countries sustaining economic growth (http://www.eia.doe.gov/oiaf/ieo/ 2009, p.86).
Another important sector in terms of energy consumption which needs to be covered intensively is the industrial sector. The industrial sector encompasses a diverse number of areas such as: manufacturing, agriculture, mining and construction; and it also includes a wide range of activities such as: processing and assembly, space conditioning, and lighting; in addition, the diversity of the demand in this sector changes from region to region; it changes based on the level and mix of technological and economic development, among other factors. Other factors in the industrial sector include using natural gas and petroleum for feed stocks to produce non-energy products. For aggregates, the industrial sector uses more energy than any other end-use sector, consuming about one-half of the world’s total delivered energy (http://www.eia.doe.gov/oiaf/ieo/ 2009, p.97).
12
According to EIA, in the transportation sector energy is used to move people and goods by road, rail, air, water, and pipeline. Transportation components are light duty vehicles such as automobiles, sport utility vehicles, minivans, small trucks, and motorbikes, as well as heavy-duty vehicles, such as large trucks used for moving freights and buses for passenger travel. The demand for energy in the transportation sector is directly linked to the rate of economic growth and population size. As it is mentioned on the EIA website, economic growth spurs industrial output, which requires the movement of raw materials to manufacturing sites, as well as the movement of manufactured goods to end users. Energy demand in the transportation sector is increasing steadily in both non-OECD and OECD countries. Personal travel is a primary factor underlying projected increases in energy demand for transportation (http://www.eia.doe.gov/oiaf/ieo/ 2009, p.113).
2.1. FOSSIL BASED ENERGIES (NON-RENEWABLE ENERGY)
Fossil fuels such as oil, coal and gas, which are used widely today, are not renewable sources because they burn and run out. They are made up of dead plants and animals. Fossil fuels supply a huge portion of the world’s demand for energy including heating, transport, electricity generation and other uses. At first glance, non-renewable resources are a gift for us from our environment. But they are not renewable. Of course fossil fuels have advantages. Because of this, they have been preferred a long time. With fossil fuels, very large amounts of electricity can be generated in one place using coal and for fairly cheap. Transporting oil and gas to the power stations is easy. Gas-fired power stations are very efficient. A fossil-fuelled power station can be built almost anywhere, so long as you can get large quantities of fuel to it. Basically, the main drawback of fossil fuels is pollution. Burning any fossil fuel produces carbon dioxide, which contributes to the "greenhouse effect", warming the earth. Burning coal produces more carbon dioxide than burning oil or gas.
It also produces sulfur dioxide, a gas that contributes to acid rain. Mining coal can be difficult and dangerous. Strip mining destroys large areas of landscape. Coal-fired power stations need huge amounts of fuel, which means train-loads of coal almost constantly
13
coming and going. In order to deal with differences in demand for power, there needs to be more stations that are have easy access to reserves. As a result, the reserves must be near cities ( http://home.clara.net/darvill/altenerg/fossil.htm 2010).
The price of fossil based resources is important; it affects the preference for them and substitution options. In general, with the beginning of industrialization, fossil based sources have been increasingly on demand. With this perspective in mind, resources have become important in the political outlook.
Figure 2.6: Energy prices (2007-2009)
Source: Includes data from Platts and McCloskey, BP statistical review of world energy, June 2009
When we review the data on energy prices in the last two years around the world in figure 2.6, we see a decrease in the price of oil, coal and gas in January 2009. The most important point here is that the drop in price is consistent with all three resources. The price of coal is the most expensive which is an indication that it the most in demand. The price of gas is the lowest since intensive privatization has brought about competition which led to a drop in prices. In addition, the 2007 global crisis also affected prices. With the start of the crisis prices fell slightly. The fact that the prices of all three resources dropped is remarkable. In 2007, coal prices remained below that of oil and gas. However after 2007, this situation
14
was reversed. There is an issue here that should be considered; the increase in coal prices attracted attention in that one of the reasons for the lesser popularity of renewable sources is the high prices associated with them. What was the reasoning behind the price of coal increasing while it is one of the highest producers of carbon emissions? Environmental policies may be the reason for inflated coal prices during this period (Finley 2009, p.5).
As Bp group Chief Tony Hayward states, in 2008, the amount of global energy consumption slowed with the halt in the economy and higher than average prices breaking a string of five consecutive years of above-average growth. Production growth exceeded that of consumption for all fossil fuels. For the year as a whole, prices for all forms of traded energy rose substantially despite sharp declines late in the year. Oil prices reached inflation-adjusted record highs, rising for the seventh consecutive year. Internationally traded coal prices rose more steeply than other fuels (Finley 2009, p.7).
Although when it comes to non-renewable energy sources the output of coal is the leader, oil is more commonly used, especially in the transport and industrial sectors. Also, the popularity of gas is increasing in these sectors. The progress of technology and improving standards of living within progressing civilizations have brought down the level of coal usage when compared to natural gas, which has increased in popularity as it is a cleaner burning resource. Natural gas is now the preferred source in homes instead of having pipelines from quarries into houses (BP statistical review 2008, p.8).
According to Bp group Chief Tony Hayward, fossil fuel consumption growth slowed because primary energy consumption growth slowed. Rapidly industrializing non-OECD countries, especially China, are responsible for all the net growth in energy consumption, accounting for nearly three quarters of global growth. “For the first time, non-OECD energy consumption surpassed OECD consumption. For a sixth consecutive year, coal was the fastest-growing fuel – with obvious implications for global CO2 emissions. Their data confirms that the world has enough proved reserves of oil, natural gas and coal to meet the world’s needs for decades to come. The challenges the world faces in growing supplies to
15
meet future demand are not below ground, they are above ground. They are human, not geological” (BP statistical review 2008, p.8).
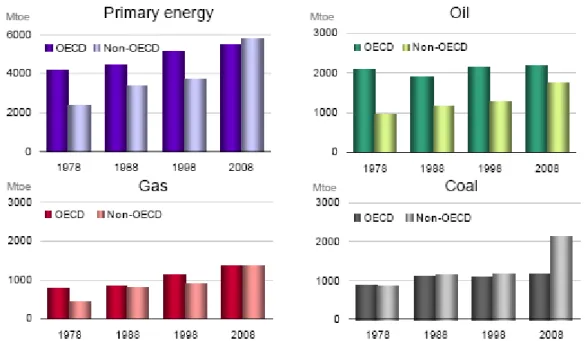
Figure 2.7: Energy consumption at OECD and Non-OECD countries Source: BP Statistical Review of world energy, June 2009
In figure 2.7 above, the consumption of fossil based sources over the years of OECD and non-OECD countries is outlined clearly. It is important to examine this table as it provides an opportunity to examine the consumption of these resources. As expected, the tables show a clear change in 2008. It is a priority to mention that the consumption of all fossil energy tended to increase between 1978 and 2008. If we accept this as a trend and compare OECD to non-OECD countries, non-OECD countries have experienced big jumps. When we look at the table, except for oil, non-OECD countries’ fossil energy consumption is more than OECD countries’ fossil energy consumption. Non-OECD countries such as Iran, Iraq, and Arabian countries, which have high volumes of oil reserves, maintain control over petrol reserves; as a result, OECD countries’ dependence on these countries still remains. In non-OECD countries, with the growth of industry, the demand for gas and coal, for primary energy sources increases. This demand for primary energy sources is a serious signal for non-OECD countries about their yearly dependence on fossil resources. In 2008, coal consumption in OECD countries was half of the consumption in non-OECD countries. The
16
reason for this is renewable energy, which has become more in demand in OECD countries that may be trying to minimize carbon emissions (Finley 2009, p.7).
2.1.1. Coal
Coal is first crushed into fine dust and then burnt. Coal provides around 28% of our energy and it receives its energy from the sun; dead plants contain solar energy in them and when they die and drop onto the soil, in time they became coal. And when we use them, the energy gives off light. Burning coal produces sulfur dioxide, an acidic gas that contributes to the formation of acid rain. This can be largely avoided using "flue gas desulphurization" to clean up the gases before they are released into the atmosphere. This method uses limestone, and produces gypsum for the building industry as a by-product. However, it uses a lot of limestone (http://home.clara.net/darvill/altenerg/fossil.htm 2010).
The use of coal is centuries old. The China Cheng mines have been running thousands of years. Around the world, coal energy has been a leading resource up to the 20th century. United Kingdom (U.K.) is known to have an important place as a producer and exporter of coal. (Oluklulu, 2003, p.12).
The largest and oldest coal fires in the world have occurred in China, the United States and India. These three countries have a big impact on coal mining. Removing coal from the underground is difficult. It requires technical support and human labor. Techniques used to fight coal fires include slurry and ash injection, surface and tunnel sealing, aqueous foam technology, remote sensing, and computer software. Elusive, unpredictable, or cost prohibitive coal fires may burn indefinitely, choking the life out of a community and its environs while consuming a valuable natural resource (Stracher and Taylor 2004, p.13).
17
Figure 2.8: Coal consumption in selected world regions (1980-2030)
Source: History: Energy Information Administration (EIA), international annual 2006(June-December 2008). Projections: EIA World energy
projections plus (2009)
In figure 2.8 above, we can review coal consumption in selected world regions from1980 to 2030. Especially in China, coal consumption is expected to increase. From 1980 until 2030 there was not and nor is there expected to be big jumps in the consumption of other major countries. China and India are the most striking in figure 2.8. With the economic growth in these countries, increases in the consumption of coal have occurred. Coal is used extensively in the industry sector, and the future prospects of these two countries in terms of production and consumption is bound to be substantial. With the exception of the United States, coal consumption around the world decreased(International Energy Outlook data 2009, p.43).
Global coal consumption slowed in 2008, yet coal remained the fastest-growing fuel in the world for a sixth consecutive year. In China (the world’s largest consumer, with a 43 percent share), consumption grew by 6.8 percent, below the 10-year average but still sufficient to account for 85 percent of global growth. In liberalized energy markets, coal prices in 2008 increased more rapidly than other fossil fuels; consumption growth outside
18
China was a weak 0.6 percent. Growth was below the 10-year average for every region but South and Central America and Africa (Finley 2009, p.11).
According to MENR, in 2007, total primary energy consumption of our country was 106 million tons equivalent of petroleum (TEP). In energy consumption, coal has a significant share of 28 percent. Lignite is a type of coal which is usually placed at the bottom of the coal list since it has low heating value, and high ash and humidity content, and is typically used as fuel for thermal power plants. However, it is an energy raw material that is used frequently due to its abundance in the earth's crust. Hard coal is classified as a high-calorie coal. Of our domestic resource potential, 10, 4 billion tons is lignite, and 1, 33 billion tons is hard coal. On the global scale, we are a middle-level country in terms of lignite reserves and production amounts, and lower-level in hard coal. Having about 1, 6 percent of the world's total lignite reserves; Turkey's total lignite reserve is at 8, 3 billion tons. Yet exploitable reserves are at 3, 9 billion tons. Furthermore, having a low heating value, the majority of our lignite is typically used at thermal power plants. Of the 33 million tons of coal sold in 2008, 82 percent went to thermal power plants, and 12 percent went to heating and industry. As of the end of 2008, installed power of lignite-based thermal power plants in our country is 8.110 MW, which corresponds to 19, 4 percent of our total installed power. Contribution of coal to total installed power is 10.097 MW, which corresponds to 24, 1 percent of our total installed power. Installed power of our hard coal based thermal power plants is 335 MW, which corresponds to 0, 8 percent of our total installed power (http://www.enerji.gov.tr/index.php?dil=en&sf=webpages&b=enerji_EN&bn=215&hn=& nm=40717&id=40717 2009).
2.1.2. Oil
Oil provides 40 percent of our energy and can be burnt directly. Crude oil, termed petroleum, is easier to get out of the ground than coal as it can flow along pipes. This also makes it cheaper to transport. This also makes it cheaper to transport. Some scientists are claiming that oil is not a 'fossil' fuel because it is not the remains of prehistoric organisms. They claim it was made by some other, non-biological process. Currently this is not
19
accepted by the majority of scientists (http://home.clara.net/darvill/altenerg/fossil.htm 2010).
Oil was first used 3000 years ago with the formation of tar. The Mesopotamian nation made use of tar to compensate for water deficiencies in nature. In ancient times, oil was used for cleaning wounds, relieving rheumatism, etc. and other ailments. It was also used for fighting tools during wars. What we understand from this is that oil was used for other purposes besides as a source of energy (Oluklulu 2003, p.21).
According to the Ministry of Energy, petroleum consists of a complex formula of hydrogen and carbon, and contains a little bit nitrogen, oxygen and sulfur. Gas, in liquid and solid states, may also be present. Liquid petroleum, which is refined, as opposed to raw petroleum, is commercially the most important one. Petroleum in gas state is typically referred to as natural gas in order to distinguish it from synthetic gas. Semi-solid and solid petroleum consists of heavy hydrocarbon and tar. This type of petroleum is called asphalt, bitumen, tar and other names depending on their properties and local use. Since main components of raw petroleum and natural gas are hydrogen and carbon, they are also referred to as "Hydrocarbons." Taking the world's existing energy sources from proven reserves and annual production amounts into consideration, the reserve life of petroleum is estimated at 42 years. Being the primary source of energy across the globe, petroleum meets 35, 6 percent of the global energy demands as of 2007. Of petroleum reserves, 100 billion tons (62 percent) are in Middle Eastern countries, 16,7 billion tons (10 percent) in Russia and the CIS, and 14,9 billion tons (9 percent) in Africa (http://www.enerji.gov.tr/index.php?dil=en&sf=webpages&b=enerji_EN&bn=215&hn=&n m=40717&id=40717 2009).
Initially, because it was found in limited amounts, petroleum use was not common until the 18th century. Petroleum was first used in lighting and as technology progressed, it started to be used in the transportation sector. Petroleum is a very important source of energy because of its economic and political role. The Organization of Petroleum Exporting Countries (OPEC) was established in order to prevent any one country from monopolizing
20
the oil export industry. This organization aims to control and reduce the volatility of fluctuations in oil prices. During the 1973-74 oil crisis, however, OPEC was powerless to prevent Eastern countries from putting an embargo on Western countries and thereby causing oil prices to go up almost four times what they were before the embargo. The second crisis took place in 1978-79, prices increased sharply again, and OPEC was once again ineffective. It would appear that those countries that have oil in their control tend to swing a power bat and it is no easy task to prevent this (Oluklulu 2003, p.23).
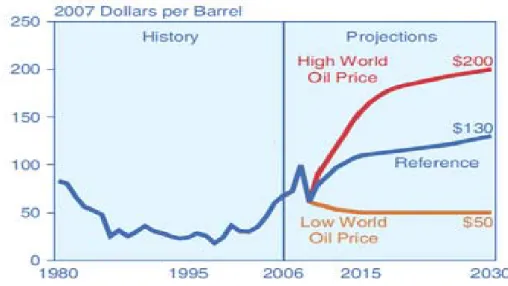
Figure 2.9: World oil prices in three prices cases (1980-2030)
Source: EIA, Annual energy Outlook 2009, DOE/EIA-0383(2009) (Washington, DC, June, 2009) www.eia.doe.gov/oiaf/aeo
Figure 2.9 above presents a price fluctuation forecast from 1980 to 2030. In this table, we need to take note of the high prices during the oil crisis in 1980. However, prices remained low until 2007. In the years between 2007 and 2030 the prices are expected to rise. I believe the reason behind this the strategic and political implications of oil. It is difficult to account for the gap between the highest and the lowest prices as the fluctuations are difficult to estimate because of: political changes; the orientation of new investments in Arab countries; and the war in Iraq (International Energy Outlook data 2009, p.48).
21
Figure 2.10: World liquids consumption in three price cases
(2030)
Source: EIA, world energy projections plus 2009
Consumption by sector on figure 2.10 above references high, low and reference prices for liquid distribution. All three columns refer to liquid consumption. The transportation sector leads while the industrial sector is second. Ignoring the unbalanced distribution between the former two sectors and the latter electricity, commercial and residential sectors would almost be negligible. Perhaps we can conclude that, given the relatively little use of the electricity, commercial and residential sectors of non-renewable liquid resources when compared to the other two, it will be easier for them to transition to renewable sources of liquid. In this regard, continued investments in renewable sources are foreseeable (International Energy Outlook data 2009, p.45).
As the Ministry of Energy states (2009):
About 72 percent of world's producible petroleum and natural gas reserves are located in the vicinity of our country. Due to its geopolitical position, Turkey is neighbors with countries that own three fourth of world's proven petroleum and natural gas reserves, and takes part and supports numerous important projects acting as an "Energy Corridor" between the energy-rich Caspian, Central Asian and Middle Eastern countries and consumer markets in Europe. Projections suggest that a substantial part of world's energy consumption, which is expected to increase by 50 percent by 2030, will be met by resources from our region.
22 2.1.3. Gas
Gas is similar to oil in that it can be burnt directly. Natural gas comprises around 20 percent of the world's consumption of energy. After the 1970 crisis, the price of petrol went up and, as a result, gas became more on demand. Natural gas is lighter than air; it is mostly made up of a gas called methane. Methane is a simple chemical compound that is made up of carbon and hydrogen atoms. Natural gas is usually found near petroleum underground. It is pumped from below ground and travels in pipelines to storage areas. It is extracted in the same way as petroleum, and later transmitted via large pipelines. Natural gas usually has no odor and you cannot see it.
Between 6,000 and 2,000 BCE (Before the Common Era), the first discovery of natural gas was made in Iran. Many early writers described the natural petroleum sources in the Middle East, especially in the Baku region of what is now Azerbaijan. The gas resource, probably first ignited by lightning, provided the fuel for the "eternal fires" of the fire-worshiping religion of the ancient Persians.
On the public website of the Ministry of Energy, there is detail information about natural gas reserves. Excepting Turkey, 73 trillion cubic meters (41 percent) of global natural gas reserves are in Middle Eastern countries; 59 trillion cubic meters (33 percent) in Russia and CIS; and 28 trillion cubic meters (16 percent) in Africa/Asia Pacific countries. Turkey’s domestic potential in natural gas is about 27 billion m³. By the end of 2008, natural gas consumption was expected to increase by 5, 5 percent compared to the previous year, reaching 33, 6 million TEP. Turkey’s installed power in natural gas is about 13.337 MW, which is 31, 8 percent of our total installed power. As it is mentioned in natural gas studies, problems in meeting the annual gas demand are not expected until 2011. In this context, commissioning in 2007 of the Silivri natural gas depot, which has a capacity of 1, 6 billion m³, has been very beneficial for ensuring availability of seasonal supply. Nowadays, research will be conducted and measures will be taken for improving the capacity of existing natural gas depots and for building additional underground depots,
23
particularly in Salt Lake; and, also, natural gas has been discovered in Akçakoca city (www.enerji.gov.tr 2010).
As mentioned by the Ministry of Energy, The Baku-Tbilisi-Erzurum (BTE) Natural Gas Pipeline (Shah Sea Project), which aims to carry Caspian gas resources to Turkey and European markets, has been commissioned. Gas transmission started on November 26, 2006, and the first production of the Shah Sea Project started on December 15, 2006. Also, the process of creating the trans-Caspian petroleum and gas pipelines, in the context of Turkmen and Kazak resources, was planned in a way that was related to other projects. In 2007, the Greek connection of the South European Gas Ring (Turkey-Greece-Italy Pipeline), which aims at transmitting Caspian and Middle Eastern gas resources to EU markets, was completed an commissioned. The Italian connection is due for completion in 2012. With an annual capacity of 12 billion m³, this project will have a significant share in Greek and Italian gas markets, and constitutes the first step in the integration of the Turkish gas system with the EU. Work is still in progress with regard to the NABUCCO Project which, within the scope of activities to bring natural gas to Europe, will connect Turkey to Austria via Bulgaria, Romania and Hungary, and will carry Caspian and Middle Eastern gas resources to the Central European Natural Gas Distribution Center. Listed as one of the top-priority projects in EU official documents, the aim of the NABUCCO project is to carry, in its first stage, 25 to 30 billion m³ of gas annually over a line of 3.400 km. This figure is expected to increase in the years to come. Work is in progress with the Arabic Natural Gas Pipeline Project for transmitting Egyptian natural gas resources to our country (www.enerji.gov.tr 2010).
According to the Ministry of Energy, the Baku-Tbilisi pipeline, the NABUCCO project, the Turkey-Greece-Italy projects and other project agreements were established in order to supply all of the global natural gas demand. Heating energy, especially natural gas, has a significant share. Sources other than coal are preferable because of they are cleaner.
24 2.1.4. Nuclear Power
According to Energy Ministry of Turkey, breaking up atomic nuclei yields to a huge amount of energy. Obtained through fission and fusion reactions, this energy is called nuclear energy. Nuclear reactors are systems that transform nuclear energy to electricity. Fundamentally speaking, nuclear energy released as a result of fission is transformed to thermal energy within nuclear fuel and other materials, which is in turn converted into kinetic energy and then into electricity within the generator system. They are stored in shielded concrete underground galleries to be built 1.000m under surface in geologically stable areas. A 1.000 MW nuclear reactor produces about 27 tons of used fuel in a year.
In 1965, the first commercial nuclear power plant was constructed. In contrast to other sectors, the nuclear power sector got started on the premise of a national independence strategy. This sector’s investment projects are financed by the government (Oluklulu 2003, p.23).
Until 1979, there was a rapid expansion of nuclear power plants. After 1979 however, expansion came to a halt because: electricity yields greater capital in developed countries; the issues in the past relating to the consumption of oil energy have decreased; central costs constantly increasing; and the uncertainty about the reliability of nuclear energy (Yücel 1994, p.117)
The White Paper discussed the positive aspect of nuclear energy. This source has low carbon emissions; it is affordable and dependable; and it is safe. In further detail, low carbon means minimizing the negative effects of climate change. It is affordable because it is currently one of the cheapest low carbon electricity generation technologies, so it could help us achieve our goals in a cost efficient manner. It is dependable because it is a proven technology with modern reactors capable of producing electricity reliably. It is safe because it is backed up by a highly effective regulatory framework. It is also capable of increasing diversity and reducing our dependence on any one technology or country for our energy or fuel supplies. Companies that build nuclear power plants need immense technical and
25
financial strength. This is hard to square with the need. If competition is to be effective, there need to be large numbers of competing companies (Thomas 2010).
As stressed by the Ministry of Energy, for the generation of electricity, nuclear power plants are safer and more available compared to other sources such as thermal and hydraulic power plants. With global developments, renewable energy sources have become more common, widespread and more in demand. Nuclear energy investment projects are also gaining impetus worldwide. Based on electricity energy supply and demand projections, 5.000 MW nuclear power plant capacity is planned to be commissioned as of 2015. To that end, Law No. 5710 on Construction and Operation of Nuclear Power Plants and Law on Sale of Energy (2007) were enacted. Construction of nuclear power plants is in progress. A license has been obtained for the first nuclear power plant in Turkey, which is planned to be in Mersin-Akkuyu, and licensing work for Sinop is underway (www.enerji.gov.tr 2010).
The perspective of the Ministry of Energy is as stated above. But the people's perspective is not positive as the government’s. Until 1960, Turkey’s point of view on nuclear energy was positive, although not very well understood. The explosion of the Chernobyl nuclear plant in 1984 changed perspectives.
26
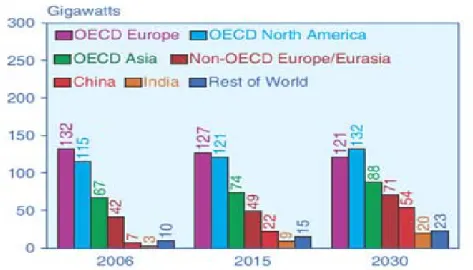
Figure 2.11: World nuclear generating capacity by region, 2006, 2015 and 2030
Source: History: Energy Information Administration (EIA), international annual 2006(June-December 2008). 2015 and 2030: EIA World energy projections plus (2009)
In figure 2.11 above, a detailed breakdown of data about the regions in the world with the capacity to generate nuclear energy according to the EIA annual report can be reviewed. OECD countries in Europe generate 2006, 2015, 2030 Gigawatts of nuclear energy according to annual estimates. So which of these countries in nuclear energy is the front blade? Germany and France are leaders in nuclear energy production. The United States also has an impact on nuclear energy production. South Korea is the leading OECD country in Asia and has opened a series nuclear power plants. Also, Russia, the non-OECD Eurasian country, has an important role in nuclear power plants. China and India have 2 percent of the world’s nuclear energy capacity. The total capacity of OECD Europe in the year 2006 was 35 percent; OECD North America was 31 percent; OECD Asia was 18 percent; non-OECD Europe and Asia share 11 percent; and the rest of the world has 2 percent share. In fact, the reliability of this data may be questioned since there are countries that may have used nuclear energy for unethical reasons. However, the use of nuclear energy within the industry is legitimate and the data here can be trusted here. The source of nuclear energy can be dangerous and very risky. It can also be used as a weapon for war. Countries that have a particularly large share can impact the economy of the world. For
27
countries like the U.S.A, South Korea, Russia, and Germany especially, this nuclear power has a strategic importance (International energy Outlook 2009 pp.51-52).
Most recently, a new nuclear plant was built in South Korea, Russia and the Ukraine. In total, approximately 17 percent of electricity production is provided by nuclear power plants (Ültanır 1998, p.152).
According to Steve Thomas (2002, p.3):
In part, the removal of the nuclear subsidy was possible because of efficiency improvements in the nuclear industry and this was welcome. However, it was possible partly because the burden of paying for long-term costs such as radioactive waste disposal and decommissioning was shifted from today’s electricity consumers to future generations of taxpayer. This runs counter to the ‘polluter pays’ principle and cannot be regarded as equitable.
According to Tanay Sıdkı Uyar, as of 2050 , only 10 percent of nations will use nuclear energy, though about 1,000 of them will need new nuclear power plants to be established (currently there is approximately 440 worldwide). Perhaps it is possible to establish a thousand new plants but it will take a decade. These plants were established with much of the uranium reserves in a very short period. The International Atomic Energy Agency (IAEA) admits that the rapid spread of nuclear energy is altering the climate. To stop climate change and its negative effects is only possible with renewable energy sources and related energy saving developments (Uyar 2008, p.15).
According to Stephen Thomas (2010, p.23):
If nuclear power really was an essential element to combating climate change then there might be no alternative but to acknowledge that there are economic and other problems and devise ways of reducing their impact. However, electricity accounts for less than 20 percent of the energy we use and we currently get less than 20 percent of our electricity from nuclear sources, so even if we replaced all the existing plants (which would need about 6 new reactors) and built enough additional plants to bring the share of nuclear electricity up to 60 percent (a total of 20 reactors), nuclear power would only be providing about 10 percent of our energy needs.
Correct use of nuclear energy is very important. In most cases, nuclear energy is not synonymous with nuclear weapons. While have been writing this thesis, two of the larger
28
and more powerful countries around the world (U.S.A and Russia) have signed the Start-II treaty to reduce nuclear weapons. The purpose of this agreement is to minimize large losses in the future as nuclear weapons are difficult to control. Besides these two countries, North Korea and Iran have acquired a significant amount of nuclear power, especially in the last 10 years. These countries should act in accordance as soon as possible.
2.2. RENEWABLE ENERGY RESOURCES
Renewable energy is defined as ‘nature’s own evolution in an energy source that can be available in the same way the next day. It is not true that renewable energy sources provide less energy than fossil based and nuclear sources. We are living in an atmosphere that is generously provided for by the sun. We did not have the technology to make use of the sources for electricity and heat that we have come to depend on for energy in the1850s. We have only had the technology to fully benefit from fossil and nuclear sources for the last 30 years. With renewable energy, it is possible to fulfill all our needs. Nations are capable of using renewable energy sources to supply the country's transportation, industrial, residential and agricultural sectors with heat and electrical energy, our own included (Uyar 2006, pp.123-124).
29
Figure 2.12: World renewable electricity generation by source, 2006-2030
Source: Energy Information Administration (EIA), international annual 2006 (June-December 2008). Projections: EIA World energy projections plus (2009)
The Energy Information Administration data presented in figure 2.12 illustrates the actual and the expected electricity generation of renewable energy around the world from 2006 to 2030. Here we are looking at the share of the total increase over the years and at the expected yearly allocation of resources. As in previous years, proportions in kilowatt-hours change as expected. Hydroelectric power plants are how widespread these days, and are expected to be especially prevalent in the future. The installation and maintenance costs of dams as a source of electricity are higher; nonetheless, the future demand for this particular resource renders the expense a lucrative investment. Nowadays, as often referred to by companies in this sector, wind energy will take up a large share of renewable energy in the future. This type of energy does not harm the environment; and despite the large numbers of tribunes it requires, it produces relatively little noise. The existing turbines are set up on hills where there is a large concentration of wind and no human settlement. Another clean and environmentally friendly resource is geothermal energy; though not very common in the world over. The necessity to install high steam energy stations at each point makes it impractical. Geothermal energy does not constitute a large share of total renewable energy (International Energy Outlook 2009, p.72).
30
The German parliament set up a plan in 2002 indicating their aim of supplying all of Germany's energy needs with renewable energy by 2050. It is a small measure in the grand scheme but with the dense population, concentrated use of energy and the sustained high standard of living, this small measure could be considered a big step. It is possible that by 2050, more than the total amount of energy used worldwide today can be supplied by renewable energy sources, only if the energy sector comes to an agreement works towards this aim as a unit. Global energy needs can be met, with the use of different technologies, by solar heating and electricity generation plants, wind power plants, dams, and by generating energy from organic waste. In addition, in order to limit the increase in world energy demand, energy saving technologies should be used (Uyar 2008, p.16).
As we understand from all of this, renewable energy must be the future of energy. But this sector needs government support. According to the director of finance of Horizon, David Berry, the top five priorities for congress should be: passing a national renewable electricity standard that would have a large short-term impact on the industry; passing and implementing climate legislation; cleaning up the tax equity market; creating federal sitting authority for interstate transmission projects; and figuring out a national transmission market structure (American Council on Renewable Energy 2009, p.15).
So far, however, larger countries are more aware of their consumption, more sensitive to environmental damage, and more productive in working to fix the pollution they create. The United States of America have begun a new policy. President Obama has announced that with this policy, the objective is to reduce carbon emissions, conserve oil, and build the best green workforce in the world (American Council on Renewable Energy 2009, p.11).
The emergence of this new source has created new jobs. Wind energy has surpassed nuclear energy in creating new jobs. Nuclear energy requires a high amount of capital whereas renewable energy requires extensive human labor. In the case of Germany, in 2002, nearly 30,000 people were working in the nuclear energy sector but 84 300 people worked in wind energy in 2007. Despite the low share of overall total fossil plus renewable energy production, the total number of people working in the field of renewable energy in
31
2007 was around 249 300. The number of people working in the renewable energy sector is growing every day. If it continues to develop the way it has, it can provide jobs to millions of people around the world (Uyar 2008, p.17).
2.2.1. Solar Power
Solar power is a natural energy source which has been widely used throughout history, especially before the development of more sophisticated technology. Considerably varying methods depending on the level of technology and materials were applied. Current technology can be classified into two groups: Thermal Solar Technologies and Concentrating Solar Power (CSP). In these technologies, whereby solar energy is used to generate heat, heat can be used either directly or for generating electricity. With CSP power plants use different mirror positions to generate electricity by converting solar energy into high-temperature heat. Since they can be built at desired power ratings, they are typically used for powering signaling equipment, meeting rural electricity demand, etc. Solar Cells: Semiconductors which are also called photovoltaic cells transform sunlight directly into electricity. But these photovoltaic cells are very expensive (Energy Ministry of Turkey 2010).
The solar energy falling on the world every minute is higher than the entire world's annual energy consumption. However, the availability of this energy is not great. Applications of solar energy are very broad. Available applications of solar energy include: building heating with obtained electricity; water heating; swimming pool water heating; boiling and baking; fresh and salt water distillations; hot air engines and other thermodynamic heat cycle generation; greenhouse warming; drying of herbal products; day and night lighting;
performing photochemical and photosynthetic cycles (http://www.altenergy.org/renewables/solar.html 2010).
32
Figure 2.13: Solar pv capacity (2003-2008)
Source: Includes data from Btm Consult IEA, EPIA AND EUROBSERVER BP Statistical Review of world energy, June 2009
(http://www.usaee.org/usaee2009/submissions/prese ntations/Finley.pdf)
In figure 2.13 above, trends in investment distribution between countries in solar energy from 2003 to 2008, are presented. As of 2003, Japan has been the most active investor in solar energy. The importance of Germany’s progress is not difficult to see. We may say that Germany and Spain’s emphasis on solar power production is increasing. In the U.S.A, in 2003, the demand for solar energy was very little, however, there is an increase towards 2008 (Finley 2009).
Having a high potential for solar energy due to its geographical position, Turkey's average annual total sunshine duration is calculated at 2.640 hours (daily total is 7,2 hours), and average total radiation pressure at 1.311 kWh/m²-year (daily total is 3,6 kWh/m²). Solar energy potential is calculated at 380 billion kwh/year (Energy Ministry of Turkey 2010).
The average solar energy is the most intense in the Southeast region, then in the Mediterranean region, Aegean region, in Central Anatolia, Eastern Anatolia, the Marmara region; the most intense rainfall in the country being seen in the Black sea region, the least amount of solar energy can be produced there.