Electrochemical synthesis of polyaniline/inorganic salt binary
nanofiber thin films for electrochromic applications
Y. E. Firat1,2• A. Peksoz1
Received: 25 August 2016 / Accepted: 24 October 2016 / Published online: 31 October 2016 Ó Springer Science+Business Media New York 2016
Abstract Polyaniline conductive polymer thin films with-out or with LiClO4 inorganic salt were coated by electro-chemical deposition method on ITO surface. Electrochromic stability test, electrochemical behavior, coloring perfor-mance, optical properties and surface formations of the produced films were studied in detail. The deposited films were found to have a good stability. Electrochemical anal-ysis showed that the conductivity of LiClO4 doped PANI film was higher than that of the PANI. Oxidation and reduction peaks, and potentials differed significantly depending on the content of the electrolytes. SEM studies demonstrated that the surface of each film consisted of completely nanofibers. Addition of LiClO4to the deposition electrolyte decreased substantially the diameter of these nanofibers. PANI film with LiClO4 exhibited four colors, while pure PANI film had three different colors. The EDX results obtained from the surface of LiClO4 doped PANI material indicated that PANI and LiClO4 could be suc-cessfully linked to form PANI/LiClO4 binary thin film.
1 Introduction
Electrochromic windows (ECWs), also known as ‘‘smart windows’’ or ‘‘smart glass’’, are related to the reversible change in optical properties of a material induced by oxi-dation (loss of electrons) and reduction (gain of electrons)
due to externally applied potential difference in an ampli-tude of approximately 3 V DC.
Typical ECW consists of five layers of GS/TC/EC/IC/ IS/TC/GS, where GS is a glass substrate, TC is a trans-parent conductor, EC is an electrochromic coating, IC is an ion conductor and IS is an ion storage coating [1]. According to the applications, the GS/TC can be preferred as a transparent or reflective coating. In the transitive EC windows, many transparent electronic conductors (TC) can be used such as ITO (indium tin oxide), FTO (fluorine tin oxide) or ATO (antimony tin oxide). Among these con-ductors, ITO is suitable material in terms of optical and electrical properties. Electrochromic material layer is the most important part of ECW due to the changing of its color after being applied a potential. For the last decade, several inorganic electrochromic materials and organic electrochromic materials have been extensively studied [2,3]. Organic electrochromic material is more attractive compared with inorganic electrochromic materials due to the advantages in low costs, the short response time and the multiple color changes [4, 5]. Conducting polymer films have been widely used as organic electrochromic material. Among the conducting polymers, polyaniline (PANI) exhibits additional physical and chemical properties such as excellent environmental stability, easy deposition, sta-bility in aqueous solutions and relatively high level of electrical conductivity [6]. PANI has been used in several applications, such as biochemical sensors, rechargeable batteries, sensors, electrochromic windows, electromag-netic interference shielding and corrosion protection [5–7]. PANI has four redox states with different colors which are, yellow colored leucoemeraldine base (LB, fully reduced state), green colored emeraldine salt (ES, half oxidized state), blue colored emeraldine base (EB, half oxidized & A. Peksoz
1 Solar Cell Laboratory, Physics Department, Faculty of Arts and Sciences, Uludag University, Gorukle Campus, 16059 Bursa, Turkey
2 Physics Department, Kamil Ozdag Faculty of Sciences, Karamanoglu Mehmetbey University, Yunus Emre Campus, 70100 Karaman, Turkey
state) and finally, violet colored pemigraniline base (PB, fully oxidized state) [8].
PANI can be prepared by chemical or electrochemical process through oxidative polymerization of aniline monomer. The electrochemical polymerization is one of the most common methods in producing adherent and uniform thin polymer films. Thickness, conductivity and coloring quality of the films can be controlled by changing the synthesis parameters, including the current density, substrate, pH, nature and concentration of electrolyte [9]. These are the advantageous sides of electrochemical polymerization method.
Here, we report electrochemical deposition of PANI on ITO coated glass substrate in hydrochloric acid solutions with or without LiClO4inorganic salt. Considerably inno-vative information on the new produced PANI film char-acteristics depending upon inorganic salt is given to the literature by evaluating the results coming from our experiments and by comparing early works. To our knowledge, this is the first report to synthesize PANI/ lithium perchlorate salt binary thin films. This binary nanofiber thin film is expected to have a high conductivity and a good electrochemical activity.
2 Experimental
2.1 MaterialAniline (C6H5NH2, 99.5% purity), hydrochloric acid (HCl), sulfuric acid (H2SO4) and lithium perchlorate (LiClO4) were purchased from Sigma-Aldrich. All chemi-cals were used as received and pure water was used for all aqueous solutions. A transparent ITO coated glass was used as a substrate with a surface area of 1 cm 9 1 cm and a sheet resistance of 0–10 X/cm2. Prior to the deposition, the substrates were cleaned with acetone and then pure water using ultrasonic cleaner in order to remove any adsorbed substances on the electrode surface for a better adhesion of the films. Finally, the cleaned substrates were dried to be ready for the film deposition.
2.2 Syntheses of polyaniline/inorganic salt binary thin films
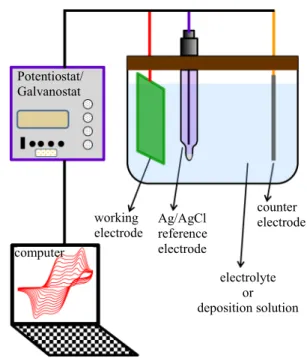
All electrochemical experiments were performed with a Gamry Reference 3000 Potentiostat/Galvanostat. A sche-matic illustration of the electrodeposition system was given in Fig.1. This deposition system has a conventional three-electrode configuration: ITO-coated glass as a working electrode, platinum wire as a counter electrode and Ag/ AgCl as a reference electrode. Cyclic voltammetry (CV)
was used to characterize the electrochemical behavior in aqueous solutions consisting of 0.25 M aniline and 0.5 M aqueous HCl (electrolyte I), and 0.25 M aniline, 0.1 M LiClO4and 0.5 M HCl (electrolyte II). This characteriza-tion provided the determinacharacteriza-tion of the polymerizacharacteriza-tion potentials of aniline on the ITO surface. The cyclic voltammetry was performed for the both electrolytes between potential limits of -0.4 and ?1.2 V at 100 mV /s scan rate for ten cycles. The PANI film was electrochem-ically deposited on ITO substrate in both electrolytes using chronoamperometry technique at a constant potential of ?0.9 V versus Ag/AgCl for 1200 s.
2.3 Measurements
Coloring performance and stability test of the produced films were performed with Gamry Reference 3000 Poten-tiostat/Galvanostat/ZRA. PHE200 Physical Electrochem-istry software was used to operate these tests by CV technique at the room temperature. Hall-effect measure-ment system with four-point probe was used to determine some electrical parameters of the films (HMS-3000 Manual Ver 3.5). Scanning electron microscope (SEM) micro-graphs were obtained by a Carl Zeiss EVO 40 system (Carl Zeiss NTS Limited Company, Cambridge, UK). The ele-mental analysis was performed in Bruker AXS Micro-analysis energy dispersive X-ray (EDX) Micro-analysis operated at 10 keV with XFlash 4010 detector. Ultraviolet–visible spectra (UV–Vis) were recorded with the Shimadzu UV-2600 spectrophotometer. Potentiostat/ Galvanostat counter electrode Ag/AgCl reference electrode working electrode electrolyte or deposition solution computer
Fig. 1 Schematic illustration of electrodeposition system used in this work
3 Results and discussion
3.1 Voltammetric studiesIt was reported before that the CV, which is one of the electropolymerization processes, had impact on morphol-ogy of the polymer, and provided the possibility of deter-mining the thickness and composition of the film on the substrate surface [10,11]. The determination of the growth potentials of PANI on the ITO surface was provided by CV between -0.4 and 1.2 V at a scan rate of 100 mV/s for ten cycles in electrolyte I (Fig.2). The increase in the redox and oxidation current intensity is an evidence of a suc-cessive growth of the PANI film, as the number of poly-merization cycles changes from one to ten. There are three anodic peaks at ?0.3, ?0.6 and ?0.9 V and two cathodic peaks at -0.178 and ?0.244 V indicating the presence of discrete electroactive regions in the film. The anodic peak potentials at ?0.3 and ?0.9 V correspond to the formation of leucoemeraldine form to the emeraldine form and emeraldine form to the pernigrenaline form, respectively. The middle peak at the ?0.6 V is unknown to our knowledge, but it may be attributed to the degradation or side product of the PANI.
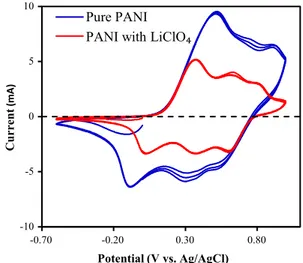
Addition of 0.1 M LiClO4 into the deposition bath changed the line shape of the CV. Figure3shows typical CV recorded between -0.6 and ?1.2 V at a scan rate of 100 mV/s for ten cycles in electrolyte II. The observed maximum current was 8.76 mA (positive direction) and -7.39 mA (negative direction) in electrolyte I, while it was 10.7 mA and -8.34 in electrolyte II (Figs.2, 3). So the current for electrolyte II is seen to be higher than that for the electrolyte I. This means that electrolyte II has more
-8 -6 -4 -2 0 2 4 6 8 10 -0.5 0.0 0.5 1.0 C urrent (mA ) Potential (V vs. Ag/AgCl)
Fig. 2 Cyclic voltammetry curves of pure PANI deposition on ITO substrate in a solution of 0.25 M aniline and 0.5 M aqueous HCl for ten cycles at 100 mV/s -10 -5 0 5 10 -0.7 -0.2 0.3 0.8 1.3 C urrent (mA ) Potential (V vs. Ag/AgCl)
Fig. 3 Cyclic voltammetry curves of PANI–LiClO4 deposition on ITO substrate in a solution of 0.25 M aniline and 0.5 M aqueous HCl and 0.1 M LiClO4for ten cycles at 100 mV/s
-3 -2 -1 0 1 2 3 4 5 0 200 400 600 800 1000 1200 Cur re nt (m A) Time (s) Pure PANI PANI with LiClO
Fig. 4 Potentiostatic current–time curves recorded on ITO electrode for PANI thin films deposited in the two different electrolytes
-10 -5 0 5 10 -0.70 -0.20 0.30 0.80 C urrent (mA) Potential (V vs. Ag/AgCl) Pure PANI
PANI with LiClO
Fig. 5 Electrochromic behavior of PANI without or with LiClO4in 0.1 M H2SO4
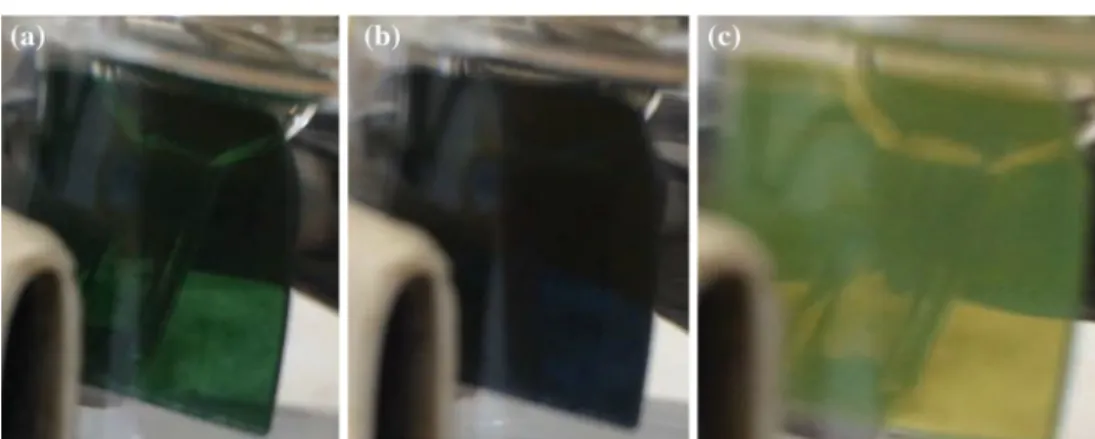
Fig. 6 Coloring of PANI film without LiClO4at a potential of a ?0.54 V, b ?0.88 V and c -0.6 V
Fig. 7 Coloring of PANI film with LiClO4at a potential of a-0.6 V, b ?0.40 V, c?0.60 V and d ?0.85 V
electrical conductivity. Thus, more aniline was polymer-ized on the ITO substrate with electrolyte II. It is not observed any changes on the number of peaks in the presence of LiClO4, despite of the fact that LiClO4causes the general shape of the voltammogram to be differed.
3.2 Film deposition
Figure4 shows time–current curves for the PANI by set-ting the working electrode potential to ?0.9 V for 1200 s
in both electrolytes I and II. For the electrolyte I, the curves corresponding to the electropolymerization of the PANI can be interpreted by separating in two stages. In the first stage, the deposition current increases with time, which means the nucleation of PANI. During the second stage, the current density increases less sharply than the first stage. This corresponds to the growth of PANI on the first layer. The time–current variation exhibited a decreasing in a short time, after then it increased linearly for the PANI deposited in electrolyte II (Fig.4).
0 20 40 60 80 100 300 400 500 600 700 800 900 T ransmittance (% ) λ(nm) +0.5V +0.9V -0.6V 0 1 2 3 300 400 500 600 700 800 900 A bsorbance λ(nm) +0.5V +0.9V - 0.6V (a) (b)
Fig. 8 aAbsorbance and btransmittance spectra of PANI thin films produced in the solution without LiClO4
0 1 2 3 300 400 500 600 700 800 900 A bsorbance λ(nm) +0.4V +0.6V +0.85V - 0.6V (a) 0 20 40 60 80 100 300 400 500 600 700 800 900 T ransmittance (% ) λ(nm) +0.4V +0.6V +0.85V -0.6V (b)
Fig. 9 aAbsorbance and btransmittance spectra of PANI thin films produced in the solution with LiClO4
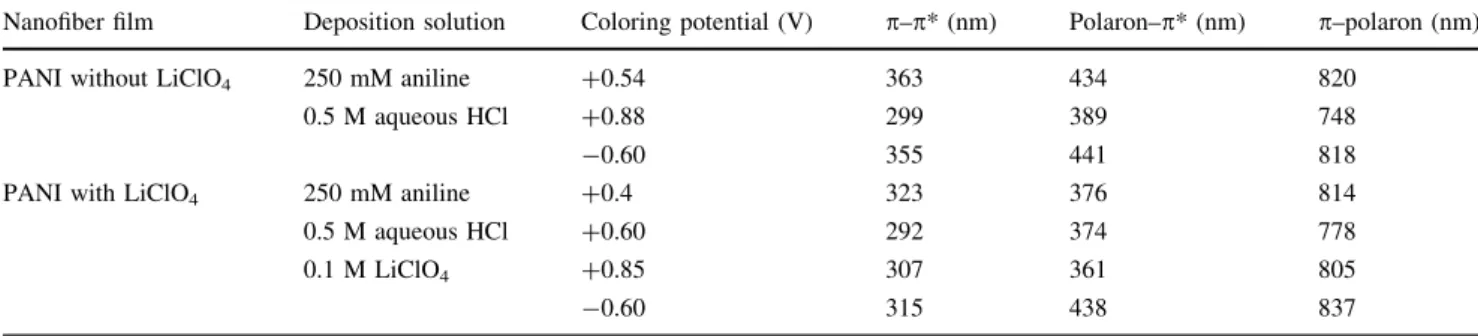
Table 1 Coloring potential values, wavelengths corresponding to absorbance peaks, transition types of the produced PANI nanofiber thin films Nanofiber film Deposition solution Coloring potential (V) p–p* (nm) Polaron–p* (nm) p–polaron (nm) PANI without LiClO4 250 mM aniline
0.5 M aqueous HCl
?0.54 363 434 820
?0.88 299 389 748
-0.60 355 441 818
PANI with LiClO4 250 mM aniline 0.5 M aqueous HCl 0.1 M LiClO4 ?0.4 323 376 814 ?0.60 292 374 778 ?0.85 307 361 805 -0.60 315 438 837
3.3 Electrochromic properties
CV was used to examine electrochemical behavior of PANI film in acidic medium. During adding and removing of H? ions into or from the film, PANI film gains a new redox state namely a new color. Figure5 shows the CV characteristics of both PANI films in an aqueous solution of 0.1 M H2SO4scanned between -0.6 and 1.0 V at a scan rate of 50 mV/s. As can be seen from Fig.5, there are two oxidation peaks correspond to the transformation of emeraldine salt (ES) from leucoemeraldine base (LB) at ?0.5 V and conversion of emeraldine salt (ES) to perni-graniline salt (PS) at ?0.9 V. On the negative direction, PS reduced back to ES at ?0.4 V and ES reduced back to LB at -0.1 V (Fig.5).
For the CV diagram of PANI film obtained in electrolyte II (Fig.5), there are three oxidation peaks in the positive scan at ?0.4, ?0.6 and ?0.85 V and three reduction peaks
-8 -6 -4 -2 0 2 4 6 8 10 -0.8 -0.3 0.2 0.7 1.2 C urrent (mA ) Potential (V vs. Ag/AgCl) 1 cycle 10 cycle 20 cycle
Fig. 10 Coloring stability curves of PANI without LiClO4at a scan rate of 50 mV/s -6 -4 -2 0 2 4 6 8 -0.8 -0.3 0.2 0.7 1.2 C urrent (mA ) Potential (V vs. Ag/AgCl) 1 cycle 10 cycle 20 cycle
Fig. 11 Coloring stability curves of PANI with LiClO4at a scan rate of 50 mV/s (a) (b) 195 nm 129 nm 216 nm 2 μm 86 nm
Mag = 15.00 KX Signal A =SE1 WD = 11.0 mm EHT = 20.00 kV
2 μm Mag = 15.00 KX Signal A =SE1 WD = 11.0 mm EHT = 20.00 kV
108 nm
WD = 11.0 mm EHT = 20.00 kV
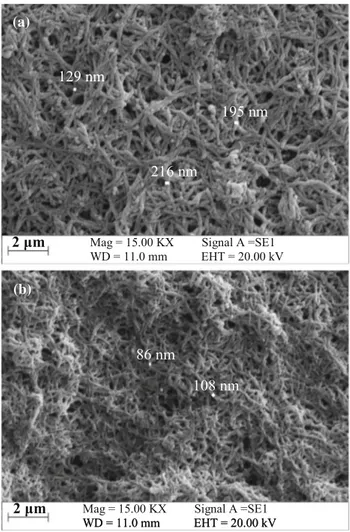
Fig. 12 SEM image of PANI film deposited from the electrolyte awithout LiClO4and b with LiClO4. The images were obtained in a magnification of 15,000 0 1 2 3 4 5 6 7 0.0 0.5 1.0 1.5 2.0 2.5 3.0 C ounts (cps/eV ) E(keV) Pure PANI PANI with LiClO
C
N
O
Cl
Cl
Fig. 13 EDX spectra of pure PANI and LiClO4 doped PANI thin films
in the negative scan at -0.04, ?0.35 and ?0.6 V, respectively. The oxidation peak at ?0.4 V and the reduction peak at -0.04 V represents the change between LB and ES with doping/dedoping of the anion processes. The oxidation peak at ?0.85 V and the reduction peak at ?0.6 V belongs to the change between EB and PS with protonation/deprotonation processes. The middle oxidation peak at ?0.6 V and reduction peak at ?0.35 V might be reversible transformation process of ES to EB [12,13].
3.4 Optical and stability tests
Coloring of PANI thin films produced in the medium without or with LiClO4 were imaged in Figs.6and7. The absorbance and transmittance spectra of the PANI films recorded during these coloring states were given in Figs.8 and 9. The absorption peaks of the deposited PANI thin films represented some shifts depending on the applied potentials due to the delocalization of the charge carrier. Figures8 and9 illustrate three maxima, the first localized between 300 and 363 nm, the second between 361 and 438 nm, and the third between 748 and 837 nm. The absorbance peaks, applied potential values in coloring, transition types of the PANI nanofiber films were sum-marized in Table1. The first peaks of the PANI films at the all applied potentials can be attributed to p–p* transitions [14, 15]. The second peaks are due to the polaron–p* transitions. The third wide peaks observed at higher wavelengths are assignable to the p–polaron transitions [15,16]. The stability performance of the produced films was also reported here (Figs.10, 11). First, tenth and twentieth cycle were illustrated for each polymer film, and the results showed that the produced PANI films exhibited a good stability in 1.0 M H2SO4after 20 cycles (Figs.10, 11).
3.5 SEM and EDX analysis
The SEM images of the both PANI thin film were given in Fig.12. Figure12a shows the surface formations of the PANI thin film deposited from electrolyte I. The film sur-face from electrolyte I has nanofibrous structures and many pores, and the diameter of the nanofibers is within the range of 125–220 nm. Diameter of the nanofibers on the
PANI film from electrolyte II is approximately 100 nm, and the film surface is more regular and less pores (Fig.12b). These observations demonstrated that nanofiber diameter was decreased with the presence of LiClO4in the deposition electrolyte (Fig. 12). The nanofibers can be attributed to the interaction of para-position of aniline with ITO surface [17].
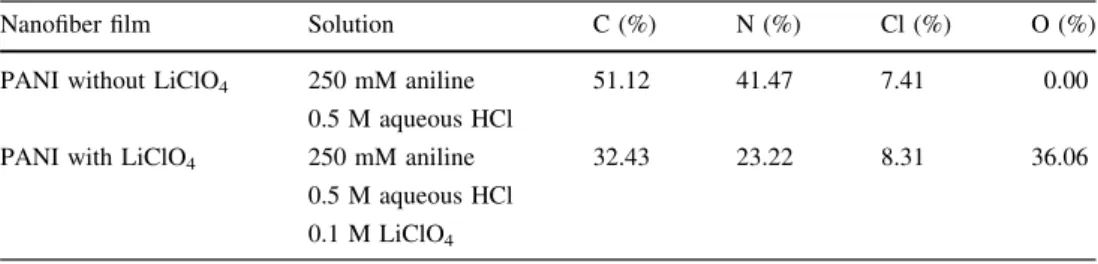
Figure13shows EDX spectra of pure PANI and LiClO4 doped PANI thin films. The signals of the carbon (C) and nitrogen (N) elements were observed at 0.28 and 0.39 keV for both pure PANI and LiClO4 doped PANI thin film, respectively. C and N peaks in EDX spectra confirm the occurrence of polymerization of aniline (Fig. 13). Oxygen (O) signal was not observed for pure PANI. As seen from Fig.13, the O signal observed at 0.51 keV demonstrates that PANI film was doped by perchlorate ions (ClO4-). The chlorine (Cl) peaks at 2.62 and 2.82 keV is due to the presence of HCl in electrolyte I and the presence of HCl and LiClO4in electrolyte II. The elemental compositions of the produced films were listed in Table2. Pure PANI film is composed of 51.12% C, 41.47% N, 7.41% Cl and 0.00% O, while LiClO4doped PANI film has 32.43% C, 23.22% N, 8.31% Cl and 36.06% O elemental compositions (Table2).
4 Conclusions
The PANI films were successfully electropolymerized on ITO substrates from two different electrolytes without or with LiClO4 inorganic salt. SEM studies showed each PANI film had nanofibers on their surfaces. The diameter of the nanofıbers is approximately 100 nm for the PANI films deposited from electrolyte II, while it is 200 nm for the film from electrolyte I. The PANI film without or with LiClO4was observed to have two or three oxidation peaks, respectively. UV–Vis absorbance and transmittance spectra of the PANI films were studied depending on the coloring potentials. Electrochemical CV analysis of the deposited PANI films demonstrated that the films had an excellent coloring reversibility and high stability in acidic solution.
Acknowledgements This work was supported by the Research Fund of the Uludag University, Project Number OUAP(F)-2013/11. The authors thank to Uludag University for financial support.
Table 2 EDX results of the produced PANI nanofiber thin films
Nanofiber film Solution C (%) N (%) Cl (%) O (%)
PANI without LiClO4 250 mM aniline 0.5 M aqueous HCl
51.12 41.47 7.41 0.00
PANI with LiClO4 250 mM aniline 0.5 M aqueous HCl 0.1 M LiClO4
References
1. Y. Ji, C. Qin, H. Niu, L. Sun, Z. Jin, X. Bai, Dyes Pigments 117, 72 (2015)
2. N. Velhal, N. Patil, S. Jamdade, V. Puri, Appl. Surf. Sci. 307, 129 (2014)
3. V. Meriga, S. Valligatla, S. Sundaresan, C. Cahill, V.R. Dhanak, A.K. Chakraborty, J. Appl. Polym. Sci. 42766, 1 (2015) 4. G. Sun, X. Zhang, J. Rappich, K. Hinrichs, Appl. Surf. Sci. 344,
181 (2015)
5. R.B. Patil, A.A. Jatratkar, R.S. Devan, Y.R. Ma, R.K. Puri, V. Puri, J.B. Yadav, Appl. Surf. Sci. 327, 201 (2015)
6. Y. Li, Z. Li, F. Zheng, J. Appl. Polym. Sci. 42785, 1 (2015) 7. E.A. O¨ zerol, B.F. S¸enkal, M. Okutan, Microelectron. Eng. 146,
76 (2015)
8. L. Zhao, L. Zhao, Y. Xu, T. Qiu, L. Zhi, G. Shi, Electrochim. Acta 55, 491 (2009)
9. M. Hatamzadeh, R.M. Rezaei, M. Jaymand, Mater. Sci. Semi-cond. Process. 31, 463 (2015)
10. L. Niu, Q. Li, F. Wei, S. Wu, P. Liu, X. Cao, J. Electroanal. Chem. 578, 331 (2005)
11. A. Mourato, A.S. Viana, J.P. Correia, H. Siegenthaler, L.M. Abrantes, Electrochim. Acta 49, 2249 (2004)
12. W.K. Chen, C.W. Hu, C.Y. Hsu, K.C. Ho, Electrochim. Acta 54, 4408 (2009)
13. T.H. Lin, K.C. Ho, Sol. Energy Mater. Sol. Cells 90, 506 (2006) 14. Q. Wang, X. Qian, S. Wang, W. Zhou, H. Guo, X. Wu, J. Li, X.
Wang, Synth. Met. 199, 1 (2015)
15. M. Das, D. Sarkar, J. Mater. Sci. Mater. Electron. 27, 4109 (2016) 16. S. Pruneanu, E. Veress, I. Marian, L. Oniciu, J. Mater. Sci. 34,
2733 (1999)
17. H. Zhang, J. Wang, Z. Wang, F. Zhang, S. Wang, Synth. Met. 159, 277 (2009)