Real-Time and Selective Detection of Single Nucleotide DNA
Mutations Using Surface Engineered Microtoroids
Pelin Toren,
†,§Erol Ozgur,
†,§and Mehmet Bayindir
*
,†,§,‡†Institute of Materials Science and Nanotechnology, Bilkent University, 06800 Ankara, Turkey §UNAM-National Nanotechnology Research Center, Bilkent University, 06800 Ankara, Turkey ‡Department of Physics, Bilkent University, 06800 Ankara, Turkey
*
S Supporting InformationABSTRACT: Mictoroids, as optical biosensors, can provide beneficial biosensing platforms to understand DNA alterations. These alterations could have significant clinical importance, such as the case of Pseudomonas aeruginosa, which is a commonly found pathogen in Cystic Fibrosis (CF) patientscausing poor prognosis by undergoing mutations during disease steps, gaining virulence and drug resistance. To provide a preliminary diagnosis platform for early-stage bacterial mutations, biosensing with a selective microtoroid surface was suggested. For this purpose, microtoroids with high quality factors were fabricated. The microtoroid surfaces were coated with (3-aminopropyl)
triethox-ysilane (APTES)/trimethylmethoxtriethox-ysilane (TMMS) mixed silane solution followed by EDC/NHS chemistry for covalent conjugation of DNA probes. Ethanolamine capping was applied to avoid unspecific interactions. The confocal studies confirmed homogeneous functionalization of the microtoroid surface. The DNA hybridization was demonstrated to be affected from the probe length. The optical biosensors showed a significant response (∼22 pm) to the complementary strand of the mutated type P. aeruginosa DNA, while showing substantially low and late response (∼5 pm) to the point mismatch strand. The limit of detection (LOD) for the complementary strand was calculated as 2.32 nM. No significant response was obtained for the noncomplementary strand. The results showed the microtoroids possessed selective surfaces in terms of distinguishing DNA alterations.
G
enetic information is the most essential characteristic of life and possibly the mere reason for our existence.1 As we develop a profound understanding of the genomic material, we increase our chance of apprehending, and moreover treating the physiological and pathological phenomena related to DNA and DNA alterations (i.e., mutations). Biosensor platforms, built to investigate DNA, and particularly DNA mutations have a significant role within this context. Therefore, a tremendous effort has been spent to develop biosensing systems, especially label-free sensors, for DNA studies.2−4 Because label-free sensing systems using optical resonators have significant advantages such as high sensitivity,5 on-chip sensing,6 and real-time monitoring down to a single molecule,7they still offer the most promising solutions for the biosensing applications. There are several noteworthy examples regarding detection and characterization of single DNA strands with high sensitivity, accuracy, and efficiency.5,8Target single stranded DNA (ss-DNA) detection via an optical biosensor possessing a selective surface is crucial. Surface density of the probe,9−12 surface diverseness,12 nonspecific interactions,12 probe/target length,13 and ionic strength of the hybridization buffer14 can affect the yield of hybridization on the surface and kinetics of target capture. Likewise, tethered ss-DNA conformation15and configuration13 plays a vital role in the hybridization process. Providing
configurational freedom to the surface-bound probes by reducing steric hindrance can enhance the efficiency of duplex formation on the surface.13Spacer molecules can reduce steric effects by locating the ss-DNA probes away from each other.12,16Thus far, spacer molecules in several studies10,17−19 have been used to increase the hybridization yield.
Recently, we demonstrated label-free detection of antigen interleukin 2 in complex media using a microtoroid having selective surface, as an optical microresonator.20Our approach in this work is the real-time detection of single base pair variation in target ss-DNA using an analogous selective microtoroid surface. The biosensing platform is schematically illustrated inFigure 1a. Optical measurements were taken in a microaquarium by evanescently coupling a microtoroid to a tapered optical fiber. To increase selectivity by reducing nonspecific interactions, first, the microtoroid surface was coated with mixed silane molecules. As shown in Figure 1b, trimethylmethoxysilane (TMMS) molecules served as spacers,21 and covalent conjugation of the ss-DNA probes was achieved by applying EDC/NHS chemistry to the surface bound (3-aminopropyl) triethoxysilane (APTES) molecules. Received: July 16, 2015
Accepted: October 12, 2015 Published: October 12, 2015
After covalently conjugating amino modified ss-DNA strands to the formed NHS-esters, residual NHS-esters were capped with ethanolamine molecules to prevent nonspecific target-surface interactions.
In the present study, we selectively detected point mismatches occurring in bacteria Pseudomonas aeruginosa in the Cystic Fibrosis (CF) environment.22These mutations cause virulence that seriously obstructs the eradication of bacterial infection in CF patients and eventually leads to a poor prognosis.23Thus, early-stage and selective detection of these mutations are critical for a profound treatment planning. Accordingly, ss-DNA probes and their complementary ss-DNA strands were designed on the basis of a previously published study related to the mutations occurring gradually within P. aeruginosa in CF environment.24
■
EXPERIMENTAL SECTIONMaterials. Silica wafers (2 μm thermal oxide on silicon) were purchased from University wafers (South Boston, U.S.A.). Hellmanex III was purchased from Hellma-Analytics (Mu ̈ll-heim, Germany). Acetone (analytical reagent grade), acetic acid (ACS grade), (3-aminopropyl) triethoxysilane (APTES, 99%), trimethoxymethylsilane (TMMS, GC grade), succinic anhy-dride (GC grade), N−N9′-dicyclohexylcarbodiimide (DCC, 99%), triethylamine (BioUltra grade), ethanolamine (ACS grade), Tris (hydroxymethyl) aminomethane hydrochloride (Tris-HCl, BioPerformance grade), sodium hydroxide (NaOH, reagent grade), and potassium phosphate monobasic (KH2PO4, molecular biology grade) were purchased from Sigma-Aldrich (St. Louis, U.S.A.). Ethanol (analytical reagent grade), sodium chloride (NaCl, molecular biology grade) and N-Hydroxysuc-cinimide (NHS, HPLC grade) were purchased from Merck (Darmstadt, Germany). N,N-Dimethylformamide (DMF, ana-lytical reagent grade) was purchased from Fluka (Steinheim, Germany). All amino-modified, Cy5/Cy3-labeled, and label-free single stranded DNA (ss-DNA) sequences were synthe-sized with high purity by Sentegen (Ankara, Turkey).
Nuclease-free water (molecular biology grade, Fisher Scientific, UK) was used during the whole study.
Fiber Tapering and Microtoroid Fabrication. Tapering of a single-mode silica fiber (1460−1620 nm, Ø125 μm cladding) was performed using a hydrogen torch. The tapering process at constant pulling speed (0.10 mm/s), with two linear stages moving in opposite direction, was controlled with a custom-made software and monitored simultaneously using a CCD camera. A tapered silicafiber with high transmission was obtained via this process (Figure S1). As we described previously,20 microdisks standing on silicon pillars were fabricated via sequential photolithography, wet etch, andfinally dry etch using isotropic SF6plasma etching in an inductively coupled plasma device (SPTS, U.S.A.). Microtoroids with ∼100−120 μm in dia were fabricated by reflowing the microdisks with a CO2 laser (Diamond C-55A, Coherent Inc., U.S.A.), focused using a ZnSe lens.
Experimental Setup. The biosensing platform was inserted on a closed-loop piezo-stage providing motion with 5 nm resolution in x-y-z axes (NanoMax-TS, Thorlabs, U.S.A.), controlled by a piezo controller. Coupling of microtoroid to the taperedfiber was monitored by two individual CCD cameras: from side and top. 1550 nm tunable laser (TSL-510, Santec, Japan) was used as the light source. While continuously tuning the laser wavelength, the intensity of the output laser light was continuously traced by a powermeter. The output laser wavelength and transmitted power values were captured using an oscilloscope. The resonance wavelength was tracked frame-by-frame using custom-made software. Each frame was recorded with 2 s sweep delay to reduce the hysteresis of the laser. The experimental setup was schematically described in
Figure S2.
Optical Measurements. The biosensing measurements were performed in a 200 μL hybridization buffer as micro-aquarium at room temperature (RT). With a constantflow rate (100μL/min), infusion and withdrawal of target ss-DNA were simultaneously done using two individual syringe pumps (New Era Pump Systems Inc., U.S.A.). Each infused analyte ss-DNA
Figure 1.(a) Schematic illustration of the biosensing platform consisting of a (1) microaquarium, (2) a probe conjugated microtoroid, and (3) a taperedfiber used to couple light to the microtoroid. (b) Chemical modification of the microtoroid surfaces: (1) APTES/TMMS coating of UV/ Ozone pretreated surfaces, (2) Succinic anhydride incubation in DMF for 4 h, (3) EDC/NHS incubation in DMF for 2 h, (4) Covalent probe ss-DNA conjugation in 1 M KH2PO4at 37°C overnight, and (5) ethanolamine capping to remove residual NHS-esters.
concentration was 200 nM. To avoid any Whispering-Gallery-Mode (WGM) shift due to refractive index change, micro-aquarium and infusion solutions were prepared using the same buffer. After coupling the tapered fiber to the microtoroid, the fiber was fixed to the biosensing stage from both sides using epoxy droplets cured by UV-light (ELC-410, Thorlabs, U.S.A.). Therefore, undesired displacement of the taperedfiber during the optical measurements was avoided. Each experiment was repeated at least three times and each microtoroid was used only once.
Data Analysis. First, the wavelength values corresponding to the minima of the power measurements was found byfitting the raw data to a four-variable Lorentz function. Then, a medianfilter was applied by calculating the median of each data point within a neighborhood of 15 (7 left/right neighbors) for noise reduction. Afterward, our data was presented by calculating the mean values of each three data points and representing those with the single mean value± its standard deviation. Finally, the first wavelength value was subtracted from each data point, to track the shift clearly. The limit of detection (LOD) was calculated according to the method25 described previously.
Cleaning the Microtoroid Surface. The microtoroid surface was cleaned with mild Hellmanex III solution, water, ethanol, acetone and water, each for 5 min, respectively. To induce silanol groups, the cleaned microtoroids were treated with a UV/Ozone cleaning system (PSD-UV, Novascan Technologies, U.S.A.) for 30 min at RT.
Silanization of the Microtoroid Surface. APTES (14 mM) and TMMS (46 mM) mixed organosilane in ethanol solution containing 5% (v/v) water (at pH 4.67 adjusted with acetic acid) was stirred on a lab shaker for 15 min at RT. The UV/Ozone treated microtoroids were immediately inserted into a beaker containing the organosilane solution. The deposition was allowed for 1 h at RT. To remove residual nondeposited organosilanes, the microtoroids were washed several times with the ethanol solution and cured in vacuum for 1 h at 110°C.
Forming Reactive NHS-Esters on the Microtoroid Surface. A previously described method26 was utilized for carboxylate group formation on the microtoroid surfaces. To induce carboxylate groups, the coated microtoroids were incubated in nearly saturated succinic anhydride in DMF (containing 1 mg/mL triethylamine) for 4 h at RT. The microtoroids were then washed with DMF and left in DDC/ NHS solution (1:1 M in DMF) for 2 h on a lab shaker at RT. Then, the microtoroids were washed with DMF and 1 M KH2PO4in water (pH 4.5), respectively.
Covalent ss-DNA Conjugation to the Microtoroid Surface. The microtoroids were incubated in 200 nM amino-modified ss-DNA in the 1 M KH2PO4 solution (pH 4.5) at 37 °C, overnight, then, washed thoroughly with the KH2PO4 solution to remove unbound ss-DNA molecules. To cap any residual NHS-esters, the microtoroids were incubated in 1 M KH2PO4solution containing 1% (v/v) ethanolamine for 2 h and washed several times with the KH2PO4solution.
DNA Hybridization Studies. As hybridization buffer, 10 mM Tris-HCl/NaCl buffer (pH 7.0 adjusted by NaOH) was prepared andfiltered with 0.2 μm pore size sterile syringe filter before any use. The stock target ss-DNA solutions were prepared as 200 nM.
■
RESULTS AND DISCUSSIONOptical Characterization of Microtoroids. A scanning electron microscope (SEM) image of a fabricated microtoroid is shown in Figure 2a. Quality factors (Q) of the fabricated
mictoroids were measured both in the air and hybridization buffer. After Lorentzian fitting (red curves) of the WGM modes (blue curves), the line widths were obtained and the relevant Q factors were calculated by the approximation Q ≈ λ/Δλ.27 Obtained Q values in the air and hybridization buffer were calculated as 3.1× 10⁷(Figure 2b) and 4.6× 10⁴(Figure 2c), respectively. Due to water absorption at 1550 nm,28broadening of the line width was observed, resulting in a decrease in the Q factor.
Surface Characterization of Microtoroids. To verify our surface approach, atomic force microscopy (AFM), X-ray photoelectron spectroscopy (XPS), and confocal microscopy studies were performed on microtoroids (detailed information is provided in Supporting Information). Root-mean-square
Figure 2.(a) SEM image of a fabricated microtoroid. The Lorentzian fits (red curves) of WGMs (blue curves) are plotted versus transmitted optical powers (μW). The Q factors were calculated as (b) 3.1 × 10⁷in
air and (c) 4.6× 10⁴in 10 mM Tris-HCl/NaCl (pH 7.0) buffer. The
measurements were performed with an ss-DNA conjugated microtoroid using a 1550 nm tunable laser.
roughness (Rq) of a bare microtoroid surface was calculated as 1.25 ± 0.08 nm (Figure S3). Rq values for APTES/TMMS coated (Figure S4) and 13-mer ss-DNA conjugated (Figure S5) microtoroid surfaces were calculated as 3.92 ± 0.21 nm and 3.11 ± 0.72 nm, respectively. The noncontact AFM scans showed a change in the microtoroid surface morphology at the end of each step.
Si 2p high-resolution XPS scan of a UV/Ozone-treated microtoroid showed two characteristic peaks29located at 102.8 and 98.8 eV arising from SiO2 and Si environments, respectively (Figure S6). Similarly, the O 1s region scan showed one main peak at 532.3 eV arising from Si−O−H30 bonding. Additionally, no C 1s signal was detected due to the removal of organic contaminants after the UV/Ozone treat-ment. The C 1s scan of an APTES/TMMS coated microtoroid showed three peaks located at 286, 285, and 284 eV verifying C−N,31 C−C32 and C−H,32 and C−Si33
bondings, respec-tively, due to covalent bonding of APTES/TMMS molecules (Figure S7). Also, the O 1s peak located at 530.5 eV34and the increase in intensity of the higher energy Si 2p peak after coating, verifies the Si−O bonding.35 N 1s scan showed two peaks at 401.6 and 399.2 eV arising from protonated amine (−NH3+) and free amine (−NH2) groups36,32due to covalent conjugation of APTES molecules, respectively. After applying EDC/NHS chemistry, the N 1s region peaks shifted to 402.5 and 399.8 eV verifying the N−O and N−C bondings, respectively, due to NHS-ester termination37(Figure S8).
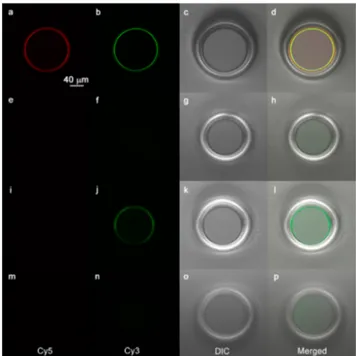
Quality Assessment of the Microtoroid Surface Modification. For the confocal microscopy studies (Figure 3), three different microtoroid samples were prepared to verify the suggested surface chemistry: probe ss-DNA (5′-NH2 TTGGAACATTC Cy5 3′) conjugated (Figure 3a−d), control ss-DNA (5′-NH2 TCAAGTCGGCCAA 3′) conjugated/ capped (Figure 3e−h), and control ss-DNA conjugated/ uncapped (Figure 3i−l). All microtoroids were incubated in the hybridization buffer containing 200 nM target ss-DNA (5′ Cy3 GAATGTTCCAA 3′) at RT for 3 h. Following incubation, the microtoroid surfaces were washed once with the buffer to remove unbound ss-DNA molecules. Also, control ss-DNA conjugated/capped microtoroid surface (Figure 3m−p) was imaged individually to observe the background fluorescence.
Figure 3a shows a homogeneous distribution of covalently attached probe ss-DNA, mostly located on the microtoroidal region. Similarly, a homogeneous distribution with signal of the same order was obtained from captured ss-DNA (Figure 3b) verifying the hybridization (Figure 3d). To our knowledge, this level of homogeneity in microtoroid biofunctionalization, enabling effective target detection from overall surface, was not demonstrated previously. As it can also be clearly seen from
Figure 3f that the capped microtoroid surface showed a significant reduction in nonspecific ss-DNA adsorption while the uncapped surface showed three times higher Cy3 signal arising from heterogeneously adsorbed target ss-DNA (Figure 3j). The obtained Cy3 signal from the capped surface (Figure 3f) was of the same order with the background signal obtained from the control sample (Figure 3n).
Surface Density of Bound-Probe and Captured Target DNA Strands. To estimate the surface densities, we applied a fluorescence-based technique which was reported previously.38 The applied method is described in detail and standard calibration curves (Figure S10 and Figure S11) are given in
Supporting Information. After overnight incubations, the surface densities of bound-probe and captured target DNA
strands were estimated as 5.5× 10¹⁰probe molecules/cm2and 4.6 × 10¹⁰ target molecules/cm2, respectively. The results showed a 0.84 surface coverage ratio of captured targets to the attached probes.
Effect of DNA Strand Length on Hybridization. To interpret the WGM shift dynamics with respect to various probe/target lengths, three different probe-target pairs were used: 11-mer (5′-NH2 TTGGAGCATTC 3′ and 5′ GAATGCTCCAA 3′), 13-mer (5′-NH2 TCAAGTCGGCCAA 3′ and 5′ TTGGCCGACTTGA 3′), and 15-mer (5′-NH2
TGCCGCTGCACATGG 3′ and 5′ CCATGTGCAGCGGCA
3′) strands. Subsequent to infusion of the complementary strands for each probe individually, we observed WGM shift responses for 11-mer (red), 13-mer (blue), and 15-mer (green) strands as around 30, 19, and 6 pm, respectively (Figure 4). The hybridization buffer baseline (gray) is also shown. The standard deviations tended to increase drastically in the regions where a sudden increase or decrease of the WGM shift was observed. This was expected, because the difference between neighboring data in those regions change very rapidly, which is naturally accompanied by the large standard deviations shown inFigure 4.
According to our results, the WGM shift tends to increase with decreasing probe/target length, as shown inFigure 4. As described formerly, target binding kinetics to the surface attached probes depends on many factors such as DNA strand sequence,39probe/target length,40 the rate of target diffusion from bulk,41 surface coverage of the attached probes,42 reachability of nucleation sites, and even complementary
Figure 3. Confocal and differential interference contrast (DIC) microscopy images of the (a−d) probe ss-DNA (Cy5 labeled) conjugated, (e−h) control ss-DNA conjugated/capped, (i−l) control ss-DNA conjugated/uncapped microtoroids incubated in 10 mM Tris-HCl/NaCl (pH 7.0) buffer containing 200 nM target ss-DNA (Cy3 labeled) at RT for 3 h. (m−p) Control ss-DNA conjugated/capped microtoroid was imaged in terms of obtaining background fluorescence. Cy5, Cy3, DIC, and merged channels were given, respectively (from left to right for each row). For Cy5, Cy3, DIC, and merged channels, the images were collected separately. Relative fluorescence intensities for each channel are given inFigure S9.
segment location (complementary to upper or nucleation site-near portion of the probe).12
Hinckley et al.39reported theoretically that short (<30 mer), heteregenous DNA sequences did not show consistent trends in terms of hybridization binding rate constants, and the rate constant slightly decreased as the base number increased from 10-mer to 15-mer. Also, it had been observed in another study43that increased length decreased the hybridization rate. The observed relationship between the length and the WGM shift for the DNA pairs varying from 11-mer to 15-mer, suggests an unpredicted behavior and agrees with the aforementioned study.39
Although the fact that it is challenging to interpret the data when all the factors considered together, we believe that, the increased pair length can lead to slow target binding kinetics on the biosensor surface by allowing relatively slower target penetration40 and decrease the number of stable DNA duplexes, thus causing smaller WGM shifts. Another possible effect that can reduce the overall target-probe binding ratio, which is already smaller than unity (0.84) for 11-mer DNA pair, is the repulsive forces between the negatively charged surface and the target ss-DNA. The longer the strand, the larger this repulsive electrostatic force becomes, because the total negative charge of the DNA increase accordingly, which might contribute to the observed effect.
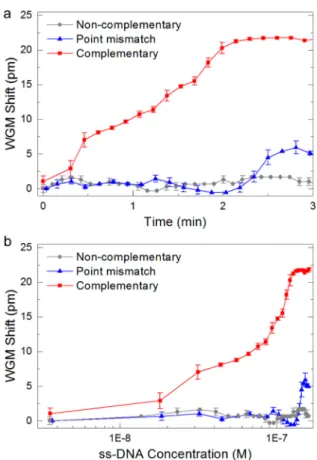
Real-Time and Selective Detection of Single Nucleo-tide Mutations in DNA Strands. To investigate the biosensor response to its complementary, noncomplementary, and point mismatch strands, ss-DNA probes (5′-NH2 TCAAGTTGGCCAA3′) were conjugated to the microtoroid surfaces. These ss-DNA probes contain a point mutation occurring at early stage mutagenesis of P. aeruginosa in CF environment.Figure 5a shows temporal response of the probe conjugated microtoroid surface to its complementary (5′ TTGGCCAACTTGA 3′), noncomplementary (5′ AGC-CAGCCCGGTC 3′), and point mismatch strands (5′ TTGGCCGACTTGA 3′, complementary strand of the wild type sequence). Figure 5b shows the biosensor response in terms of ss-DNA concentration (M).
The ss-DNA concentration inside the microaquarium can be expressed as20
= − − ̇
C t( ) Co(1 e Q t V/ )
where t is time (min), C is the ss-DNA concentration (mol/ mm3) inside the microaquarium, and C0is the infused ss-DNA concentration (mol/mm3). Q̇ is the volumetricflow rate (mm3/ min) and V is the volume (mm3) of the microaquarium.
It can be seen from Figure 5a,b that due to the DNA hybridization on the microtoroid surface, a significant WGM shift (∼22 pm) was observed (Figure 5, red), whereas the biosensor showed no response to the noncomplementary strand (Figure 5, gray). The amount of the shift (∼22 pm) is comparable to the shift of its wild-type counterpart which has same strand length (Figure 4, blue). The WGM shift occurring during the DNA hybridization made a plateau at around 133 nM due to the saturation of biosensor surface with the target strands (Figure 5b, red). Additionally, a considerably low WGM shift (∼5 pm) was observed as a result of the point mismatch strand infusion (Figure 5, blue); yet, the same strand caused a WGM shift of∼19 pm with its complementary strand (Figure 4, blue). This demonstrates the feasibility of our microtoroid-based biosensor in specific detection of point mutations. The dramatic difference between the WGM shift magnitudes for the biosensor responses to the complementary and point mismatch strands is most probably caused by two main reasons: electrostatic surface repulsion and altered DNA hybridization kinetics. The repulsive interactions occurring on the surface44,45 are exerted by the ss-DNA probes and are further enhanced by negatively charged spacer molecules. It is also necessary here to mention that the presence of a base pair mismatch affects the DNA hybridization kinetics by altering
Figure 4. WGM shift (pm) of different probe-target pairs: 11-mer (red), 13-mer (blue), and 15-mer (green) strands as well as the hybridization buffer (10 mM Tris-HCl/NaCl, pH 7.0) baseline (gray) versus time (min). Infusions were started at t = 0.
Figure 5. (a) WGM shift (pm) of complementary (red), non-complementary (gray), and point mismatch (blue) strands versus time (min). (b) The biosensor response in terms of ss-DNA concentration (M) within the microaquarium. Infusions were started at t = 0.
thermodynamic stability of the formed DNA duplexes46on the microtoroid surface, which yields a significant contribution to a substantially late and low response in terms of the WGM shift. The LOD for the complementary ss-DNA concentration was calculated as 2.32 nM (Figure 5b, red). This value is comparable to a previous report regarding DNA sensing using optical microresonators.8It is important to note that, in our experimental setup, the limiting factor of our sensitivity is the wavelength of our tunable laser. If a visible laser operating at around 670 nm was used instead, the sensitivity could be expected to increase a few orders of magnitude, because the absorption in water would be considerably lower at that wavelength.28
The most significant result obtained in this experiment is the selective detection of the point mutations thanks to the engineered microtoroid surface. The TMMS molecules were previously shown to form a negatively charged surface on silica nanoparticles,47which is also expected to occur for the silica microtoroid surface in a similar fashion. It is important to note here that although APTES has a positive charge, after ethanolamine capping following EDC/NHS chemistry, its charge is expected to be negative as well. Considering the fact that DNA has a negative charge overall, the repulsive electrostatic forces (due to bound TMMS molecules on the microtoroid surface and hydroxyl groups formed after ethanol-amine capping) seem to be the main reason for the selectivity, whereas fully complementary strands can probably overcome this effect. Although selectivity could be attained using two optical microcavities simultaneously,8it is more convenient to utilize a single microtoroid in terms of reducing experimental complexity, which was demonstrated in this study.
The surface approach that we suggest could also have potential to be utilized in measurements within complex media, such as serum and sputum, because negatively charged surfaces are well-known to possess a substantial protein resistance; yet, investigating this property is subject of a further research.
■
CONCLUSIONSThe optical microcavities have important potentials in terms of label-free biosensing, which have not been fully realized yet. One of the most important features of optical label-free biosensors is their surface engineering. It is critical to have an optimized surface with an appropriate probe orientation/ configuration and surface coverage, especially in DNA sensing, in order to perform a reliable measurement. Also, one should consider the electrostatic forces, which can affect the DNA hybridization kinetics seriously. An optimized surface would lead to a wide spectrum of applications of optical biosensors, which is not limited to the optical microcavities with high quality factors.
In this study, we developed a microtoroid surface composed of a mixture of two different silane molecules: APTES (for covalent conjugation of the probe ss-DNA) and TMMS (as spacer moiety). The conjugation of the Cy 5-labeled probe ss-DNA and the ss-DNA hybridization were observed to be homogeneous. The DNA hybridization kinetics regarding the probe/target length and its effect on the biosensing in terms of the WGM shift was demonstrated. Also, the ss-DNA strands related to point mutations occurring within P. aeruginosa genome in CF environment were successfully and selectively detected.
The strategy for chemical modification of the optical microcavities proposed here could pave the way for accurate
detection of DNA alterations. This could be highly crucial in clinical practice, for instance, in the infections of CF patients, where it is vital to plan the treatment without stimulating the pathogens to mutate further and eventually become absolutely drug resistant.
■
ASSOCIATED CONTENT*
S Supporting InformationThe Supporting Information is available free of charge on the
ACS Publications website at DOI: 10.1021/acs.anal-chem.5b02664.
Additional information on the optical biosensing setup as well as information on AFM, XPS, confocal microscopy, and standard calibration curves to determine the surface densities (PDF)
■
AUTHOR INFORMATIONCorresponding Author
*E-mail:[email protected]. Phone: 0090-312-290-3500. Notes
The authors declare no competingfinancial interest.
■
ACKNOWLEDGMENTSWe would like to thank Ege Ozgun for valuable discussions on the manuscript, Ersin Huseyinoglu for technical help during SolidWorks drawing, Pinar Beyazkilic, Ebru Sahin Kehribar for helping during experiments, and Ozan Aktas for critically reading the manuscript. We also thank Bulend Ortac for supplying the UV spot curing system. This study was supported by the Scientific and Technological Research Council of Turkey (TUBITAK) grant (112T612).
■
REFERENCES(1) Dawkins, R. The selfish gene, 1st ed.; Oxford University Press: Oxford, 1976.
(2) Hawk, R. M.; Armani, A. M. Biosens. Bioelectron. 2015, 65, 198− 203.
(3) Azam, M. S.; Gibbs-Davis, J. M. Anal. Chem. 2013, 85, 8031− 8038.
(4) Vollmer, F.; Arnold, S.; Keng, D. Proc. Natl. Acad. Sci. U. S. A. 2008, 105, 20701−20704.
(5) Baaske, M.; Foreman, M.; Vollmer, F. Nat. Nanotechnol. 2014, 9, 933−939.
(6) Washburn, A.; Gunn, L.; Bailey, R. Anal. Chem. 2009, 81, 9499− 9506.
(7) Armani, A. M.; Kulkarni, R. P.; Fraser, S. E.; Flagan, R. C.; Vahala, K. J. Science 2007, 317, 783−787.
(8) Vollmer, F.; Arnold, S.; Braun, D.; Teraoka, I.; Libchaber, A. Biophys. J. 2003, 85, 1974−1979.
(9) Guo, Z.; Guilfoyle, R.; Thiel, A.; Wang, R.; Smith, L. Nucleic Acids Res. 1994, 22, 5456−5465.
(10) Herne, T.; Tarlov, M. J. Am. Chem. Soc. 1997, 119, 8916−8920. (11) Peterson, A.; Heaton, R.; Georgiadis, R. Nucleic Acids Res. 2001, 29, 5163−5168.
(12) Peterson, A.; Wolf, L.; Georgiadis, R. J. Am. Chem. Soc. 2002, 124, 14601−14607.
(13) Wong, E.; Chow, E.; Gooding, J. Langmuir 2005, 21, 6957− 6965.
(14) Park, H.; Germini, A.; Sforza, S.; Corradini, R.; Marchelli, R.; Knoll, W. Biointerphases 2007, 2, 80−88.
(15) Moiseev, L.; Unlu, M.; Swan, A.; Goldberg, B.; Cantor, C. Proc. Natl. Acad. Sci. U. S. A. 2006, 103, 2623−2628.
(16) Shchepinov, M.; CaseGreen, S.; Southern, E. Nucleic Acids Res. 1997, 25, 1155−1161.
(17) Halperin, A.; Buhot, A.; Zhulina, E. Langmuir 2006, 22, 11290− 11304.
(18) Cho, Y.; Kim, S.; Lim, G.; Granick, S. Langmuir 2001, 17, 7732−7734.
(19) Schreiner, S.; Shudy, D.; Hatch, A.; Opdahl, A.; Whitman, L.; Petrovykh, D. Anal. Chem. 2010, 82, 2803−2810.
(20) Ozgur, E.; Toren, P.; Aktas, O.; Huseyinoglu, E.; Bayindir, M. Sci. Rep. 2015, 5, 13173.
(21) Kamisetty, N.; Pack, S.; Nonogawa, M.; Devarayapalli, K.; Kodaki, T.; Makino, K. Chem. Lett. 2007, 36, 322−323.
(22) Doring, G.; Parameswaran, I.; Murphy, T. FEMS Microbiol. Rev. 2011, 35, 124−146.
(23) Hauser, A. R.; Jain, M.; Bar-Meir, M.; McColley, S. A. Clin. Microbiol. Rev. 2011, 24, 29−70.
(24) Smith, E. E.; Buckley, D. G.; Wu, Z. N.; Saenphimmachak, C.; Hoffman, L. R.; D’Argenio, D. A.; Miller, S. I.; Ramsey, B. W.; Speert, D. P.; Moskowitz, S. M.; Burns, J. L.; Kaul, R.; Olson, M. V. Proc. Natl. Acad. Sci. U. S. A. 2006, 103, 8487−8492.
(25) Armbruster, D. A.; Pry, T. Clin. Biochem. Rev. (Ultimo, Aust.) 2008, 29 (Suppl 1), S49−S52.
(26) Hermanson, G. T. Bioconjugate techniques, 2nd ed.; Elsevier Academic Press: Amsterdam, 2008.
(27) Soteropulos, C.; Zurick, K.; Bernards, M.; Hunt, H. Langmuir 2012, 28, 15743−15750.
(28) Vernooy, D.; Ilchenko, V.; Mabuchi, H.; Streed, E.; Kimble, H. Opt. Lett. 1998, 23, 247−249.
(29) Brumbarov, J.; Kunze-Liebhauser, J. J. Power Sources 2014, 258, 129−133.
(30) Miller, M.; Linton, R. Anal. Chem. 1985, 57, 2314−2319. (31) Pippig, F.; Hollander, A. Appl. Surf. Sci. 2007, 253, 6817−6823. (32) Min, H.; Girard-Lauriault, P.; Gross, T.; Lippitz, A.; Dietrich, P.; Unger, W. Anal. Bioanal. Chem. 2012, 403, 613−623.
(33) Zhao, J.; Lemoine, P.; Liu, Z.; Quinn, J.; McLaughlin, J. J. Phys.: Condens. Matter 2000, 12, 9201−9213.
(34) Ozgur, E.; Toren, P.; Bayindir, M. J. Mater. Chem. B 2014, 2, 7118−7122.
(35) Shircliff, R.; Stradins, P.; Moutinho, H.; Fennell, J.; Ghirardi, M.; Cowley, S.; Branz, H.; Martin, I. Langmuir 2013, 29, 4057−4067.
(36) Maria Chong, A. S.; Zhao, X. J. Phys. Chem. B 2003, 107, 12650−12657.
(37) Coffinier, Y.; Nguyen, N.; Drobecq, H.; Melnyk, O.; Thomy, V.; Boukherroub, R. Analyst (Cambridge, U. K.) 2012, 137, 5527−5532.
(38) Demers, L.; Mirkin, C.; Mucic, R.; Reynolds, R.; Letsinger, R.; Elghanian, R.; Viswanadham, G. Anal. Chem. 2000, 72, 5535−5541.
(39) Hinckley, D. M.; Lequieu, J. P.; de Pablo, J. J. J. Chem. Phys. 2014, 141, 035102.
(40) Hagan, M.; Chakraborty, A. J. Chem. Phys. 2004, 120, 4958− 4968.
(41) Hannestad, J.; Brune, R.; Czolkos, I.; Jesorka, A.; El-Sagheer, A.; Brown, T.; Albinsson, B.; Orwar, O. ACS Nano 2013, 7, 308−315.
(42) Livshits, M.; Mirzabekov, A. Biophys. J. 1996, 71, 2795−2801. (43) Porschke, D.; Uhlenbeck, O. C.; Martin, F. H. Biopolymers 1973, 12, 1313−1335.
(44) Vainrub, A.; Pettitt, B. Biopolymers 2003, 68, 265−270. (45) Vainrub, A.; Pettitt, B. Phys. Rev. E 2002, 66, 041905. (46) Peterson, A.; Heaton, R.; Georgiadis, R. J. Am. Chem. Soc. 2000, 122, 7837−7838.
(47) Yildirim, A.; Ozgur, E.; Bayindir, M. J. Mater. Chem. B 2013, 1, 1909−1920.