ANALYSIS OF MEMBERS OF THE SLIT-ROBO PATHWAY AS
DIAGNOSTIC AND PROGNOSTIC TOOLS IN HEPATOCELLULAR
CARCINOMA WITH SPECIAL FOCUS ON ROBO2-ASSOCIATED
CELLULAR PHENOTYPE
A THESIS SUBMITTED TO
THE DEPARTMENT OF MOLECULAR BIOLOGY AND GENETICS AND THE INSTITUTE OF ENGINEERING AND SCIENCE OF
BILKENT UNIVERSITY
IN PARTIAL FULFILLMENT OF THE REQUIREMENTS FOR THE DEGREE OF DOCTOR OF PHILOSOPHY
BY
MEHMET ENDER AVCI AUGUST 2009
I certify that I have read this thesis and that in my opinion it is fully adequate, in scope, and in quality, as a thesis for the degree of Doctor of Philosophy.
____________________
Assist.Prof. Dr.Tamer Yağcı
I certify that I have read this thesis and that in my opinion it is fully adequate, in scope, and in quality, as a thesis for the degree of Doctor of Philosophy.
____________________
Assist.Prof. Dr.Ayşe Elif Erson
I certify that I have read this thesis and that in my opinion it is fully adequate, in scope, and in quality, as a thesis for the degree of Doctor of Philosophy.
____________________
Assist.Prof. Dr.Özlen Konu
I certify that I have read this thesis and that in my opinion it is fully adequate, in scope, and in quality, as a thesis for the degree of Doctor of Philosophy.
____________________
Assist.Prof. Dr.Kamil Can Akçalı
I certify that I have read this thesis and that in my opinion it is fully adequate, in scope, and in quality, as a thesis for the degree of Doctor of Philosophy.
_____________________
Assoc.Prof. Dr.Cengiz Yakıcıer
Approved for the Institute of Engineering and Science
____________________ Prof. Dr. Mehmet Baray
ABSTRACT
ANALYSIS OF MEMBERS OF THE SLIT-ROBO PATHWAY AS DIAGNOSTIC AND PROGNOSTIC TOOLS IN HEPATOCELLULAR CARCINOMA WITH
SPECIAL FOCUS ON ROBO2-ASSOCIATED CELLULAR PHENOTYPE Mehmet Ender Avcı
Ph.D. in Molecular Biology and Genetics Supervisor: Assist. Prof. Tamer Yağcı
August 2009, 126 pages
Hepatocellular carcinoma is the sixth most common cancer in the world, with an annual incidence exceeding half a million. It is associated mainly with hepatitis B and C viral infections; and is the main cause of death among cirrhotic patients. Aflatoxin B1 exposure, chronic alcohol consumption and virtually all cirrhosis-inducing conditions are of the other etiologies. For early diagnosis of HCC, surveillance of the risk groups is a crucial task requiring the development of novel markers for HCC with stronger sensitivity and specificity. In addition, description of biomarkers specific to hepatocellular carcinoma subtypes could identify novel targets for therapy. In this study, we analyzed members of the SLIT-ROBO gene families as novel diagnostic and prognostic markers in hepatocellular carcinoma. We defined an expression signature for members of the SLIT-ROBO gene families in HCC cell lines and tissues by real-time quantitative RT-PCR analysis. We showed that ROBO1 was overexpressed as stage and differentiation of the HCC proceeds. Furthermore, ROBO4 downregulation and SLIT2 overexpression marked late stage and poorly differentiated HCCs. Our results suggest that the expression of ROBO1 and ROBO4 can be used in early diagnosis of HCC. As another focus, we stably knockdowned ROBO2 expression in a model AFP positive cell line Huh7 and characterized the associated cellular phenotype. ROBO2 downregulation caused a significant decrease in proliferation rate whereas in wound-healing assay no significant difference in migration rate was observed. In addition, we performed a microarray experiment and found the differentially expressed genes between stable ROBO2 knockdown and negative clones. In this analysis, we found an overexpression of CK19, CD44, ABCG2/ BCRP1 hepatic progenitor cell markers and CD133 that is also a putative cancer stem cell marker of HCC, in stable ROBO2 knockdown clones. In addition KLF4 expression was augmented in these ROBO2 knockdown clones. We propose a genetic
ÖZET
ROBO2’YE BAĞLI HÜCRESEL FENOTİPE ÖZEL ODAKLA SLIT-ROBO YOLAĞI ÜYELERİNİN HEPATOSELÜLER KARSİNOM TANI VE TAKİBİNDE ARAÇ
OLARAK ANALİZİ Mehmet Ender Avcı
Moleküler Biyoloji ve Genetik Doktora Tezi Tez Yöneticisi: Yrd. Doç. Dr. Tamer Yağcı
Ağustos 2009, 126 Sayfa
Hepatoselüler karsinom, yıllık yarım milyonu aşan yeni vaka sayısıyla, dünya çapında en sık rastlanan altıncı kanser türüdür. Hepatoselüler karsinom, siroz hastalarının temel ölüm sebeplerinden hepatit B ve C enfeksiyonuyla ilişkilendirilmiştir. Aflatoxin B’ye maruz kalma, kronik alkol kullanımı ve sirozu tetikleyen bütün etkenler diğer etiyolojilerdir. Hepatoselüler karsinomun erken tanısı için risk gruplarının takibi önemlidir ve bu kansere karşı spesifisitesi ve duyarlılığı daha yüksek yeni belirteçlerin geliştirilmesi gerekmektedir. Bunun yanında hepatoselüler karsinom alt tipleri için biyobelirteçlerin tanımlanması yeni terapi metodolojilerini de mümkün kılabilir. Bu çalışmada, SLIT-ROBO gen aileleri üyelerinin hepatoselüler karsinom tanı ve takibinde yeni belirteçler olarak kullanılabilirliğini inceledik. Gerçek zamanlı kuantitatif RT-PCR yöntemiyle SLIT-ROBO yolağı genlerinin hepatoselüler karsinomda ifadesini belirleyen bir imza tanımladık. ROBO1 gen ifadesinin hepatoselüler karsinom derecesine ve diferensiyasyonuna bağlı olarak değiştiğini gösterdik. Bununla beraber ROBO4 ifadesindeki azalma ve SLIT2 ifadesindeki artış, ileri derece ve kötü diferensiye hepatoselüler karsinom dokularını belirledi. Sonuçlarımız, ROBO1 ve ROBO4 ifadelerinin hepatoselüler karsinomun erken tanısında kullanılabileceğine işaret etti. Diğer bir odak olarak; AFP ifadesi bulunan iyi diferensiye bir model olan Huh7 hücrelerinde, ROBO2 gen ifadesini kalıcı bir şekilde baskıladık ve bu etkiyle ilişkili hücre fenotipini tanımladık. Bu şekilde elde edilen kalıcı tek-tip hücrelerde, ROBO2 geninin baskılanması hücrelerin bölünme hızını etkilerken yara-iyileşmesi (wound-healing) deneylerinde ölçülen göç hızına istatiksel olarak anlamlı etkisi görülmedi. Bağlantılı bir mikrodizi çalışmasında ROBO2 ifadesi baskılanmış bu hücrelerle, ROBO2’yi ifade eden kontrol hücreler arasında farklı ifadelere sahip genleri inceledik. Bu incelemede CK19, CD44, ABCG2/BCRP2 hepatik öncül hücre belirteçleri ve ayrıca insanda HCC kanser kök hücre belirteci olarak öne sürülen CD133 ifadelerinin, ROBO2 ifadesi baskılanmış hücrelerde arttığını bulduk. Bunlara ek olarak KLF4 ifadesi ROBO2 ifadesi baskılanmış bu hücrelerde arttı. SLIT-ROBO yolağı ve CD133 arasında transkripsiyon seviyesinde genetik bir etkileşim bulunduğunu öne sürüyoruz.
ACKNOWLEDGEMENTS
I would like to thank the special people who had contributed this work in various ways.
I would like to express my gratitude to Assist. Prof. Tamer Yağcı for his supervision, support and valuable suggestions throughout the course of my studies. He always shared his knowledge and experience with me and directed me toward new horizons. I am grateful for his patience, motivation, enthusiasm and understanding.
I am also grateful to Assist. Prof. Özlen Konu for supporting me at every stage of my graduate education and doctoral work. Her un-ending energy has always inspired and motivated me.
I would like to thank Prof. Mehmet Öztürk for his guidance and for being an excellent archetype as a scientist.
I would also like to thank Assist. Prof. Can Akçalı, Assoc. Prof. İhsan Gürsel and Dr. Mayda Gürsel for sharing their experience and knowledge.
I want to thank all MBG supervisors Prof. Tayfun Özçelik, Assoc. Prof. Işık Yuluğ, Assoc. Prof. Rengül Çetin-Atalay, Assist. Prof. Uygar Tazebay, Assist. Prof. Ali Güre, Assist. Prof. Cengiz Yakıcıer for the knowledge and experience they shared through my graduate years.
For their friendship and insights in seemingly troublesome challenges in the lab; I am grateful to Ertuğrul Dalkıç, Koray Kaya, Şerif Şentürk, Hani Al-Otaibi, Nuri Öztürk, Emin Öztaş, Mine Mumcuoğlu, Fatih Semerci, Ceyhan Ceran, Sevgi Bağışlar, Ayça Arslan Ergül, Özge Gürsoy Yüzügüllü, Haluk Yüzügüllü, Bala Gür Dedeoğlu, Tolga Acun, Pelin Gülay, Elif Uz, Eralp Sayit, Tülay Arayıcı and Gonca Koçancı.
It is impossible to express my endless love and thanks to my family and my wife. I will forever be grateful to them. I dedicate this thesis to them.
TABLE OF CONTENTS COVER PAGE………..………..i DEDICATION PAGE………....ii SIGNATURE PAGE……….iii ABSTRACT………...iv ÖZET………..v ACKNOWLEDGEMENTS………...vi TABLE OF CONTENT………vii LIST OF TABLES………xii LIST OF FIGURES……….xiii ABBREVIATIONS………..xv 1 INTRODUCTION... 1 1.1 Hepatocellular carcinoma... 1
1.1.1 Pathogenesis of hepatocellular carcinoma ... 1
1.1.2 Molecular subtypes of hepatocellular carcinoma... 2
1.1.3 Genetic aberrations described in HCC ... 3
1.1.3.1 Genome-wide alterations... 4
1.1.3.2 Mutations... 5
1.1.3.3 Genomic instability ... 5
1.1.3.4 Epigenetic alterations ... 5
1.1.4 Disrupted signaling pathways and molecular targets for HCC therapy ... 6
1.1.4.1 EGFR-Ras-MAPKK pathway ... 7 1.1.4.2 c-Met signaling... 7 1.1.4.3 IGF signaling... 8 1.1.4.4 PI3K/Akt/mTOR pathway... 8 1.1.4.5 Wnt/β-Catenin pathway... 8 1.1.4.6 Hedgehog signaling... 9 1.1.4.7 Apoptotic pathways... 9
1.1.5 Novel markers used in early diagnosis of hepatocellular carcinoma ... 9
1.1.6 Epithelial-mesenchymal transition and HCC metastasis ... 11
1.2 Slit and Robo gene families ... 13
1.2.1 Slit ligands... 14
1.2.2 Robo receptors... 15
1.2.3 Structural basis of Slit-Robo interaction ... 18
1.2.4 Role of Slit-Robo interactions in normal development and physiology ... 18
1.2.4.1 Regulation of commissural axon pathfinding ... 18
1.2.4.2 Role of Slit2-Robo2 interaction in kidney development... 21
1.2.4.3 Role of Slit-Robo in lung development... 22
1.2.5 Slit-Robo in cancer and other pathologies ... 23
1.2.5.1 SLIT-ROBO expression in tumors of various tissues ... 23
1.2.5.2 Epigenetic regulation of SLIT-ROBO genes ... 24
1.2.5.3 Role of SLIT-ROBO signaling in cancer cell migration and immune cell chemotaxis... 24
1.2.5.4 Endothelial cell migration and angiogenesis... 24
1.2.5.5 Disease association of mutations in ROBO1, ROBO2 and ROBO3 genes... 25
1.2.5.6 Regulation of SLIT-ROBO genes in hepatocarcinogenesis... 25
2 OBJECTIVES AND RATIONALE... 27
3 MATERIALS AND METHODS ... 29
3.1 MATERIALS ... 29
3.1.1 Reagents ... 29
3.1.2 Bacterial strains ... 29
3.1.3 Enzymes ... 29
3.1.4 DNA and protein molecular weight markers ... 29
3.1.5 Oligonucleotides... 30
3.1.6 Plasmids ... 30
3.1.7 Electrophoresis, autoradiography, photography and spectrophotometer ... 30
3.1.8 Tissue culture reagents and cell lines... 30
3.1.9 Transfection reagents ... 31
3.1.10 Kits ... 31
3.1.11 Antibodies ... 31
3.2 SOLUTIONS AND MEDIA... 32
3.2.4 Tissue culture solutions... 33
3.2.5 Protein extraction, quantitation and western blotting solutions ... 34
3.2.6 Immunoflourescence solutions... 35
3.2.7 BrdU incorporation assay solutions ... 36
3.3 METHODS... 36
3.3.1 General methods... 36
3.3.1.1 Bacterial transformation... 36
3.3.1.1.1 Super-competent E.coli preparation... 36
3.3.1.1.2 Super-competent E.coli transformation... 37
3.3.1.2 Long term storage of bacterial strains ... 37
3.3.1.3 Plasmid DNA preparation ... 37
3.3.1.4 Preparation of genomic DNA from cultured cells ... 38
3.3.1.5 Extraction of total RNA from tissue culture cells ... 38
3.3.1.6 Quantification and qualification of nucleic acids and proteins ... 38
3.3.1.7 Restriction enzyme digestion of DNA ... 38
3.3.1.8 Agarose gel electrophoresis ... 39
3.3.1.8.1 Agarose gel electrophoresis of DNA ... 39
3.3.1.8.2 Agarose gel electrophoresis of RNA... 39
3.3.2 Database and computer analysis ... 39
3.3.3 Vector construction ... 40
3.3.3.1 Construction of pSEC-shROBO2 vector using Ambion’s Silencer Express system 41 3.3.3.2 Construction of pDEST26 mock vector to be used as control in pDEST26-ROBO2 overexpression experiments ... 44
3.3.4 Tissue culture techniques ... 44
3.3.4.1 Cell lines and stable clones ... 45
3.3.4.2 Thawing cryopreserved cells... 45
3.3.4.3 Growth conditions of cell lines ... 45
3.3.4.4 Cryopreservation of cell lines ... 46
3.3.4.5 Transfection of cell lines ... 46
3.3.4.6 Wound-healing assay ... 47
3.3.5 cDNA synthesis... 47
3.3.6 Primer design for expression analysis by semi-quantitative PCR... 48
3.3.8 Expression analysis of a gene by semi-quantitative PCR ... 50
3.3.8.1 Determination of optimal cycle of a gene for semi-quantitative PCR ... 50
3.3.8.2 GAPDH normalization ... 51
3.3.9 Real time quantitative RT-PCR... 51
3.3.9.1 Real-time quantitative RT-PCR analyses of HCC cell lines... 51
3.3.9.2 Real-time quantitative RT-PCR analyses of HCC tissues ... 52
3.3.10 Crude total protein extraction... 54
3.3.11 Quantification of proteins... 54
3.3.12 Western blotting ... 55
3.3.13 Immunofluorescence ... 55
3.3.14 BrdU incorporation assay... 56
3.4 Microarray experiment and analysis ... 56
3.5 Statistical analysis ... 57
4 RESULTS... 58
4.1 Expression analysis of members of the SLIT-ROBO gene families... 58
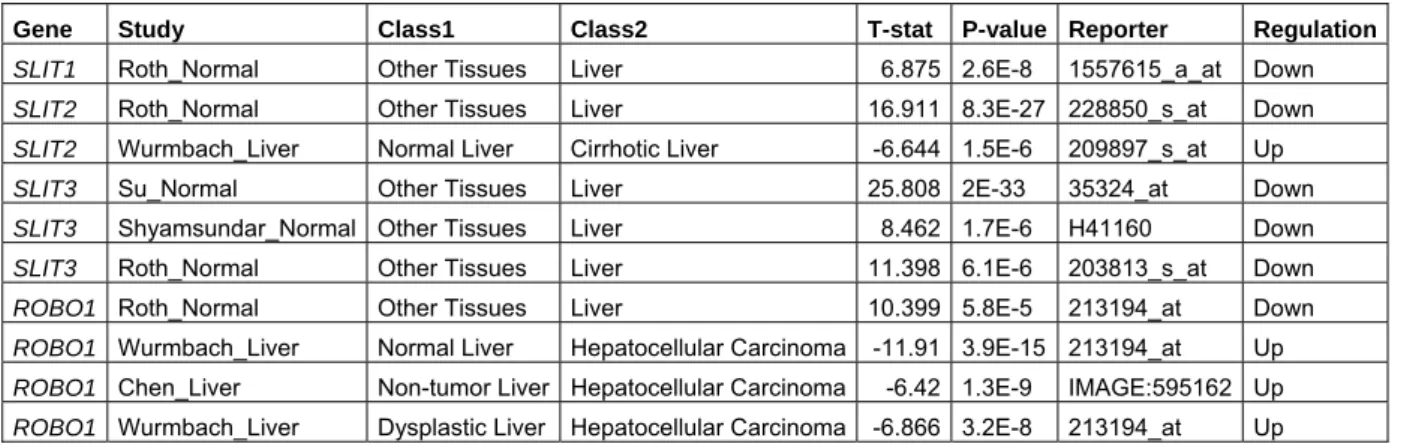
4.1.1 Oncomine cancer profiling database results for SLIT-ROBO gene expression in liver 58 4.1.2 Onco.DB HCC database analysis for genomic gain/amplification or loss associated to SLIT-ROBO gene regions ... 59
4.1.3 SLIT-ROBO genes are expressed in hepatocellular carcinoma cell lines at different levels... 60
4.1.4 AFP positivity is a distinctive marker for poorly- and well-differentiated HCC cell lines 61 4.1.5 SLIT-ROBO expression signature and their coordinate expression in HCC cell lines and liver tissues... 62
4.1.5.1 Quantitative real-time RT-PCR data for SLIT-ROBO genes in HCC cell lines 62 4.1.5.2 Pearson’s correlation analysis revealed genewise expression parallels in HCC cell lines ... 64
4.1.5.3 Cluster analysis identified two subgroups of HCC cell lines with respect to SLIT-ROBO expression ... 64 4.1.5.4 Quantitative real-time RT-PCR data for SLIT-ROBO genes in normal liver
4.1.5.5 SLIT-ROBO genewise clustering observed in HCC cell lines translates into
liver tissues... 70
4.1.5.6 Pearson’s correlation analysis revealed genewise expression parallels in liver tissues and a Mantel’s permutation test confirmed the significance of correlation patterns in HCC cell lines and liver tissues... 71
4.1.5.7 ROBO1 expression differentiates normal tissues from tumors with respect to both stage and differentiation status... 71
4.1.6 An alternatively spliced ROBO2 isoform ROBO2-tv2, which was initially described in zebrafish (Danio rerio) and rat (Rattus norvegicus); is also expressed in human HCC cell lines ... 73
4.2 Characterization of ROBO2 knockdown associated cellular phenotype in HCC .... 75
4.2.1 Stable knockdown of ROBO2 expression in Huh7 cell line ... 75
4.2.2 Expression of the epithelial-to-mesenchymal transition (EMT) markers and E-cadherin suppressors in stable clones... 77
4.2.3 In wound-healing migration assay, there was no significant difference between the migration rates of ROBO2 knockdown and negative clones... 80
4.2.4 Microarray analysis of the differentially expressed genes between stable ROBO2 knockdown clones and negative clones... 82
4.2.4.1 Pathway analysis of microarray results using Pathway-Express tool ... 83
4.2.4.2 Microarray verification of selected differentially expressed genes by semi-quantitative RT-PCR ... 86
4.2.5 Expression of the markers associated with side population, cancer stem cell and pluripotency phenotype was enriched in the stable ROBO2 knockdown clones ... 87
4.2.6 Transient knockdown of ROBO2 did not change the expression of side population, cancer stem cell and pluripotency markers ... 88
4.2.7 CD133 expression in HCC cell lines... 91
4.2.8 Effect of ROBO2 expression on CD133 ... 92
4.2.9 Proliferation rate of stable ROBO2 knockdown clones were diminished... 94
5 DISCUSSION AND CONCLUSION... 97
5.1 Expression signature of SLIT-ROBO genes in HCC... 97
5.2 ROBO2 knockdown phenotype in Huh7 hepatocellular carcinoma cells ... 100
6 FUTURE PERSPECTIVES ... 102
7 REFERENCES………106
LIST OF TABLES
Table 1.1: Key molecular aberrations described in hepatocellular carcinoma ... 4
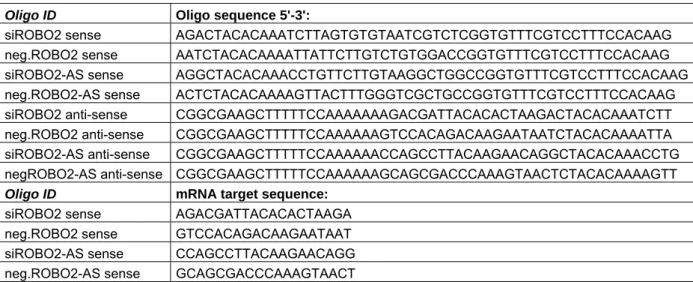
Table 3.1: Target mRNA and oligo sequences for constructing siRNA expression cassettes (SECs) ... 41
Table 3.2: Precursor SEC amplification PCR profile ... 42
Table 3.3: SEC amplification PCR profile... 43
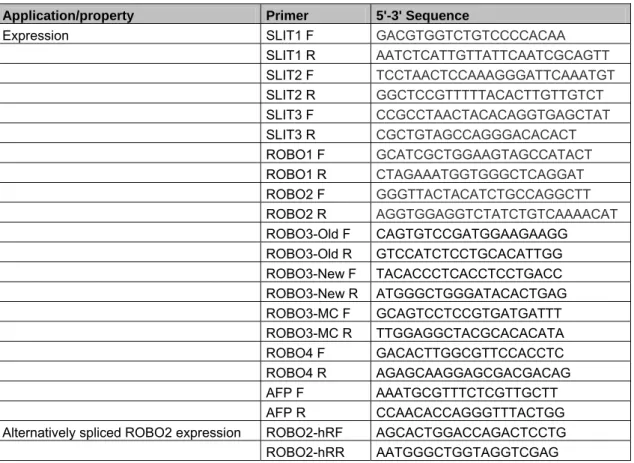
Table 3.4: Application purposes and sequences of the primers used in this study ... 48
Table 3.5: PCR efficiencies of the primer pairs used in QRT-PCR relative quantification analysis ... 51
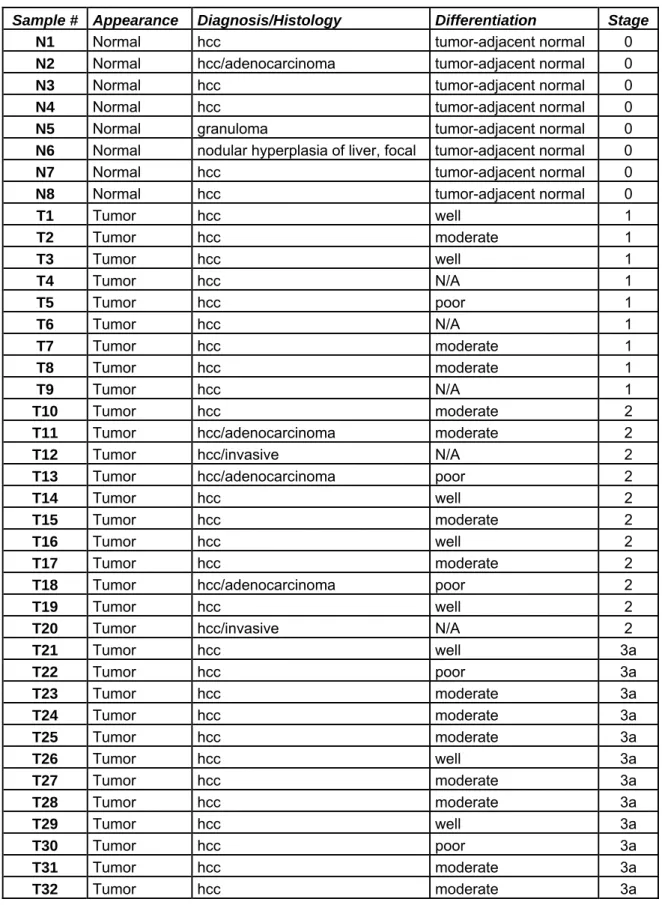
Table 3.6: Clinicopathological characteristics of normal liver and HCC samples ... 53
Table 3.7: Protein sample preparation for Bradford assay... 54
Table 3.8: BSA dilutions for standard curve plot... 55
Table 4.1: Significant differential expression results in liver obtained from Oncomine database ... 59
Table 4.2: Genomic locations of the SLIT-ROBO genes ... 60
Table 4.3: Relative expression values for SLIT-ROBO and AFP genes in HCC cell lines*.... 63
Table 4.4: Genewise correlation of SLIT-ROBO and AFP genes in HCC cell lines... 64
Table 4.5: Relative expression values of SLIT-ROBO and AFP genes in normal liver and HCC samples* ... 68
Table 4.6: Genewise correlation of SLIT-ROBO and AFP genes in liver tissues ... 71
Table 4.7: Differentially expressed SLIT-ROBO genes between histopathological subgroups of liver tissues... 73
LIST OF FIGURES
Figure 1.1: Histopathologic progression and molecular features of HCC. ... 2
Figure 1.2: Molecular targeted therapies in HCC. ... 6
Figure 1.3: Representation of the switch in the presentation of HCC in developed countries, as a result of implementation of surveillance among cirrhotic patients. ... 10
Figure 1.4: Basic structures of Slit and Robo proteins... 15
Figure 1.5: Model depicting the formation of the Slit-induced Robo/Abl–Ncadherin/β-catenin complex. ... 17
Figure 1.6: Commissural axon pathfinding in the mouse spinal cord and Drosophila ventral nerve cord... 19
Figure 1.7: Robo3 antagonizes Robo1 to allow crossing in mice... 20
Figure 1.8: A Robo code for lateral positioning in Drosophila. ... 21
Figure 1.9: SLIT2-ROBO2 signaling is essential for proper kidney development in mice... 22
Figure 3.1: Overview of the Silencer Express procedure... 42
Figure 3.2: Ambion’s pSEC neo vector map. ... 43
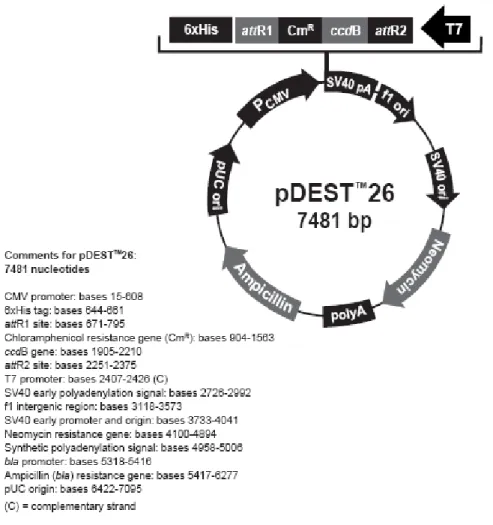
Figure 3.3: Restriction map of the pDEST™26 Gateway® vector. ... 44
Figure 4.1: Semi-quantitative expression analysis of SLIT-ROBO genes in HCC cell lines. .. 61
Figure 4.2: Quantification of AFP transcript levels reveals two groups in HCC cell lines. .... 62
Figure 4.3: SLIT-ROBO expression establishes two groups, which predict AFP expression levels in HCC cell lines... 65
Figure 4.4: One-way ANOVA for AFP expression between Group1 and Group2 cell lines. . 66
Figure 4.5: Significant one-way ANOVA results of individiual SLIT-ROBO genes between Group1 and Group2 HCC cell lines. ... 67
Figure 4.6: Significant one-way ANOVA results of individiual SLIT-ROBO genes between normal and HCC tissues... 69
Figure 4.7: Genewise clustering of SLIT-ROBO genes in HCC cell lines translates into liver tissues. ... 70
Figure 4.8: Significant one-way ANOVA results of individiual SLIT-ROBO genes between normal and HCC tissues... 72
Figure 4.9: Expression of transcript variant ROBO2-tv2 (including the described conserved alternative exon, CAE) and ROBO2-tv1 (lacking CAE) in HCC cell lines. ... 75
Figure 4.10: Relative ROBO2 expression in pSEC transfected stable Huh7 clones... 76
Figure 4.12: Evaluation of the EMT marker expression in stable clones. ... 78 Figure 4.13: Quantitative expression of E-cadherin and its suppressors SLUG and SIP1 in
stable clones. ... 79 Figure 4.14: β-catenin immunoflourescence staining in R2C10, NC4 clones and parental
Huh7 cells... 79 Figure 4.15: Wound-healing assay results for stable clones in normal and serum starved
medium... 81 Figure 4.16: Representative wound healing assay photographs. ... 81 Figure 4.17: Visualization of 18S and 28S rRNAs in total RNAs isolated from stable clones in formaldehyde agarose gel... 82 Figure 4.18: Box- and MA-plots of shROBO2 RNA (2C) and negative RNA (NC) probed
chips before and after RMA normalization... 83 Figure 4.19: Significantly affected pathways identified in Pathway-Express. ... 85 Figure 4.20: Pathway-Express output of axon guidance pathway and the differentially
expressed genes in the pathway. ... 86 Figure 4.21: Microarray verification with selected genes using semi-quantitative RT-PCR.. 87 Figure 4.22: Semi-quantitative expression analysis of side population, cancer stem cell and
pluripotency associated genes in stable clones. ... 88 Figure 4.23 Side population, cancer stem cell and pluripotency associated genes in shROBO2 transiently transfected cells. ... 89 Figure 4.24: CD133, ROBO2 and β-catenin staining in transient shROBO2 transfected Huh7 cells... 91 Figure 4.25: CD133 expression in HCC cell lines. ... 91 Figure 4.26: CD133 expression in selected stable clones. ... 92 Figure 4.27: CD133 immunoflourescence staining in R2C10, NC4 clones and parental Huh7 cells... 93 Figure 4.28: ROBO2 re-introduction into selected stable ROBO2 knockdown clones had no
apparent effect on CD133 expression. ... 94 Figure 4.29: Percent BrdU incorporation in stable clones after 24 hours incubation in the
presence of BrdU... 95 Figure 4.30: p15 expression in selected stable clones... 96
ABBREVIATIONS
ABCG2 ATP-binding cassette, sub-family G (white),
member 2
Abl Abelson tyrosine kinase
ACTB β-actin
AFP Alpha fetoprotein
Amp Ampicillin
ANOVA Analysis of variance
APC Adenomatous polyposis coli
APS Ammonium persulphate
ASMA α-smooth muscle actin
BCRP1 Breast cancer resistance protein 1
bp Base pairs
BrdU Bromodeoxyuridine
BSA Bovine serum albumin
CAM Cell adhesion molecule
Cdc42 Cell division cycle 42
cDNA Complementary DNA
CK19 Cytokeratin 19
CNS Central nervous system
CSC Cancer stem cell
Ct Cycle threshold
C-terminus Carboxy terminus
DCC Deleted in colorectal cancer
ddH2O Double distilled water
DGCP Des-γ-carboxyprothrombin
DMEM Dulbecco’s modified eagle’s medium
DMSO Dimethyl sulfoxide
DNA Deoxyribonucleic acid
dNTP Deoxyribonucleotide triphosphate
ds Double strand
EDTA Ethylenediaminetetraacetic acid
EGFR Epidermal growth factor receptor
EMT Epithelil-mesenchymal transition
EtBr Ethidium bromide
FBS Fetal bovine serum
GAPDH Glyceraldehyde-3-phosphate dehydrogenase
GPC-3 Glypican-3
HCC Hepatocellular carcinoma
HBV Hepatitis B virus
HCV Hepatitis C virus
HGF Hepatocyte growth factor
HRP Horseradish peroxidase
HSC Hepatic stellate cell
HSP70 Heat shock protein 70
Ig Immunoglobulin
IGF2 Insulin-like growth factor-2
IGF2R1 IGF2 receptor
IGFBP IGF-binding protein
Kan Kanamycin
Kb Kilobase
kDa Kilodalton
KLF Kruppel-like factor
LB Luria-Bertani media
LRR Leucine rich repeat
mAb Monoclonal antibody
MAPK Mitogen activated protein kinase
μg Microgram mg Miligram min Minute μl Microliter ml Mililiter μm Micrometer μM Micromolar
mTOR Mammalian target of rapamycin
NaCl Sodium chloride
NaOH Sodium hydroxide
NEAA Non-essential amino acid
NOD/SCID Non-obese diabetic/severe combined
immunodeficient
N-terminus Amino terminus
Oligo(dT) Oligodeoxythymidylic acid
PBS Phosphate buffered saline
PCR Polymerase chain reaction
PDGF Platelet-derived growth factor
PI3-K Phosphatidylinositol 3-kinase
pmol Picomole
PTEN Phosphatase and tensin homolog
QRT-PCR Quantitative real time RT-PCR
Rb Retinoblastoma
RMA Robust multichip average
RNA Ribonucleic acid
ROBO Roundabout
Rpm Revolutions per minute
RT PCR Reverse transcription PCR
SDS Sodium dodecyl sulfate
SDS-PAGE SDS polyacrilamide gel electrophoresis
Sec Second
shRNA short hairpin RNA
SIP1 smad interacting protein 1
siRNA small interfering RNA
srGAP1 Slit–Robo Rho GTPase-activating protein 1
TAE Tris-Acetate-EDTA buffer
TBS Tris buffered saline
TERC Telomerase RNA
TERT Telomerase reverse transcriptase
TGF Transforming growth factor
TNF Tumor necrosis factor
TRAIL TNF-related apoptosis-inducing ligand
Tris Tris (hydroxymethyl)- methylamine
Tv Transcript variant
UV Ultraviolet
v/v Volume/volume
VEGF Vascular endothelial growth factor
1 INTRODUCTION
1.1 Hepatocellular carcinoma
Being the largest organ inside the body, liver has several physiological functions such as bile production and excretion; excretion of bilirubin, hormones, and drugs; metabolism of fats, proteins, carbohydrates; activation of enzymes; storage of glycogen, vitamins and minerals; synthesis of plasma proteins and clotting factors; blood detoxification and purification.
Liver cancer contains diverse, histologically distinct primary hepatic neoplasms, which include hepatocellular carcinoma (HCC), intrahepatic bile duct carcinoma (cholangiocarcinoma), hepatoblastoma, bile duct cystadenomacarcinoma, hemangiosarcoma and epitheloid hemangioendothelioma (Anthony 2002). Among these, hepatocellular carcinoma is the most common kind of liver cancers comprising 83% of all cases (American cancer society 2005 (Piper, Nurcombe et al. 2002)).
1.1.1 Pathogenesis of hepatocellular carcinoma
The molecular pathogenesis of HCC is a complex process involving different genetic and epigenetic alterations, chromosomal aberrations, gene mutations, and altered molecular pathways (Farazi and DePinho 2006). HCC arises in normal livers, abnormal but noncirrhotic livers, and in cirrhotic livers in 80% of cases resulting from several environmental risk factors (Llovet, Burroughs et al. 2003; Bruix and Sherman 2005).
Beginning from stem cells or mature hepatocytes, a multistep process occurs during transformation of cirrhotic liver into cancer by the accumulation of genetic alterations. Increased levels of transforming growth factor-α (TGF-α) and insulin-like growth factor-2 (IGF-2), lead to increased rate of hepatocyte proliferation in chronic HCV patients (Thorgeirsson and Grisham 2002; Bruix, Boix et al. 2004; Farazi and DePinho 2006; Villanueva, Newell et al. 2007). There is experimental evidence suggesting HCV core protein as a Wnt ligand, a transactivator of Ras signaling and a p53 inactivator (Branda and Wands 2006). In the case of chronic HBV infection; promoter activation of oncogenes, DNA rearrangements and chromosomal instability occur as a result of nonrandom HBV-DNA
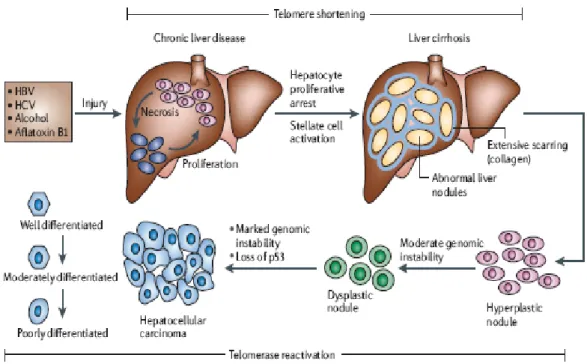
integration (Ferber, Montoya et al. 2003). In addition, oxidative stress induced genomic and mitochondrial DNA damage arises because of the chronic inflammation of the liver (Hussain, Schwank et al. 2007). At preneoplastic stages, presence of genetic aberrations (allelic deletions) and epigenetic alterations (aberrant methylation) results in proliferation of selected cell populations into dysplastic nodules, which are HCC precursors. These cells gradually increase their telomerase activity in order to gain replicative potential. Ultimately, survival and proliferation related pathways are activated that brings on the malignant phenotype (Figure 1.1).
Figure 1.1: Histopathologic progression and molecular features of HCC. After hepatic injury incurred by
any one of several factors (HBV, HCV, alcohol and aflatoxin B1) there is necrosis followed by hepatocyte proliferation. Continuous cycles of this destructive-regenerative process foster a chronic liver disease condition that culminates in liver cirrhosis. Subsequently, hyperplastic nodules are observed, followed by dysplastic nodules and ultimately hepatocellular carcinoma (HCC). Telomerase reactivation, loss and/or mutation of p53 and genomic instability also characterize hepatocarcinogenesis (Farazi and DePinho 2006).
1.1.2 Molecular subtypes of hepatocellular carcinoma
In an effort to combine Vogelstein’s solid tumor development concept- stating the requirement of the disruption of three critical intracellular signaling networks- and the famous “Hallmarks of cancer” description of Hanahan and Weinberg; Llovet and Bruix proposed that HCCs have common disturbances and additionally more specific alterations identifying distinct classes (Hanahan and Weinberg 2000; Vogelstein and Kinzler 2004; Llovet and Bruix
TP53 point mutations or loss of heterozygosity, p16 or Retinoblastoma (Rb) gene silencing, or cyclinD1 overexpression. Secondly, in early stages of hepatocarcinogenesis, autocrine/paracrine vascular endothelial growth factor (VEGF), platelet-derived growth factor (PDGF), or angiopoietin-2 or VEGFA gene amplification results in abnormal angiogenesis. Third, aberrantly proliferating cells evade apoptosis through inactivation of p53 or overexpression of anti-apoptotic Bcl2. Finally, telomerase reverse transcriptase is reactivated to guarantee replicative immortality.
In gene expression studies, more specific alterations in cell proliferation and survival genes have defined molecular subtypes of HCC. One such class shows activation of Wnt signaling showing predominant mutations in CTNNB1. The protein product of CTNNB1 gene; β-catenin escapes from ubiquitination through mutations or deletions in exon 3 of CTNNB1, resulting in nuclear translocation and target gene activation in the absence of Wnt ligands. Along with high proliferation and chromosomal instability, activation of RAS/mitogen-activated protein kinase kinase (MAPKK), insulin-like growth factor (IGF), c-met, or Akt/mammalian target of rapamycin (mTOR) signaling pathways defines another HCC subclass. Stemness characteristics, indicating progenitor cell origin, are associated with this subclass. Linked with leukocyte infiltration, interferon signaling represents a third class. The role of nuclear factor-κβ signaling, Janus kinase-signal transducer and activator of transcription (Jak-Stat), TGF-β, and hedgehog signaling activation is ambiguous. Another class represents the molecular mechanisms responsible for cell dissemination, invasiveness, and metastasis (Breuhahn, Vreden et al. 2004; Lee, Heo et al. 2006; Boyault, Rickman et al. 2007; Chiang, Villanueva et al. 2008; Llovet and Bruix 2008).
1.1.3 Genetic aberrations described in HCC
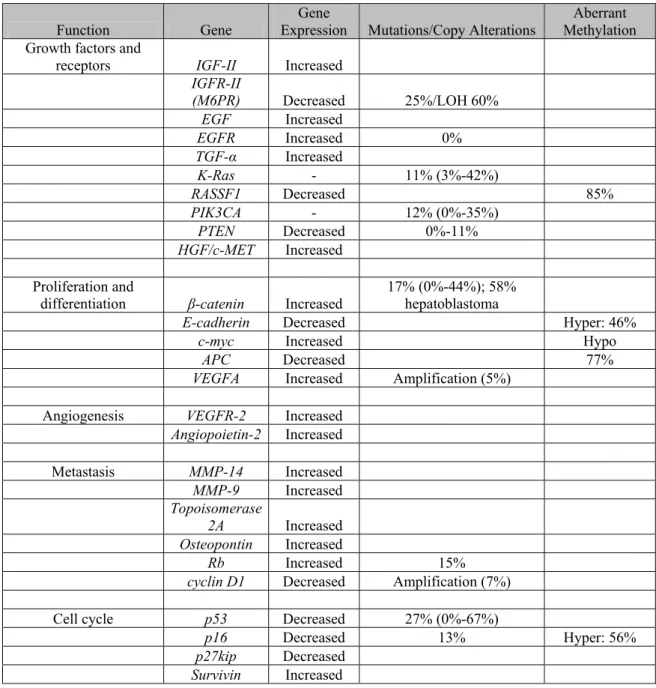
Contemporary use of high-throughput technologies like single-nucleotide polymorphism array, complementary cDNA microarray and protein mass spectrometry has brought a new perspective in our understanding of genetic aberrations in HCC. These aberrations can be grouped under four main titles: genome-wide alterations, mutations, genomic instability (being structural alterations) and epigenetic alterations. Table 1.1 summarizes the most frequent molecular aberrations in HCC that can be targeted therapeutically (Villanueva, Newell et al. 2007).
Table 1.1: Key molecular aberrations described in hepatocellular carcinoma
Function Gene Expression Gene Mutations/Copy Alterations Methylation Aberrant Growth factors and
receptors IGF-II Increased
IGFR-II (M6PR) Decreased 25%/LOH 60%
EGF Increased EGFR Increased 0% TGF-α Increased K-Ras - 11% (3%-42%) RASSF1 Decreased 85% PIK3CA - 12% (0%-35%) PTEN Decreased 0%-11% HGF/c-MET Increased Proliferation and
differentiation β-catenin Increased 17% (0%-44%); 58% hepatoblastoma
E-cadherin Decreased Hyper: 46%
c-myc Increased Hypo
APC Decreased 77%
VEGFA Increased Amplification (5%)
Angiogenesis VEGFR-2 Increased
Angiopoietin-2 Increased Metastasis MMP-14 Increased MMP-9 Increased Topoisomerase 2A Increased Osteopontin Increased Rb Increased 15%
cyclin D1 Decreased Amplification (7%)
Cell cycle p53 Decreased 27% (0%-67%)
p16 Decreased 13% Hyper: 56%
p27kip Decreased
Survivin Increased
1.1.3.1 Genome-wide alterations
c-myc (8q), Cyclin A2 (4q), Cyclin D1 (11q), Rb1 (13q), AXIN1 (16p), p53 (17p), IGFR-II/M6PR (6q), p16 (9p), E-Cadherin (16q), SOCS (16p), and PTEN (10q) are among the candidate genes in hepatocarcinogenesis. Virtually, in all tumors chromosomal amplifications or deletions are found. The most prevalent amplifications are in 1q (58%-78%), 6p, 8q, 17q, and 20q, and deletions are in 4q, 8p, 13q, 16q, and 17p. The regions harboring cyclin D1 and VEGFA are found to have high-level amplifications: 11q13 (5% of cases) and 6p21 (4%-6%
1.1.3.2 Mutations
Somatic mutations of HCC are seen very scarcely and needs further investigation by the use of high-throughput sequencing technology (Villanueva, Newell et al. 2007). TP53 is mutated in 27% of cases (range 0%-67%); correlative to its functions in cell cycle control, DNA repair, apoptosis, and differentiation. In Africa and Asia, Aflatoxin B exposure is associated with p53 G-to-T mutation at the third position of codon 249 (Puisieux, Lim et al. 1991). β-catenin mutations in exon 3 are present in 17% of cases of HCC, and in 58% of cases of hepatoblastoma. Somatic mutations of AXIN1, phosphoinositol 3-kinase A (PI3KA), and K-Ras have been described, rarely. In contrast to the other cancers with mutations of epidermal growth factor receptor (EGFR), Her2/nu phosphatase and tensin homolog (PTEN), or H-Ras; in HCCs these mutations are hard to find. In addition, till now no germline mutations were described for these genes in HCCs (Llovet and Bruix 2008).
1.1.3.3 Genomic instability
HBV integration in the TERT locus, amplification of the gene encoding the telomerase RNA component (TERC), or allelic loss of chromosome 10p, a region encoding a telomerase repressor culminates in increased telomerase activity, in nearly 90% of human HCCs. Being prevalent in HBV-related HCCs, high genomic instability has been associated with the proliferation subclass of HCC (Farazi, Glickman et al. 2003; Llovet and Bruix 2008).
1.1.3.4 Epigenetic alterations
Epigenetic silencing of gene expression occurs by abnormal methylation of gene promoter regions. Liver cancer cells have certain areas of dense hypermethylation over a background of global hypomethylation. Hypermethylation affects CpG islands localized in promoter regions of tumor suppressor genes like p16INK4a, E-cadherin, NORE1A, RASSF1, IGFR-II/MP6, and BRCA1 (Thorgeirsson and Grisham 2002; Bruix, Boix et al. 2004; Farazi and DePinho 2006; Villanueva, Newell et al. 2007).
1.1.4 Disrupted signaling pathways and molecular targets for HCC therapy
Disrupted signaling pathways put protein kinases forward as the main targets for liver cancer therapy. Upon the characterization of the whole kinome the emergence of novel oncology drugs has paced up. The key signaling pathways connected to the pathogenesis of HCC and the monoclonal antibodies and small molecules targeting these pathways are summarized in Figure 1.2 (Llovet and Bruix 2008).
Figure 1.2: Molecular targeted therapies in HCC. Representation of monoclonal antibodies against ligands
(VEGFR: bevacizumab; EGFR: cetuximab) tyrosine kinase inhibitors (VEGFR: sorafenib, sunitinib; PDFGR: sorafenib, sunitinib; EGFR: erlotinib, lapatinib; AEE788, Her2/nu: lapatinib, AEE788), serine/threonine kinase inhibitors (Raf: sorafenib; mTOR: rapamycin, everolimus; PI3K: XL-765 ) in preclinical studies or clinical trials in HCC (Llovet JM and Bruix J, 2008).
1.1.4.1 EGFR-Ras-MAPKK pathway
Binding of the cognate receptors by the ligands EGF, hepatocyte growth factor (HGF), PDGF, and VEGF activate the RAS/MAPK signaling pathway and induce transcription of genes of the AP1 family such as c-fos and c-jun, which are key elements for cell proliferation (Robinson, Wu et al. 2000). The EGFR is a member of a family of four related receptors (Her2/Neu, ErbB3, and ErbB4) that upon ligand binding trigger tyrosine kinase activity and consequently initiate signal transduction. Gain of function of EGFR classically occurs as a result of point mutations, amplification, or increase in ligand-receptor interaction (Baselga and Arteaga 2005).
Monoclonal antibodies against EGFR (cetuximab) or ErbB2/Her2/neu (trastuzumab) antagonize the tyrosine kinase activities of these receptor and thus blocks downstream signaling. Small molecule inhibitor erlotinib acts against the catalytic domain of EGFR and lapatinib acts against both EGFR and Her2 (Shepherd, Rodrigues Pereira et al. 2005; Bonner, Harari et al. 2006; Geyer, Forster et al. 2006; Jonker, O'Callaghan et al. 2007). In HCC, Ras/MAPK pathway activation might result from aberrant upstream signals (EGFR signaling, IGF signaling) or inactivation of tumor suppressor genes by aberrant methylation, as NORE1A (Calvisi, Ladu et al. 2006). Mutations of Raf and Ras are rare findings in HCC. Potent drugs blocking Ras/MAPK signaling are still at the exploratory phase, except for sorafenib, which has activity inhibiting B-Raf at nanomolar concentrations (Wilhelm, Carter et al. 2006; Llovet and Bruix 2008).
1.1.4.2 c-Met signaling
During injury-induced heaptocyte regenaration, hepatocyte growth factor is secreted by stellate cells and binds to the c-MET receptor (Fausto, Campbell et al. 2006). Although the direct link between HGF-cMet signaling and HCC has not been established, dysregulation of c-Met and HGF was observed in HCC (Takami, Kaposi-Novak et al. 2007; Villanueva, Newell et al. 2007). Several compounds have been developed that target the MET pathway, including antibodies against HGF or MET receptor, or selective small-molecule MET inhibitors, but none of them are yet in an advanced stage of research in HCC (Comoglio, Giordano et al. 2008).
1.1.4.3 IGF signaling
IGF-I has been associated with high risk of neoplasm development, but not in HCC. In fact, experimental studies suggest the potential role of this molecule in improving cirrhosis. IGF-II is overexpressed in around 30% of human HCCs and the tumor suppressors IGF binding protein-1 (IGFBP-1), IGFBP-3, and IGFBP-4 are down-regulated. More important, the tumor suppressor IGFR-II, whose main action consists of binding and degrading IGF-II, is down-regulated in a subgroup of HCCs as a result of chromosomal deletions in the IGFR-II locus (6q) or point mutations. Several monoclonal antibodies and small molecules blocking IGF-1R are under early clinical investigations (A12, XL228) (Breuhahn, Longerich et al. 2006; Llovet and Bruix 2008).
1.1.4.4 PI3K/Akt/mTOR pathway
Although the role of pAkt in HCC needs further investigation, recent studies have suggested a worse prognosis for tumors with activated Akt. An important mediator of the PI3K-Akt pathway is mTOR, which acts as a central regulator of cell growth and proliferation, by sensing nutritional status and allowing progression from G1 to S phase. The mTOR pathway is activated in a subset of HCCs, and its blockade with rapamycin or everolimus inhibits growth in HCC cell lines, and in experimental models. Everolimus (a rapamycin analog) and termsirolimus are approved for the treatment of renal cancer. Novel compounds are currently being tested in early clinical trials. These molecules (rapamycin and analogs) are already approved as immunosuppressive treatments after liver transplantation (Sabatini 2006; Llovet and Bruix 2008; Schmitz, Wohlschlaeger et al. 2008).
1.1.4.5 Wnt/β-Catenin pathway
The Wnt-βcatenin pathway is implicated in colon cancer and HCC. Unfortunately, it constitutes the most undruggable pathway. Activation of the Wnt cascade has been shown in one third of HCCs, particularly in HCV-induced HCCs. Mutations in β-catenin occurs in around 17% of cases (ranging from 0%-44%) (Table 1.1); and association between Wnt pathway activation and the nuclear sequestration of β-catenin has been described by immunohistochemistry. Wnt canonical pathways can also be activated by aberrant methylation of the tumor supressors APC (adenomatous polyposis coli) and E-cadherin or by
HCC deserves further research. New drugs targeting this pathway are under early clinical development (Laurent-Puig, Legoix et al. 2001; Moon, Kohn et al. 2004; Villanueva, Newell et al. 2007; Chiang, Villanueva et al. 2008; Llovet and Bruix 2008).
1.1.4.6 Hedgehog signaling
Overexpression of Sonic Hedgehog has been recently described in 60% of 115 human HCCs and its effective blockage leads to down-regulation of Gli related target genes. Moreover, tumorigenic activation of Smo can mediate c-myc overexpression, which plays an important role in hepatocarcinogenesis (Osipo and Miele 2006; Llovet and Bruix 2008).
1.1.4.7 Apoptotic pathways
Apoptosis is one of the mechanisms leading to cell death when cells have sustained damage to their DNA or cytoskeleton. Evasion of this mechanism is one of the hallmarks of cancer. Several proapoptotic receptor agonists targeting the extrinsic apoptosis pathway (including the ligand recombinant human Apo2L/tumor necrosis factor-related apoptosis inducing ligand [TRAIL]) and the intrinsic apoptotic pathway (BCL-2 antisense) are in development. Synergistic effects have been described with the combination of small molecules and agonists of Apo2L/TRAIL pathway in experimental models. For instance, sorafenib has been shown to sensitize resistant human cancer cells to TRAIL-induced death, providing the rationale for testing these combinations (Hanahan and Weinberg 2000; Ashkenazi and Herbst 2008; Llovet and Bruix 2008).
1.1.5 Novel markers used in early diagnosis of hepatocellular carcinoma
Cirrhosis is the strongest and the most common known risk factor for hepatocellular carcinoma (HCC), particularly cirrhosis related to hepatitis C virus (HCV) and hepatitis B virus (HBV) infections. In addition, HBV acquired in the perinatal period and early childhood is associated with increased risk of HCC even in the absence of cirrhosis (El-Serag, Marrero et al. 2008). Thus, there is a need for surveillance of the risk groups for early diagnosis of HCC.
Nowadays, early HCC diagnosis is feasible in 30–60% of cases in developed countries and this enables the application of curative treatments. In fact, while tumors less than 2 cm in diameter represented <5% of the cases in the early nineties in Europe, now they represent up to 30% of cases in Japan (Figure 1.3) (Llovet and Bruix 2008). However, detection of minute nodules of ~2 cm poses a diagnostic challenge as they are difficult to characterize by radiological or pathological examination. These nodules are defined as pre-neoplastic lesions. Dysplastic lesions should be followed by regular imaging studies, since one third of them will develop a malignant phenotype. Conversely, early tumors are treated with potentially curative procedures- albeit expensive- such as resection, transplantation and percutaneous ablation. Therefore, accurate diagnosis of small liver nodules is of paramount importance.
Figure 1.3: Representation of the switch in the presentation of HCC in developed countries, as a result of implementation of surveillance among cirrhotic patients. Estimates of applicability of potentially curative
therapies have been divided in three periods: until 1990: 5–10% of cases; 1990–2010: 30–40% of cases; 2010– 2020: 40–60% of cases (Llovet and Bruix 2008- Journal of Hepatology).
The major diagnostic techniques for HCC include serum markers, various imaging modalities and histological analysis (Gomaa, Khan et al. 2009). Immunostaining with CD34 and alpha
biomarkers such as AFP, des-γ-carboxyprothrombin (DGCP) and AFP-L3 fraction are not accurate for the early diagnosis of HCC (Bruix and Sherman 2005). Non-invasive radiological criteria have been developed by using state-of-the-art radiological techniques, unfortunately their sensitivity is modest: only 30% of the HCC cases are confirmed by non-invasive criteria and this highlights the need for complementary tools. Recently, genome-wide DNA microarray or quantitative real time reverse-transcriptase polymerase chain reaction (RT-PCR) studies have attempted to identify markers of early HCC, such as heat shock protein 70 (HSP70), Glypican-3 (GPC3), telomerase reverse-transcriptase (TERT), serine/threonine kinase 15 (STK6) and phospholipase A2 (PLAG12B) (Capurro, Wanless et al. 2003; Marrero and Lok 2004). A molecular index including a 13-gene set has also been proposed (including TERT, TOP2A and PDGFRA) (Paradis, Bieche et al. 2003). A microarray-generated signature of 120 genes was reported to discriminate between dysplastic nodules and HCC in HBV patients (Nam, Park et al. 2005). Proteomic studies in tissue have not identified informative HCC markers so far (Paradis, Degos et al. 2005). More recently a 3-gene set (Glypican- 3, LYVE1, and survivin) has been proposed as molecular diagnosis of early HCC with accuracy rates of 85–95% in training and validation sets in more than 70 samples. Immunostaining for Glypican- 3 was also identified as highly predictive of HCC in 75 samples (Llovet, Chen et al. 2006; Llovet and Bruix 2008).
1.1.6 Epithelial-mesenchymal transition and HCC metastasis
Epithelial to mesenchymal transition (EMT) is a process in which epithelial cells lose their phenotypic characteristic and acquire mesenchymal features. These include switch from an apical-basolateral, polarized epithelial phenotype to a spindle-shaped, fibroblast-like mesenchymal phenotype. In their natural state, epithelial cells exist as tight cell clusters that maintain cell-cell or cell-to-matrix contacts, whereas mesenchymal cells are loosely organized, unpolarized cells with reduced adhesion and enhanced migratory tendencies. EMT is well known in embryonic development, but has been recently recognized as a central event in cancer progression, leading to an invasive, mesenchymal-like phenotype important for tumor cell spreading and metastatic dissemination (Thiery and Sleeman 2006; Moustakas and Heldin 2007; van Zijl, Mair et al. 2009).
In the liver, hepatic stellate cells (HCS) are considered as the major fibrotic precursor cells that transdifferentiate to fibrogenic, extracellular matrix producing myofibroblasts in
inflammatory liver tissue upon TGF-β signaling, whereas hepatocytes undergo apoptosis upon signaling by this cytokine. However, identification of different fibrogenic populations apart from resident stellate cells, as well as convergent results of recent studies have challenged the paradigm of HSC as the essential source of liver myofibroblasts and inferred a prominent role for hepatocytes in liver fibrogenesis (Gressner, Rizk et al. 2008; Battaglia, Benzoubir et al. 2009). HCC progression frequently associates with an epithelial to mesenchymal transition (EMT) of hepatocytes caused by the collaboration of STAT5b with the hepatitis B protein, HBX, or by the cooperation of laminin 5 and TGF-β (Giannelli, Bergamini et al. 2005; Lee, Man et al. 2006). In addition, EMT has been reported to occur in cirrhotic liver-derived hepatocytes that exhibited enhanced cell survival dependent on MAPK signaling (Nitta, Kim et al. 2008; van Zijl, Mair et al. 2009).
A key feature in the initiation and execution of EMT is the downregulation of E-cadherin expression. TWIST, Snail1 (SNAI), SLUG and SIP1 (ZEB2) are known transcriptional reppressors of E-cadherin (Thiery 2002; Zhou, Deng et al. 2004; Yook, Li et al. 2005; Matsuo, Shiraha et al. 2009). Vimentin, fibronectin and α-smooth muscle actin (ASMA) expression is characteristic of mesenchymal cells and they are not usually expressed in epithelial cells. The atypical expression of these mesenchymal markers in epithelial cancer cells might be associated with local invasiveness and metastasis potential.
1.1.7 Cancer stem cells in HCC
Cancer stem cells (CSCs) are a minority population of self-renewing stem cells that are entirely responsible for sustaining the tumor as well as giving rise to proliferating but progressively differentiating cells responsible for much of the cellular heterogeneity. With the development of non-obese diabetic/severe combined immunodeficient (NOD/SCID) mice for the xenografting of human tumors came the first good in vivo evidence for the existence of CSCs in leukaemia, breast and brain tumours and also in HCC (Alison, Islam et al. 2009).
Chiba and colleagues have reported that two of the four HCC cell lines that they studied had SP cells comprising 0.25% (for Huh7) and 0.8% (for PLC/PRF/5) of the cell population. These cells were highly proliferative and relatively resistant to apoptosis in vitro. Microarray analysis indicated that several genes implicated in stemness, like Wnt pathway genes, were
standard NOD/SCID mouse assay for CSCs, they found that transplanting 103 liver SP cells consistently yielded tumours, whereas transplantation of 106 non-SP cells failed to give rise to tumors (Chiba, Kita et al. 2006).
CD133 (PROM1) is a pentaspan membrane protein, whose function is as yet unclear, has been suggested as a CSC marker in many different tumors, including colon, pancreas, brain and prostate, although its utility has recently been called into question. Using the CD133/1 antibody, a number of studies have suggested that the CD133-positive fraction enriches for HCC CSCs. As might be expected of CSCs, they appear as a minority (<2%) population in primary tumors, although continued passaging has resulted in considerable enrichment of CD133+ cells in some HCC cell lines, up to 90% (Ma, Chan et al. 2007). HCCs with higher than the median number (1.32%) of CD133-positive cells are correlated with shorter survival, higher recurrence rates and higher tumor grade, and CD133+ cells appear highly resistant to conventional therapeutic drugs, such as 5-FU and doxorubicin (Ma, Lee et al. 2008; Song, Li et al. 2008). It has also been suggested that HCC CSCs are descendents of normal parenchymal stem cells that have lost sensitivity to the inhibitory growth effects of TGF-β, while cell selection based on Thy-1 (CD90), a disputed marker of oval cells, in combination with CD44, has also produced cells with aggressive tumorigenic potential (Tang, Kitisin et al. 2008; Yang, Ho et al. 2008; Yang, Ngai et al. 2008).
1.2 Slit and Robo gene families
The intricate patterning of nervous system is the result of an extraordinary ability of axons and dendrites to detect and identify their correct partners among a plethora of possible interactions. In adult humans, each of over a trillion neurons makes connections with, on average, over a thousand target cells. Axons and dendrites are equipped with a highly motile and sensitive structure called the growth cone at their very tips in order to navigate correctly in such a messy environment. Extracellular guidance cues can either attract or repel growth cones, and can operate either at close range or over a distance. By responding to the appropriate set of cues, growth cones are able to select the correct path toward their target (Tessier-Lavigne and Goodman 1996; Dickson 2002).
In 1970’s and 80’s, the introduction of various in vitro assays enabled scientist to uncover the mechanisms of axon guidance in developing nervous systems of both vertebrates and
invertebrates. As a result, in the early 1990’s several conserved families of axon guidance molecules were discovered. Slit and Robo families are among these molecules interacting with each other and acting as repellent cues (Dickson 2002).
1.2.1 Slit ligands
Slit family of axon guidance cues consists of large extracellular and membrane-associated glycoproteins that are produced by cells of the central nervous system (CNS). Drosophila slit mutants were identified in screens for embryonic patterning and commissural axon pathfinding defects (Nusslein-Volhard C 1984; Seeger, Tear et al. 1993; Hummel, Schimmelpfeng et al. 1999). In these mutants, both ipsilateral and commissural axons unite in the midline rather than growing along it (Rothberg, Jacobs et al. 1990; Battye, Stevens et al. 1999; Kidd, Bland et al. 1999).
Although there is a single Slit in invertebrates, there are three vertebrate Slits: Slit1, Slit2, and Slit3. Vertebrate Slit is secreted from ventral floor plate. The distinctive feature of Slit is its four N-terminal leucine-rich repeat (LRR) domains, abbreviated as D1-D4. C-terminus to LRRs; six epidermal growth factor (EGF)-like domains, a laminin G (LG)-like domain and either one (in invertebrates) or three (in vertebrates) consecutive EGF-like domains, and a C-terminal cystein knot follow. Drosophila slit and mammalian Slit2 are proteolytically cleaved between their fifth and sixth EGF-like domains both in vivo and in vitro. In vitro studies have revealed that N-terminal cleavage product is biologically active whereas C-terminal fragment is inactive (Figure 1.4 B) (Brose and Tessier-Lavigne 2000; Hohenester 2008).
Figure 1.4: Basic structures of Slit and Robo proteins. A) Robo domain organization: Ig,
immunoglobulin-like domain; FN3, fibronectin type 3 domain; TM, transmembrane region; CC0-3, conserved cytoplasmic motifs and phylogenetic analysis of Robo family proteins prepared by using extracellular sequences only. B) Slit domain organization: LRR, leucine-rich repeat; EGF, epidermal growth factor–like repeat; lamG, laminin G domain; Cys, cysteine-rich domain, arrowhead indicates cleavage site in vertebrate and Drosophila Slits and phylogenetic analysis of Slit family proteins. C) Organization of Robo cytoplasmic domains. Color bars indicate presence of individual CC motifs. Gray indicates that the relevant sequence is unavailable. Alignment of selected CC motifs, showing consensus sequences and known binding partners (Dickson and Gilestro, 2006).
1.2.2 Robo receptors
Similar to slit, Drosophila robo was identified in a screen for axon guidance defects in which both ipsilateral and commissural axons pass midline several times, thus given the name “roundabout” (Robo for short) (Seeger, Tear et al. 1993). There are four Robo genes in mammals: Robo1, Robo2, Robo3 (Rig-1) and Robo4 (Magic Roundabout). Subsequently, Slit was defined as a chemorepellent for Robo (roundabout) receptor, and this was evolutionarily conserved (Brose, Bland et al. 1999; Kidd, Bland et al. 1999).
In Caenorhabtidis elegans, there is a single roundabout receptor known as Sax-3. In Drosophila three (Robo, Robo2, Robo3) and in vertebrates four Robo receptors (Robo1/Dutt1, Robo2, Robo3/Rig-1, Robo4/Magic roundabout) exist. Drosophila robos are expressed at midline and when bound to Slits they all act as repellent cues specifying lateral
A)
B)
positioning of the longitudinal axon tracts. In vertebrates, Robos are expressed at CNS floor plate, and Robo3 inhibit the repellent functions of Robo1 and Robo2 like the Commisureless protein in Drosophila (Sabatier, Plump et al. 2004).
Except Robo4, all vertebrate Robos have the same extracellular domain organization resembling a cell adhesion molecule (CAM): from N-terminus to C terminus, five Ig domains and three fibronectin type 3 domains. Robo4 has only two Ig and two fibronectin type 3 repeats (Huminiecki, Gorn et al. 2002). A transmembrane domain link the extracellular part of the protein to the cytosolic part which shows considerable variation with only four conserved motifs, CC0-CC3. The conserved cytosolic domains are present in different combinations in different Robos. Since the cytosolic parts of Robos lack a uniform organization with a ~500 a.a. sequence, it is plausible that they interact with many adaptor proteins at the same time (Hohenester 2008) (Figure 1.4 A).
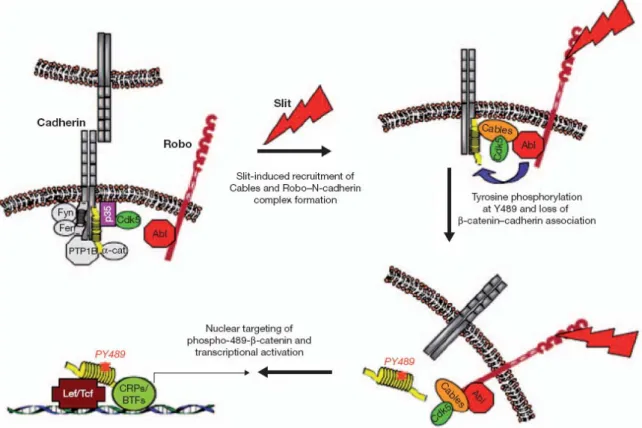
Indeed, the cytosolic domains of Robos are catalytically inactive. Abl (Abelson tyrosine kinase) is associated with Robo and plays an important role in mediating the interaction of Robo with N-cadherin (Bashaw, Kidd et al. 2000; Rhee, Mahfooz et al. 2002). Upon Slit binding to Robo, the adaptor protein Cables is recruited to Robo-associated Abl and forms a multimeric complex by binding directly to N-cadherin-associated β-catenin. Complex formation results in Abl-mediated phosphorylation of β-catenin on tyrosine 489, leading to a decrease in its affinity for N-cadherin, loss of N-cadherin function, and targeting of phospho-Y489-β-catenin to the nucleus. Nuclear β-catenin combines with the transcription factor Tcf/Lef and activates transcription. Thus, Slit induced formation of the Robo-N-cadherin complex results in a rapid loss of cadherin-mediated adhesion and has more lasting effects on gene transcription (Rhee, Buchan et al. 2007) (Figure 1.5).
Figure 1.5: Model depicting the formation of the Slit-induced Robo/Abl–Ncadherin/β-catenin complex.
Fyn and Fer are tyrosine kinases associated with the cadherin complex through p120–catenin25,32. PTP1B, protein tyrosinephosphatase bound directly to N-cadherin; CRPs and BTFs, chromatin remodelling proteins and basal transcription factors, respectively, associated with transcriptionally active β-catenin (Rhee, Buchan et al. 2007).
srGAP1 (Slit–Robo Rho GTPase-activating protein 1) has been shown to bind to the proline-rich CC3 motif of mammalian Robo1 and mediate the Slit-dependent inactivation of the Rho family GTPase, Cdc42 (cell division cycle 42). The adaptor protein Dock/Nck also binds to CC3 (as well as to CC2) and mediates the Slit-dependent recruitment of SOS (Son of sevenless), which in turn activates another Rho GTPase, Rac (Wong, Ren et al. 2001; Fan, Labrador et al. 2003; Yang and Bashaw 2006). These examples illustrate how Slit–Robo signalling could alter cytoskeletal dynamics through regulation of Rho family members. In addition, Ena/VASP proteins bind to CC1 and CC2 (Bashaw, Kidd et al. 2000) and the Rho family GTPase activating protein (GAPs) Vilse/crGAP binds to CC2 (Lundstrom, Gallio et al. 2004; Hu, Li et al. 2005) (Figure 1.4 C). Inhibitor studies have also implicated PI3K (phosphoinositide 3-kinase), MAPKs (mitogen-activated protein kinases) and localized protein synthesis, but the adaptor molecules linking Robo activation to these pathways have yet to be identified (Wang, Xiao et al. 2003; Piper, Anderson et al. 2006). Furthermore, the cytosolic domains of DCC (deleted in colorectal cancer) and Robo receptors have been shown to interact physically, and Slit-activated Robo has been suggested to silence the attractive
Netrin-DCC signal once an axon has reached the CNS midline (Stein and Tessier-Lavigne 2001).
1.2.3 Structural basis of Slit-Robo interaction
All Robos, other than Robo4, were shown to bind to Slit ligands. This interaction is evolutionarily conserved (Brose, Bland et al. 1999). Concave face of Slit D2 domain was described as the minimum Robo binding domain and contains the common binding residues (Drosophila Slit residues Tyr402, Leu424, Tyr450 and His472) for all Drosophila Robos (Howitt, Clout et al. 2004). Also in vertebrates Slit D2 is responsible for Robo binding, containing the four conserved amino acids: Tyr356, Leu378, Tyr404 and His426 for human Robo1 (Morlot, Thielens et al. 2007) and it has the biological activity as a repellent demonstated on Xenopus axon growth cones (Hussain, Piper et al. 2006).
Extracellular IG1 and IG2 domains of Robo proteins are required for Slit interaction (Liu, Patel et al. 2004) and the observed stoichiometry of minimum Slit-Robo interaction is 1:1 (Hussain, Piper et al. 2006). Although Robo IG2 lies far C-terminus to Slit interacting IG1, its deletion has dramatic effects on Slit binding, so the contribution of IG2 should further be clarified (Hohenester 2008).
1.2.4 Role of Slit-Robo interactions in normal development and physiology
1.2.4.1 Regulation of commissural axon pathfinding
The slit mutant was identified first in the classic genetic screen for embryonic patterning defects in Drosophila and subsequently in screens for commissural axon pathfinding defects. The mutants are characterized by the collapse of axon tracts onto the midline. robo was also initially identified through genetic studies in Drosophila; specifically, in the screen for mutants with commissural axon pathfinding defects. In robo mutant embryos, too many axons cross the midline, including both ipsilateral axons that aberrantly cross and commissural axons that recross (Nusslein-Volhard C 1984; Rothberg, Jacobs et al. 1990; Seeger, Tear et al. 1993; Kidd, Brose et al. 1998; Hummel, Schimmelpfeng et al. 1999; Kidd, Bland et al. 1999).
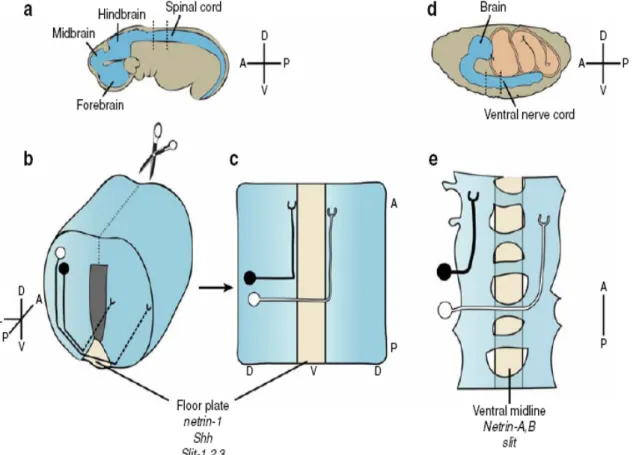
Vertebrate commissural neurons are born in the dorsal spinal cord, and their axons are first drawn to the midline by the chemoattractants netrin and sonic hedgehog, which emanate from the ventral floor plate (Kennedy, Serafini et al. 1994; Serafini, Kennedy et al. 1994; Charron, Stein et al. 2003). These axons then cross the floor plate and turn longitudinally on the opposite (contralateral) side, growing right alongside the floor plate, laterally. Drosophila commissural neurons also require netrins for crossing (Harris, Sabatelli et al. 1996; Mitchell, Doyle et al. 1996) (Figure 1.6).
Figure 1.6: Commissural axon pathfinding in the mouse spinal cord and Drosophila ventral nerve cord.
(a) Schematic of E9.5 mouse embryo. (b) Spinal cord section from E12.5 mouse embryo (as indicated by dashed lines in a). Examples of commissural (white) and ipsilateral (black) neurons are shown. (c) “Open-book” preparation, obtained by dissecting the spinal cord along the dashed line as indicated in b and laying it flat. (d ) Stage 16 Drosophila embryo, at the end of embryogenesis. (e) Dorsal view of two segments of the ventral nerve cord, showing examples of intersegmental commissural (white) and ipsilateral (black) neurons. A, anterior; P, posterior; D, dorsal; V, ventral; L, lateral (Dickson and Gilestro, 2006).
In Drosophila, commisureless sorts robo to endosomes during midline crossing, thus prevents Slit’s repulsive effect (Keleman, Rajagopalan et al. 2002). In vertebrates, Robo3 has a similar effect and suppresses Robo1 activity in precrossing axons. However, in postcrossing axons Robo3 action is relieved allowing Robo1 to be expressed and arrest DCC activity. In
addition, Slit interaction with Robo1 blocks floor plate recrossing in these postcrossing axons (Stein and Tessier-Lavigne 2001; Sabatier, Plump et al. 2004) (Figure 1.7).
Figure 1.7: Robo3 antagonizes Robo1 to allow crossing in mice. In precrossing commissural axons, Robo3
levels are high, and Robo1 levels low. Robo3A is thought to inhibit Robo1-mediated repulsion in these axonsso that they are instead attracted to the floor plate by netrin-1 and sonic hedgehog. After crossing, Robo3 levels are low, and Robo1 levels high. Axons are now repelled by signaling of Slit through Robo1. In addition, attraction to netrin-1 may be downregulated, possibly owing to a Slit-dependent interaction between Robo1 and the netrin receptor DCC (Deleted in colorectal cancer) (Dickson and Gilestro, 2006).
Lateral positioning of longitudinal axon fascicles are also determined by Robo homologs. In
Drosophila, loss- and gain-of-function experiments have showed that there are mainly three
longitudinal paths with respect to Robo expression: lateral fascicles express Robo1, Robo2 and Robo3; intermediate fascicles express Robo1 and Robo3; while medial fascicles express only Robo1 (Rajagopalan, Vivancos et al. 2000; Simpson, Bland et al. 2000) (Figure 1.8).
Figure 1.8: A Robo code for lateral positioning in Drosophila. Schematic showing the division of the
longitudinal axon tracts into three major zones, according to the Robo code (Dickson and Gilestro, 2006).
1.2.4.2 Role of Slit2-Robo2 interaction in kidney development
Studies examining SLIT/ROBO signaling during kidney development bring this issue to the fore, with the recent analysis of Slit2-/- mice suggesting a new role for SLIT2 signaling in regulating transcription (Grieshammer, Le et al. 2004). In contrast, efforts to demonstrate an established role for SLIT2 as a branching factor in kidney have been unsuccessful (Piper, Nurcombe et al. 2002).
In the absence of Slit2 and also in Robo2-/- mice multiple ureteric buds form in developing mouse kidney. In Slit2-/- animals Gdnf gene dosage reduction results in rescue of the observed supernumerary bud phenotype. Expression analysis reveals Slit2 transcripts in the nephric duct and in the anterior nephrogenic mesenchyme, where Robo2 is also expressed. In contrast, Gdnf transcripts are expressed throughout the nephrogenic mesenchyme, but over the course of development they become progressively restricted to the posterior region where the ureteric bud forms. In the light of the available data, a model is proposed describing that SLIT2 signals through ROBO2 to suppress supernumerary bud formation (Figure 1.9). These
findings suggest that ROBO mediated signaling may have roles in cell fate specification by regulating transcription or translation of key determinants (Grieshammer, Le et al. 2004; Hinck 2004).
Figure 1.9: SLIT2-ROBO2 signaling is essential for proper kidney development in mice. SLIT2 signaling
through ROBO2, restricts the anterior expression of Gdnf. In the posterior region, lack of ROBO2 prevents SLIT signaling, allowing Gdnf expression and consequently the appropriate outgrowth of the ureteric bud (Hinck L, 2004).
1.2.4.3 Role of Slit-Robo in lung development
Transcripts of Slit2, Slit3, Robo1 and Robo2 are expressed in the lung (Xian, Clark et al. 2001; Anselmo, Dalvin et al. 2003; Greenberg, Thompson et al. 2004). A small cell lung cancer line expresses a mutated Robo1 gene termed Dutt1, for deleted in U2020, which is missing the first immunoglobulin repeat in the extracellular domain (Sundaresan, Chung et al. 1998). Mice engineered to express only Dutt1 frequently die at birth due to respiratory failure, and histological analyses of their lungs reveal abnormally dense mesenchyme, surrounding smaller and irregularly shaped bronchioles (Xian, Clark et al. 2001). Since SLIT-ROBO interaction shown to promote axon branching in the nervous system, possibly these irregularly shaped bronchioles are a result of inappropriate branching (Wang, Brose et al. 1999; Ozdinler and Erzurumlu 2002; Hinck 2004).
1.2.5 Slit-Robo in cancer and other pathologies
1.2.5.1 SLIT-ROBO expression in tumors of various tissues
Although no more than a decade has passed from their discovery, there is mounting evidence on the involvement of SLITs and ROBOs in cancers. So far, no somatic point mutation of ROBO1 (or of its ligands SLITs) was reported in tumors. A targeted mutation of mouse robo1 was generated by deletion of exon 2, mimicking a deletion that naturally occurs in human small cell lung cancer cell line NIH-H219X, and resulted in the removal of Robo1 Ig1. In total, 63% of Robo1-/- homozygous mice die in the first 24 hours because of respiratory failure due to abnormal lung development. A few homozygous mice survive up to 1 year and show epithelial bronchial hyperplasia, but no spontaneous tumor formation was detected. Later on tumor susceptibility of Robo1 heterozygous mice was analyzed. During their second year of life, Robo1 heterozygotes develop lymphoma and carcinomas, such as invasive lung carcinomas. In malignant tumor samples from Robo1+/- mice, the expression of Robo1 is undetectable. Moreover, the study of the remaining allele showed that its promoter is hypermethylated. Overall, these studies support a role for Robo1 as a tumor suppressor gene, at least in the mouse (Xian, Clark et al. 2001; Xian, Aitchison et al. 2004; Chedotal, Kerjan et al. 2005).
The expression of SLIT-ROBO genes are analysed by quantitative RT-PCR in prostate tumor samples. SLIT1 and SLIT3 are found to be overexpressed in prostate tumors (Latil, Chene et al. 2003). SLIT2 is expressed in many tumor cell lines such as human melanoma (A375), bladder squamous carcinoma (SCaBER), neuroblastoma (SK-N-SH), small cell lung cancer (NCI-H446), carcinoma of urinary bladder (T24), colon adenocarcinoma (LoVo), breast cancer (ZR-75-30), nasopharyngeal carcinoma (CNE), hepatocellular carcinoma (SMMC-7721), salivary gland carcinoma (Acc), rhabdomyosarcoma (A673) and primary tumors (melanoma, invasive breast carcinoma, colorectal carcinoma, etc.). SLIT2-ROBO1 signaling increased microvessel density and tumor mass in a xenograft model (Wang, Xiao et al. 2003). Slit2 acts as a potent chemoattractant for breast cancer cells specifically metastasizing to brain suggesting a role for Slit/Robo signaling in brain metastasis. In addition, ROBO1 is overexpressed in breast carcinoma tissue samples (Schmid, Rezniczek et al. 2007).