ORIGINAL PAPER
Climate change impact on rainfall in north-eastern Algeria using
innovative trend analyses (ITA)
Besma Boudiaf1 &ZekaiŞen2,3,5&Hamouda Boutaghane4
Received: 12 June 2020 / Accepted: 23 January 2021 # Saudi Society for Geosciences 2021
Abstract
Climate change impacts affect the hydrological cycle and hence the availability of water resources and their management. Rainfall, the most important hydro-meteorological event and as the main source of water, may have increasing or decreasing trends depending on geography and location, general air circulation, proximity to coastal areas, and geomorphology. There are many studies using monotonic trend analysis in the literature, but it is important to assess these trends at different levels for proper recording. For this purpose, in this paper, instead of using monotonic trend analysis, partial trends will be sought at“Low,” “Medium,” and “High” rainfall records groups, which is possible through the innovative trend analysis (ITA) methodology. Algeria being adjacent to the Mediterranean Sea is impacted by variations in rainfall. The application of the ITA methodology is presented for 16 different Algerian annual rainfall records from 1982 to 2019 in the north-eastern region of the country which is in proximity to the Mediterranean basin. Partially increasing, decreasing, or no trend pieces are identified at each station. It is concluded as the future unfolds some stations will record dry spell or drought dangers for“Low” data groups, and significant flood danger for the“High” rainfall amount data group. In general, the study area is known to be subject to an increasing rainfall trend. This is due to the mountainous terrain in the study area and makes for confrontation with cold air movements from the European continent during winter periods.
Keywords Algeria . Trend . Climate change . Rainfall . High . Medium . Law . Classification
Introduction
The Eastern Mediterranean and the North African areas are considered to be by IPCC (2014) the region’s most vulnerable
to anthropogenic greenhouse gas (GHG) emissions, which will in turn lead to widespread climate change impacts. Numerous studies have mentioned the decrease in rainfall in Maghreb countries Hallouz et al. (2018), Mahe et al. (2013), Meddi et al. (2010). The north Algerian parts are next to the Mediterranean basin, and therefore, subject to these climate change effects. Since 1993 Algeria is incorporated within the United Nations Framework Convention on Climate Change (UNFCCC), and adheres to the UNFCCC commitments to stabilize GHG emissions to prevent anthropogenic interfer-ence within the climate system Sahnoune et al. (2013) .
Algeria has a large coastal area in the Western Mediterranean region subject to climate change impacts: Hadour et al. (2020), Hallouz et al. (2020), Khedimallah et al. (2020), Taïbi et al. (2018), Zeroual et al. (2019), and therefore, needs protection against these hazardous effects such as rainfall reductions, droughts, and floods. Sahnoune et al. (2013) mentioned that Algeria has shown its determina-tion to participate in the internadetermina-tional effort to fight climate change and its potential impacts on water resources, natural ecosystems, and continued economic development. The initial
Responsible Editor: Broder J. Merkel * Besma Boudiaf
1
Soil and Hydraulics laboratory, Engineering Faculty, Hydraulics Department, Badji Mokhtar University, PO Box 12, Annaba, Algeria
2 School of Engineering and Natural Sciences, Civil Engineering
Department, Istanbul Medipol University, Kavacık, 34181 Istanbul, Turkey
3
Climate Change Researches Application and Research Center, (IKLIMER) Kavacık, Istanbul Medipol University,
34181 Istanbul, Turkey
4
Engineering Faculty, Hydraulics Department, Badji Mokhtar University, PO Box 12, Annaba, Algeria
5 Center of Excellence for Climate Change Research/Department of
Meteorology, King Abdulaziz University, PO Box 80234, Jeddah 21589, Saudi Arabia
strategy used to combat climate change is discussed in various project documents for adaptation and mitigation strategies. These national strategies are based primarily on four concepts: institutional strengthening; adaptation to climate change; mit-igation of GHG emissions; and human capacity building Fawzy et al. (2020). Among these strategies, the rainfall trend analysis records have not been closely or monitored for their overall accuracy, which is the main topic of this paper. Chourghal et al. (2016) presented future climate models and showed that under A1B SRES scenario (SRES: Special Report on Emissions Scenarios which published by the IPCC to explore future developments in the global environ-ment with special reference to the production of greenhouse gases and aerosol precursor emissions) an increase in temper-ature throughout the year and a net decrease in precipitation are bound to appear. However, they did not consider taking into account possible trends in the historical record. These records provide a significant preliminary source of information intended to be used for predictive purposes. In this paper, only the rainfall possible trends are searched, especially for better water resources planning purposes. Yamina et al. (2016) presented the effect of climate change on Algerian water resources through streamflow monotonic trend analysis. IPCC (2014) reports indicate that in general, the Mediterranean basin and in particular the North African countries including Algeria are more vulnerable to climate change. Oli Brown (2019) stated that among the continents, Africa in general and North Africa in particular are the regions most exposed to climate change impacts, because within the continent exists the driest and hottest regions of the world. Along the Mediterranean coastal areas, annual rainfall amounts are comparatively very high reaching to 1500 mm/ year in Tunisia and Algeria, whereas it reaches to about 2000 mm/year in Morocco due to the Atlas Mountain. Inside the continent, the amounts are much less than 100 mm.
Numerous studies have been conducted in the northern regions of Algeria regarding precipitation and temperature, but they are concentrated more towards the western regions than in the east. Yamina et al. (2016) analyzed monotonic trends in rainfall and stream flows across the Cheliff basin in northwest Algeria employing Sen (1968) non-parametric trend slope estimator for the extent of tendencies whose sta-tistical significance was measured by the Mann-Kendall (MK) and the Modified Mann-Kendall (MMK) tests: Kendall (1975), Mann (1945), where results indicated statistically sig-nificant monotonic downward trend in the annual rainfall over the entire basin Elouissi et al. (2016).
Over the period 1970–2010 Bessaklia et al. (2018) studied 23 rainfall station records in the extreme North-East of Algeria. They concluded that according to MK test, there is an increasing trend in high precipitation records. Another 5 locations covering the northeast part of the country were stud-ied by Merabti et al. (2017) with the inference that arid and
semi-arid zones have experienced a larger number of drought events, while the humid and sub-humid locations received more precipitation events. Another study of precipitation var-iability on the Massif Forest of Mahouna (Northeastern Algeria) has been presented by Beldjazia Amina (2016) who found strong tendency at the beginning and bit of weakness at the end of the winter and spring seasons.
The most important impacts on potential water resources are across temporal and spatial scales, especially floods, droughts and sea level rise Mimura (2013). Global warming increases evaporation from water surfaces (sea, lake, and riv-er), which end up with more extreme rainfall events in ever increasing or decreasing trend forms depending on the land surface morphology Trenberth (2011). The amount of change in precipitation associated with a specific change in surface temperature is critically important to understanding the global hydrological system and for climate model development and validation Ren et al. (2013).
The objective assessment of climate change impacts is pos-sible by employing trend analyses methodologies, which have been in frequent use for nearly three decades. In the past, hydro-meteorological time series records were considered as stationary without any trend component, often with a season-ality component attached for use in future studies. Trend stud-ies exist in different parts of the world, because of the variety of climate change impacts, search Funk et al. (2015), Ishida et al. (2017), Madsen et al. (2014),Şen (2012). In all these studies, monotonic trends are identified and interpreted for the different study areas.
It is the main purpose of this paper to identify trend features for a set of meteorological station precipitation records in north-east Algeria, which is home to the most climate change within the Mediterranean basin. The records are subjected to innovative trend analysis (ITA) methodologyŞen (2012),Şen (2017) to identify partial rainfall trends, depending on“Low,” “Medium,” and “High” data classifications. Each record pro-vides necessary information on pertinent precautions to take during dry and wet period events, as is necessary to mitigate against droughts and floods. Each class trend components are identified with relevant interpretations.
Study area and data used
Algeria is a semi-arid country located in North Africa which has experienced periods droughts with average temperature increases ranging from 0.65 to 1.45 °C between 1970 and 2004. An average temperature, comparable to the global av-erage, increase observed over the period 1906-2005. Precipitation studies conducted over two separate but overlap-ping time frames, in northern Algeria from 1951 to 1980 and 1961 to 1990 , reveal a succession of alternating excessive and
insufficient precipitation patterns when compared to normal, with higher variability, Nouaceur and Murărescu (2016).
The studies related to the impact change on the North-Eastern part of Algeria are scarce when compared to the other regions, hence comes this study to add a contribution in this field.
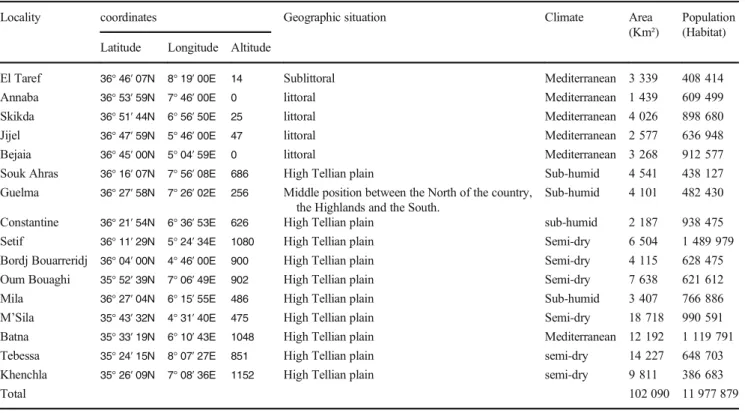
The localities surveyed (Table1) are located in three cli-matic regions. (1) Mediterranean, which is a climate distin-guished by warm, wet winters under prevailing westerly winds with calm, hot, dry summers, Jean-Pierre et al. (2010); (2) sub-humid with mild but cool winters and a slight risk of frost; and (3) a semi-dry zone which is characterized by cool winters and summers with a temperature in the hottest month (July) of 26.8 ° C in Tebessa and Khenchela, with relative humidities not exceeding 38% Benarfa et al. (2008) (Fig.1).
The basic data are obtained from Algerian Meteorological Organization (ONM) and the National Agency for Hydraulic Resources (ANRH). Precipitation data records locations, re-cord duration, and statistical parameter numerical values are available in Table2.
Methodology
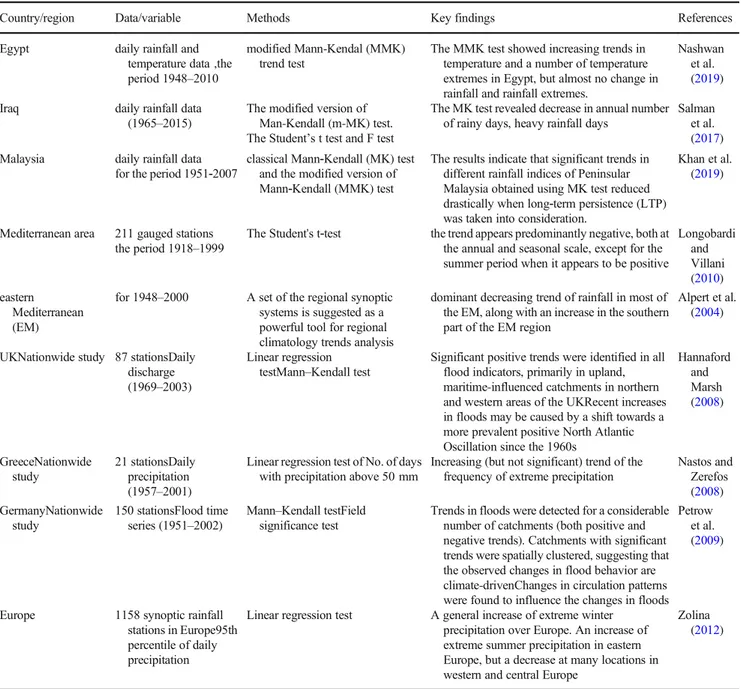
There are various classically established trend identifica-tion tests in the literature and their preliminary explana-tions are useful for understanding them Madsen et al.
(2014); Table3 below shows some previous international studies using trend analysis methods.
In general, these methodologies are divided into two groups as parametric and non-parametric approaches. In this paper,Şen (2012) non-parametric Innovative Trend Analysis (ITA) methodology is applied to each precipitation record series.
Two commonly applied trend tests are Mann–Kendall: Kendall (1975), Mann (1945) and Spearman’s Rho tests, which have been frequently used for trend identification searches in the hydro-climatological time series records. The power of these tests has not been well documented, but the simulation results indicate that the power depends on the pre-assigned significance level, magnitude of trend, sample size, serial correlation coefficient, and the amount of variation with-in a time series Yue et al. (2002). It implies the biggest with- influ-ence coming from the absolute magnitude of the trend, with the tests becoming more powerful as the sample size in-creases. Alternatively, as the amount of variation increases, the power of the tests decreases. The power of this methodol-ogy is also dependent on the probability distribution function (PDF) type. These trend methodologies provide a single and holistic monotonic trend throughout the whole series.
The purpose of the Mann-Kendall (MK) test, Gilbert (1987), Kendall (1975), Mann (1945), is to statistically assess if there is a monotonic upward or downward trend of the variable of interest over time. A monotonic upward (downward) trend means that the variable consistently
Table 1 Localities of the study area
Locality coordinates Geographic situation Climate Area
(Km²)
Population (Habitat) Latitude Longitude Altitude
El Taref 36° 46′ 07N 8° 19′ 00E 14 Sublittoral Mediterranean 3 339 408 414
Annaba 36° 53′ 59N 7° 46′ 00E 0 littoral Mediterranean 1 439 609 499
Skikda 36° 51′ 44N 6° 56′ 50E 25 littoral Mediterranean 4 026 898 680
Jijel 36° 47′ 59N 5° 46′ 00E 47 littoral Mediterranean 2 577 636 948
Bejaia 36° 45′ 00N 5° 04′ 59E 0 littoral Mediterranean 3 268 912 577
Souk Ahras 36° 16′ 07N 7° 56′ 08E 686 High Tellian plain Sub-humid 4 541 438 127
Guelma 36° 27′ 58N 7° 26′ 02E 256 Middle position between the North of the country, the Highlands and the South.
Sub-humid 4 101 482 430
Constantine 36° 21′ 54N 6° 36′ 53E 626 High Tellian plain sub-humid 2 187 938 475
Setif 36° 11′ 29N 5° 24′ 34E 1080 High Tellian plain Semi-dry 6 504 1 489 979
Bordj Bouarreridj 36° 04′ 00N 4° 46′ 00E 900 High Tellian plain Semi-dry 4 115 628 475
Oum Bouaghi 35° 52′ 39N 7° 06′ 49E 902 High Tellian plain Semi-dry 7 638 621 612
Mila 36° 27′ 04N 6° 15′ 55E 486 High Tellian plain Sub-humid 3 407 766 886
M’Sila 35° 43′ 32N 4° 31′ 40E 475 High Tellian plain Semi-dry 18 718 990 591
Batna 35° 33′ 19N 6° 10′ 43E 1048 High Tellian plain Mediterranean 12 192 1 119 791
Tebessa 35° 24′ 15N 8° 07′ 27E 851 High Tellian plain semi-dry 14 227 648 703
Khenchla 35° 26′ 09N 7° 08′ 36E 1152 High Tellian plain semi-dry 9 811 386 683
increases (decreases) through time, but the trend may or may not be linear. The MK test can be used in place of a parametric linear regression analysis, which can be used to test if the slope of the estimated linear regression line is different from zero. The regression analysis requires that the residuals from the fitted regression line be normally distributed; an assump-tion not required by the MK test, that is, the MK test is a non-parametric (distribution-free) test. Hirsch et al. (1982) Esterby (1996) .
The Mann-Kendall trend analysis test is based on some restrictive assumptions such as normality, serial indepen-dence, and rather long sample sizes. They also search for a single monotonic trend without any partial specifications such as“low,” “medium,” or “high” values, which may have dif-ferent trend patterns. It is one of the main purposes of this
study to classify trend components according to“low”, “me-dium” or “high” categories.
Many time series records have serial dependence, and therefore, it is very helpful to provide a methodology, which is not affected by such restriction. In order to avoid such re-strictive assumption, innovative trend analysis (ITA) method-ologyŞen (2012) is used in this paper. Herein, partial form of ITA is considered for finer application studies within the three categories of “Low,” “Medium,” and “High.” data values trend classifications
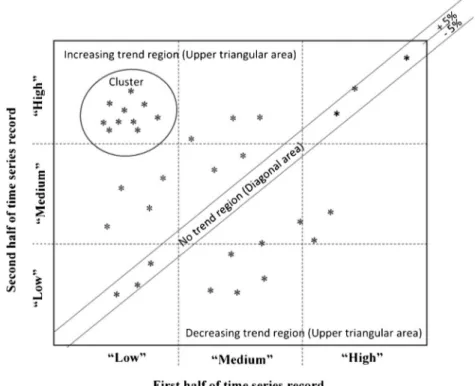
In the ITA methodology, upper and lower triangular areas correspond to trend existence as in Fig.2, where sorted half time series are plotted against each other. In the figure, 1:1 (45o) straight-line implies trendless case. Along the main di-agonal the area between the boundaries at ±5% is for no trend
Table 2 Meteoro logy station characteristics St ati o n n ame S ta tion code R ecor d dura tion (ye ar ) St ar t o f reco rding End o f re cor d ing Missi ng y ears M in value (m m) Ma x value (mm ) Me an Value (mm) Standard Dev iat ion Coe ff ici ent o f variation % El Taref 31717 16 1992 2 008 1995 392.2 1 040.2 729.3 186.2 25.5 Annaba 603600 38 1982 2 019 No gaps 235.2 1 008.5 643.3 161 25.0 Sk ikda 603550 27 1982 2 019 No gaps 342.9 9 64.3 656.2 146.2 22.3 Jijel 603510 38 1982 2 019 No gaps 101.1 1 352.3 850.4 281.5 33.1 Bejaia 604020 38 1982 2 019 No gaps 259.5 1 570.8 745.6 252.8 33.9 So uk Ahras 120101 32 1982 2 013 No gaps 176.7 9 91.3 576.3 183.1 31.8 Guelma 604030 16 2004 2 019 No gaps 346.2 8 69.4 575.5 150.3 26.1 Cons tantine 604190 38 1982 2 019 No gaps 210.1 9 04.2 489.7 159.6 32.6 Mila 100620 26 1978 2 011 1980-1981-1983-1 992-1998-1999-2000-20 03 302.5 9 55.3 580.7 164.9 28.4 Setif 604450 38 1982 2 019 No gaps 118.4 6 14.8 382.3 9 9 25.9 Bordj Bouarreridj 604440 38 1982 2 019 No gaps 104.9 6 55.2 337.3 118.6 35.2 Oum B ouaghi 070707 44 1960 2 012 1962-1966-1977-1 979-1981-1982-1987-19 92-1995 155 5 94.1 390.6 106.4 27.2 Tebessa 604750 38 1982 2 019 No gaps 187.4 6 40 356.7 101.8 28.5 Khench la / 3 4 1970 2 004 No gaps 149.8 7 53.7 413.5 166.5 40.3 Batna 604680 38 1982 2 019 No gaps 106.2 6 10.9 289.3 112.4 38.9 M ’Sila 051005 22 1975 2 004 1993-1994-1995-1 996-1997-1998-2000-20 01 108.4 3 67.1 216.5 58.4 27.0
domain. The scatter points that fall within this area do not contribute to trend, and therefore is referred to as a“no trend area.” This area appears around the main diagonal with slope equal to 1:1 (45o). The upper (lower) triangular area implies increasing (decreasing) trend existence. Additionally, on the same figure, the scatter points can be grouped into“low,” “medium,” and “high” classes Şen (2017).
The scatter points on this template come about after parti-tion of the time series into two halves and then sorting each half in ascending order, and then plotting, first (early) part versus second (late) part. As explained in the ITA template, there are three areas for trend identifications. Such templates,
as the ITA, provide the following important interpretation prior to any quantitative analysis.
& Visual trend inspections under the light of above explanations,
& Identification of “Low,” “Medium,” and “High” data group trend behaviors,
& Comparison of groups with each other for further interpretations,
& Identification of dry or drought cases from the “Low” data group and whether there is an increase or decrease in small data records,
Table 3 International studies using trend analysis methods
Country/region Data/variable Methods Key findings References
Egypt daily rainfall and
temperature data ,the period 1948–2010
modified Mann-Kendal (MMK) trend test
The MMK test showed increasing trends in temperature and a number of temperature extremes in Egypt, but almost no change in rainfall and rainfall extremes.
Nashwan et al. (2019)
Iraq daily rainfall data
(1965–2015) The modified version ofMan-Kendall (m-MK) test. The Student’s t test and F test
The MK test revealed decrease in annual number of rainy days, heavy rainfall days
Salman et al. (2017) Malaysia daily rainfall data
for the period 1951‐2007
classical Mann‐Kendall (MK) test and the modified version of Mann‐Kendall (MMK) test
The results indicate that significant trends in different rainfall indices of Peninsular Malaysia obtained using MK test reduced drastically when long‐term persistence (LTP) was taken into consideration.
Khan et al. (2019)
Mediterranean area 211 gauged stations the period 1918–1999
The Student's t‐test the trend appears predominantly negative, both at the annual and seasonal scale, except for the summer period when it appears to be positive
Longobardi and Villani (2010) eastern Mediterranean (EM)
for 1948–2000 A set of the regional synoptic systems is suggested as a powerful tool for regional climatology trends analysis
dominant decreasing trend of rainfall in most of the EM, along with an increase in the southern part of the EM region
Alpert et al. (2004)
UKNationwide study 87 stationsDaily discharge (1969–2003)
Linear regression testMann–Kendall test
Significant positive trends were identified in all flood indicators, primarily in upland, maritime-influenced catchments in northern and western areas of the UKRecent increases in floods may be caused by a shift towards a more prevalent positive North Atlantic Oscillation since the 1960s
Hannaford and Marsh (2008) GreeceNationwide study 21 stationsDaily precipitation (1957–2001)
Linear regression test of No. of days with precipitation above 50 mm
Increasing (but not significant) trend of the frequency of extreme precipitation
Nastos and Zerefos (2008) GermanyNationwide study 150 stationsFlood time series (1951–2002)
Mann–Kendall testField significance test
Trends in floods were detected for a considerable number of catchments (both positive and negative trends). Catchments with significant trends were spatially clustered, suggesting that the observed changes in flood behavior are climate-drivenChanges in circulation patterns were found to influence the changes in floods
Petrow et al. (2009)
Europe 1158 synoptic rainfall stations in Europe95th percentile of daily precipitation
Linear regression test A general increase of extreme winter precipitation over Europe. An increase of extreme summer precipitation in eastern Europe, but a decrease at many locations in western and central Europe
Zolina (2012)
& Similarly, identification of wet and even flood possibility from the“High” data group trend,
& Apart from the existing trends one may also identify clus-ters without any trend as shown at the upper left-hand side in Fig.3,
& “Medium” trend data values are important for water re-sources management studies.
Figure3provides explanations about different alternatives that may appear on the ITA template. In this figure rather than
a group of points, two points are considered as representative of any data group with trend.
Results and discussion
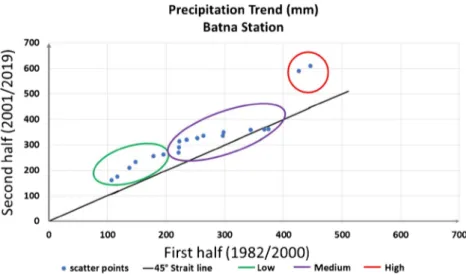
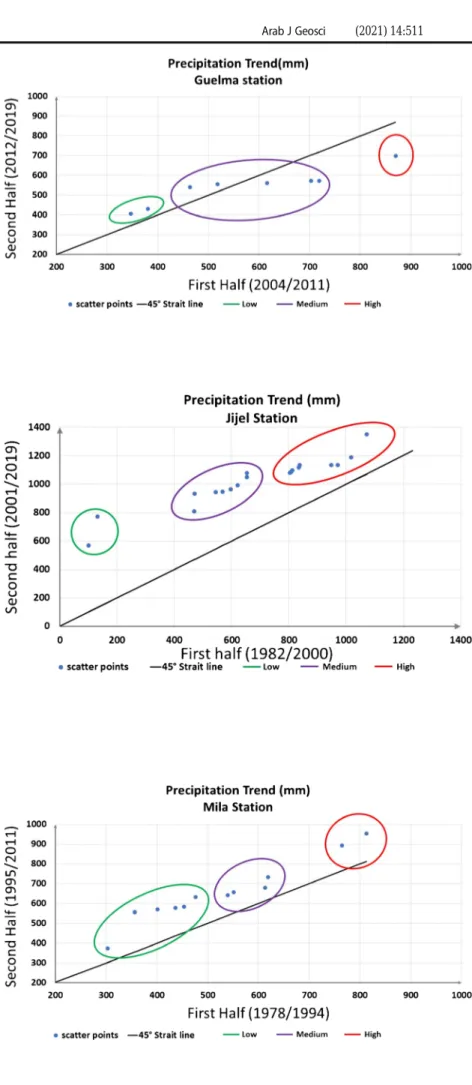
The ITA methodology is applied for each rainfall record series in the study area. Sixteen graphs have been obtained as a result, the elaboration of each single graph would be so long and it may be confusing, based on this, three different“in terms of scatter point distribution” obtained graphs (Figs.4, 5,6) will be discussed in details and should shed light on the subsequent explanations.
The three chosen graphs are shown in Figs.4,5, and6. Each graph will be classified into three groups,“Low” for lower rainfall amounts, “Medium” for the medium, and “High” for the extremes.
Later, via the layout of the scatter point, the trend for each category will be determined. If it is located above the line, the trend would be considered as increasing. Although, if it is below, the trend is decreasing, while the area very close to the line is categorized as the no-trend zone.
Batna
Low: represents 32 % of the entire data series, the scatter point is located above the line indicating an increasing trend. Medium: represents 58% of the whole data series, the onset is above the line then it gradually approaches closer to it, revealing an increasing trend toward no trend.
High: it represents 10% of the data, the scatter point here is well above the line indicating an increasing trend.
Fig. 2 ITA template
Overall, the trend at the Batna station is increasing, indicat-ing that the region is safe from dry spells and drought impacts; however, there is still the possibility of floods occurring. .
Bordj-Bouarreridj
Low: represents 42 % of the entire data series, the scatter point is located above the line indicating an increasing trend. Medium: represents 47% of the entire data series, the lay-out spreading along the no-trend zone.
High: represents 11% of the entire data series, the points being located below the line revealing a decreasing trend.
Overall, Bordj station is receiving more rainfall in the range between 100 and 300 mm and it tends to be more frequent, while rainfall amounts in the range between 300 and 500 mm remain regular, in contrast the days with extreme rainfall tend to decrease which put Bordj station in the safe zone relative to the frequency of floods.
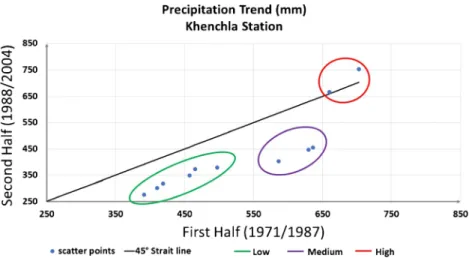
Khenchla
Low: represents 55 % of the entire data series, the scatter point is located below the line indicating a decreasing trend
Medium: represents 27% of the entire data series, the lay-out situated well below the line indicating a decreasing trend
High: represents 18% of the whole data series, the points onset is in the no-trend zone then approaching the increasing trend area.
Overall, there is a decreasing trend in Khanchla’s rainfall with the probability of extreme rainfall occurring.
The obtained figures from the application of the ITA meth-odology to the remaining rainfall time series records will be added as anAppendix, where their interpretation will be sum-marized in Table4. According to the aforementioned signs in columns 2–4 and in the last three columns, the percentages are given for data scatter points that fall within the “Low,” “Medium,” and “High” sub areas in the ITA template.
In this table, the following single and double signs imply the position of various trends within the ITA template: 1) +: implies always an increasing trend in the upper
trian-gular area, which may not be very far away from 1:1 line; 2) ++: implies increasing trend similar to the previous step,
but far away from the no trend line;
3) +-: implies initially increasing (upper triangular area) then onwards decreasing (lower triangular area);
Fig. 4 Batna station precipitation trend
Fig. 5 Bordj-Bouarreridj station precipitation trend
4) -: implies always a decreasing trend in the lower triangu-lar area, which is not very far away from the no trend area; 5) -+: implies initially decreasing (lower triangular area)
then onwards increasing (upper triangular area), 6) o: implies existing only always without trend
7) o+: implies initially no-trend, but onwards with increas-ing trend (upper triangular area),
8) –o: implies initially increasing trend starting from the lower triangular area then onwards without trend area. For the study area, the following useful interpretations can be deduced from Table2 by consideration of the signs and percentages.
A:“Low” data values group
1) In the “Low” group of trends, there is only Khenchla station where there is a continuous decrease (-) in the low data points, and therefore, this station can be consid-ered as a potential location for dry spell and drought ef-fectiveness in the future;
2) Setif station has a decreasing trend (+-) with significant reduction in the low data values;
3) In five stations (El Taref, Bejaia, Souk Ahras, Batna, and M’Sila) increasing trends (+) are present , which implies an increase in the low data values. This further implies these five regions are safe against dry spells and drought impacts;
4) Four of the stations (Skikda, Guelma, Constantine, and Tebessa) are without trend (o) component and they all
Fig. 6 Khenchla station precipitation trend
Table 4 Partial groups of data
trend types and percentages Station name Trend types Trend percentage
“Low” “Medium” “High” “Low” “Medium” “High”
El Taref + -+ ++ 12 38 50 Annaba +o o o- 21 58 21 Skikda o o+ o+ 11 42 47 Jijel ++ ++ ++ 11 42 47 Bejaia + o ++ 26 53 21 Souk Ahras + o+ o+ 25 44 31 Guelma o +- - 25 62 13 Constantine o o+ -- 42 47 11 Setif +- o + 16 74 10 Bordj Bouarreridj +o o - 42 47 11 Oum Bouaghi +o o+ + 9 73 18 Tebessa o o+ o+ 26 48 26 Khenchla - - o+ 55 27 18 Batna + +o + 32 58 10 M’Sila + o - 9 73 18 Arithmetic average 24 52 24 Standard deviation 14 14 14
have more or less similar positions within the no trend band;
5) Jijel station has extremely significant trend (++) in an increasing manner, where there is no expectation for drought events;
6) Overall, the stations have no-trend or increasing trend over the study area where the“Low” rainfall occurrences exist.
B:“Medium” data values group
1) Khenchla station has continuous decrease (-) in the “Medium” rainfall records. This point supports the inter-pretation in the“Low” data group that there is drought expectation in the future;
2) In the Guelma station there is a decreasing trend (+-) that starts from the increasing trend area on the ITA template, but ends in the decreasing area, hence there is a continuous decrease in the “Medium” rainfall value groups;
3) The opposite situation (-+) is valid in El Taref sta-tion, where the trend increase is from the decreasing area towards the increasing area on the ITA template;
4) The trendless (o) cases exist in four stations, namely, Annaba, Bejaie, Setif, and Bordi Bouarreridj);
5) The case of increasing trend starting from the no trend area (o+) occurs at stations Skikda, Souk Ahras, Constantine, Oum Bouaghi and Tebessa stations; 6) Just the opposite (+o) case appears at Batha station, where
decreasing trend ends up inside the no trend area; 7) The overall trend picture at the study area rainfall stations
reflects either stable (no trend) or increasing trend in the “Medium” data value range.
C:“High” data values group
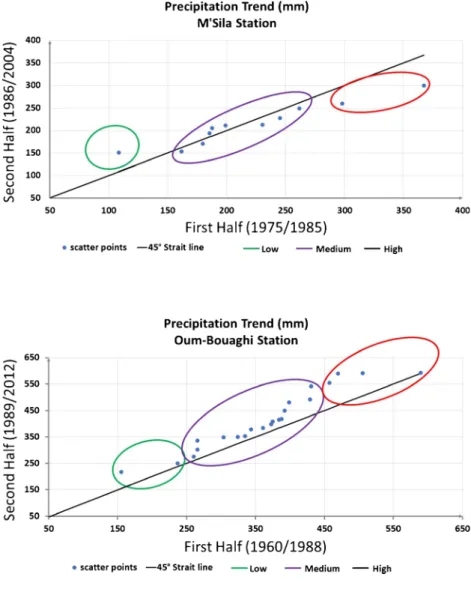
& In the “High” data group, there are three cases with con-tinuous trend decrease (-) Guelma, Bordi Bouarreridj and M’Sila stations;
& Rather mild trend increments (+) appear at stations Setif and Oum Bouaghi, which imply the possibility of some floods at these locations;
& Extremely high rainfall trends (++) are dominant at El Taref and Jijel, Bejaia stations;
& Constantine station “High” rainfall amounts are in contin-uously decreasing trend with no flood danger.
& No trend area origin trend increases (o+) are available at stations, Skikda, Souk Ahras, Tebessa and Khenchla, which also support the idea of flood;
& At Annaba station, the trend starts in the no trend area (o-) and continue towards the decreasing trend area (lower triangular area);
& The overall interpretation for this “High” rainfall amounts group is that there are flood occurrence possibilities at many stations.
In the last three columns in Table 4, data percentages in each group are given for further analysis on the basis of fre-quencies. In the “Low” class, the three stations whose data appear most frequently are in order: Khenchla; Bordj Bouarreridi and Batna. In the“Medium” class: Setif; M’Sila and Guelma stations. In the “High” group, top ranking per-centages are at: El Taref; Skikda and Jijel stations. The arith-metic averages of the percentages show the most frequent data values are confined within the“Medium” group in equal per-centages for the“Low” and “High” classes. The standard de-viation percentages are equal to each other in each class. These points lead to the understanding, for the study area being considered, that “Medium” rainfall amounts are the key group for water resources management studies.
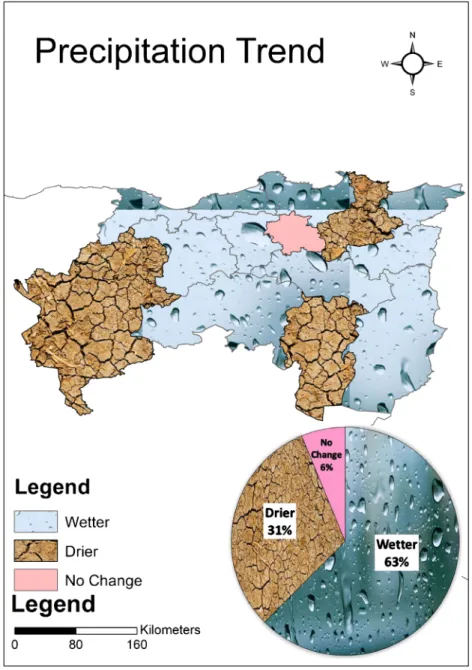
In light of everything discussed above, it is determined there are rainfall increments recorded at many stations, espe-cially at stations within“Medium” and “High” data groups. Apparently, after all trend analyses and interpretations, it be-comes obvious that about 63 % of the study area is bound to become wetter in the near future as shown in Fig.7.
It is also obvious from this figure that the drier precipitation stations share only 31% of the cases, whereas Constantine meteorology station precipitation performance shows no change during the time series, which implies that at this loca-tion there is no significant impact of climate change on pre-cipitation amounts, and hence, the same is expected in the future.
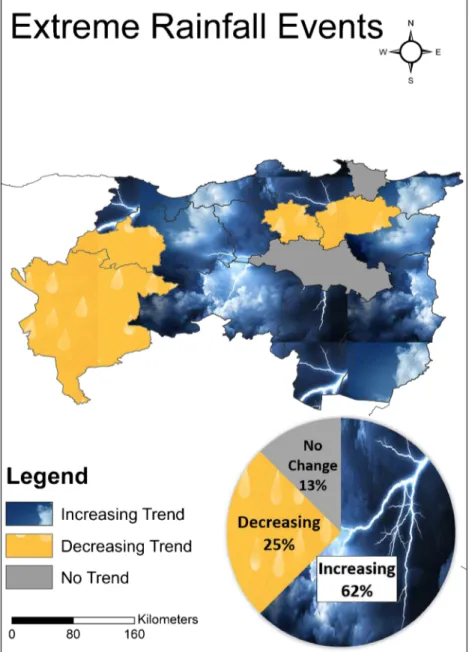
Finally, the map in Fig.8indicates the sub-regions of trend tendencies over the study region. It is obvious from the pie diagram that although 62% of the area is subject to trend increase, only 25% of it is covered by the locations of decreas-ing trend.
Upholding the previous studies, mentioned earlier in the literature review, the north-eastern part of Algeria is under-stood to be experiencing a significantl increasing trend in its precipitation patterns, subsequently it will be subject to recur-ring floods and it will be necessary to reconsider the existing infrastructure and take into account the impact of climate change in all calculations.
Conclusions
The objective of this paper is to detect trends in precipitation records for sixteen stations spread across the North East part of Algeria over a period 35 years (1982–2017) which are experiencing impacts from climate change, using the innova-tive trend analysis (ITA) methodology in partial manner with “low,” “medium,” and “high” precipitation groups.
On the subject of possible droughts, Khenchla station can be considered as a potential location for dry spell and drought conditions in the future. El Taref, Bejaia, Souk Ahras, Batna, and M’Sila present an increasing trend in their low data values which should alternatively mean that they are safe against dry spell and drought impacts. Finally, Jijel shows no expectation for drought event.
The overall interpretation at “High” rainfall amounts occurrence possibilities at many stations: Extremely high rainfall trends dominate at El Taref, Jijel, and Bejaia sta-tions. Constantine station “high” rainfall amounts are in continuously decreasing trend form with no flood danger. Skikda, Souk Ahras, Tebessa and Khenchla support the idea of flood.
In general, 16 meteorology stations are used for ITA tem-plates along with their pie diagrams to obtain percentages of each group. According to the results, about 63% of the study area is bound to get wetter, which implies that dry spell and drought impacts are not expected in the near future.
Clearly, climate change is having an impact over the North East part of Algeria. The majority of provinces will experience an increase in the amount of precipitation, in addition to the appearance of extreme rainfall episodes which can cause seri-ous floods and seriseri-ous damage considering that the urban system is not in line with the such circumstances. The ITA partial trend identification methodology can be applied objec-tively in any area provided that precipitation records are available.
Fig. 7 Precipitation spatial designation according to the obtained results
Appendix
Fig. 8 Extreme rainfall obtained spatial map
Fig. 9 Annaba station precipitation trend
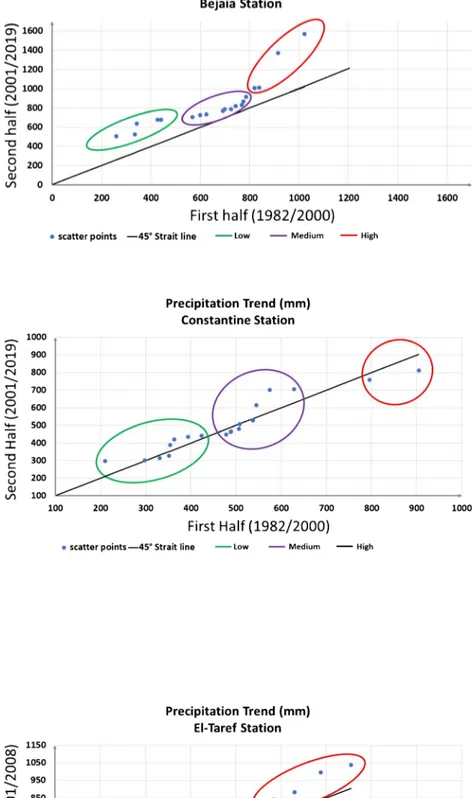
Fig. 10 Bejaia station precipitation trend
Fig. 11 Constantine station precipitation trend
Fig. 12 El Taref station precipitation trend
Fig. 13 Guelma station precipitation trend
Fig. 14 Jijel station precipitation trend
Fig. 15 Mila station precipitation trend
Fig. 16 M’Sila station precipitation trend
Fig. 17 Oum Bouaghi station precipitation trend
Fig. 18 Setif station precipitation trend
Fig. 19 Skikda station precipitation trend
Fig. 20 Souk Ahras station precipitation trend
Fig. 21 Tebessa station precipitation trend
Declarations
Conflict of interest We the authors Besma Boudiaf, ZekaiŞen and Hamouda Boutaghane, declare that we have no conflict of interest.
References
Alpert P, Osetinsky I, Ziv B, Shafir H (2004) Semi-objective classifica-tion for daily synoptic systems: applicaclassifica-tion to the eastern Mediterranean climate change. Int J Climatol 24:1001–1011 Beldjazia Amina AD (2016) Precipitation Variability on the Massif
Forest of Mahouna (North Eastern-Algeria) from 1986 to 2010. Int J Manag Sci Business Res 5(3)
Benarfa N, Louadi K, Maghni N, Aguib S, Terzo M, Berchi S, Benachour K (2008) Les Hyménoptères Apoidea de l’Algérie orientale avec une liste d'espèces et comparaison avec les faunes ouest-paléarctiques. Bulletin de la Société entomologique de France, pp 459-472
Bessaklia H, Ghenim A, Megnounif A, Martin-Vide J (2018) Spatial variability of concentration and aggressiveness of precipitation in North-East of Algeria. J Water a Land Development 36:3–15 Chourghal N, Lhomme P, Huard F, Aidaoui A (2016) Climate change in
Algeria and its impact on durum wheat. Reg Environ Change 16: 1623–1634
Elouissi A,Şen Z, Habi M (2016) Algerian rainfall innovative trend analysis and its implications to Macta watershed. Arab J Geosci 9: 303
Esterby SR (1996) Review of methods for the detection and estimation of trends with emphasis on water quality applications. Hydrol Process 10:127–149
Fawzy S, Osman AI, Doran J, Rooney DW (2020) Strategies for mitiga-tion of climate change: a review. Environ Chem Lett 18:2069–2094 Funk C, Peterson P, Landsfeld M, Pedreros D, Verdin J, Shukla S, Husak G, Rowland J, Harrison L, Hoell A, Michaelsen J (2015) The cli-mate hazards infrared precipitation with stations—a new environ-mental record for monitoring extremes. Scientific Data 2:150066 Gilbert R (1987) O. Statistical Methods for Environmental Pollution
Monitoring, Wiley
Hadour A, Mahe G, Meddi M (2020) Watershed based hydrological evolution under climate change effect: An example from North Western Algeria. J Hydrol Regional Stud 28:100671
Hallouz F, Meddi M, Mahe G, Ali Rahmani S, Karahacane H, Brahimi S (2020) Analysis of meteorological drought sequences at various timescales in semi-arid climate: case of the Cheliff watershed (north-west of Algeria). Arab J Geosci 13:280
Hallouz F, Meddi M, Mahe G, Toumi S, Salah EDDINE AR (2018) Erosion, suspended sediment transport and sedimentation on the Wadi Mina at the Sidi M'Hamed Ben Aouda Dam, Algeria. Water (Switzerland):10
Hannaford J, Marsh TJ (2008) High-flow and flood trends in a network of undisturbed catchments in the UK. Int J Climatol 28:1325–1338 Hirsch RM, Slack JR, Smith RA (1982) Techniques of trend analysis for
monthly water quality data. Water Resour Res 18:107–121 IPCC (2014) Climate Change 2014– Impacts, Adaptation and
Vulnerability: Part A: Global and Sectoral Aspects: Working Group II Contribution to the IPCC Fifth Assessment Report: Volume 1: Global and Sectoral Aspects. Cambridge University Press, Cambridge
Ishida K, Gorguner M, Ercan A, Trinh T, Kavvas ML (2017) Trend analysis of watershed-scale precipitation over Northern California by means of dynamically-downscaled CMIP5 future climate projec-tions. Sci Total Environ 592:12–24
Jean-Pierre L, Philippe G, Mohamed A, Abdelmatif D, Larbi B (2010) Climate evolution and possible effects on surface water resources of North Algeria. Curr Sci 98:1056–1062
Kendall MG (1975) Rank correlation methods. Griffin, London Khan N, HadipouR S, Shahid S, Ismail T, Ahmed K, Chung E-S, Nawaz
N, Wang X (2019) Spatial distribution of secular trends in rainfall indices of peninsular Malaysia in the presence of long-term persis-tence. Meteorol Appl
Khedimallah A, Meddi M, Mahe G (2020) Characterization of the inter-annual variability of precipitation and runoff in the Cheliff and Medjerda basins (Algeria). J Earth Syst Sci 129
Longobardi A, Villani P (2010) Trend analysis of annual and seasonal rainfall time series in the Mediterranean area. Int J Climatol 30: 1538–1546
Madsen H, Lawrence D, Lang M, Martinkova M, Kjeldsen TR (2014) Review of trend analysis and climate change projections of extreme precipitation and floods in Europe. J Hydrol 519:3634–3650 Mahe G, Lienou G, descroix L, Bamba F, Paturel JE, Laraque A, Meddi
M, Habaieb H, Adeaga O, Dieulin C, Chahnez Kotti F, Khomsi K (2013) The rivers of Africa: witness of climate change and human impact on the environment. Hydrol Process 27:2105–2114 Mann HB (1945) Nonparametric Tests Against Trend. Econometrica 13:
245–259
Meddi MM, Assani AA, Meddi H (2010) Temporal Variability of Annual Rainfall in the Macta and Tafna Catchments. Northwestern Algeria Water Resources Manag 24:3817–3833
Merabti, A., Meddi, M., Martins, D. & Pereira, L. 2017. Comparing SPI and RDI Applied at Local Scale as Influenced by Climate. Water Resources Management
Nashwan M, Shahid S, Rahim N (2019) Unidirectional trends in annual and seasonal climate and extremes in Egypt. Theor Appl Climatol 136:457–473
Mimura N (2013) Sea-level rise caused by climate change and its impli-cations for society. Proc Jpn Acad Ser B Phys Biol Sci 89:281–301 Nastos P, Zerefos C (2008) Decadal changes in extreme daily
precipita-tion in Greece. Adv Geosci 16
Nouaceur Z, Murărescu O (2016) Rainfall Variability and Trend Analysis of Annual Rainfall in North Africa. Int J Atmospheric Sci 2016: 7230450
Oli Brown, C. S. E. N. 2019. Climate-Fragility Risk Brief North Africa & Sahel. Available:https://climate-security-expert-network.org/sites/ climate-security-expert-network.com/files/documents/csen_ climate_fragility_risk_brief_-_north_africa_sahel_.pdf.
Petrow T, Zimmer J, Merz B (2009) Changes in the flood hazard in Germany through changing frequency and persistence of circulation patterns. Nat Hazards Earth Syst Sci 9
Ren L, Arkin P, Smith T, Shen S (2013) Global precipitation trends in 1900–2005 from a reconstruction and coupled model simulations. J Geophys Res Atmos 118
Sahnoune F, Belhamel M, Zelmat M, Kerbachi R (2013) Climate Change in Algeria: Vulnerability and Strategy of Mitigation and Adaptation. Energy Procedia 36:1286–1294
Salman S, Shahid S, Ismail T, ABD Rahman N, Wang X, Chung E-S (2017) Unidirectional trends in daily rainfall extremes of Iraq. Theor Appl Climatol
Sen PK (1968) Estimates of the Regression Coefficient Based on Kendall's Tau. J Am Stat Assoc 63:1379–1389
Şen Z (2012) Innovative Trend Analysis Methodology. J Hydrologic Eng 17:1042–1046
Şen, Z. 2017. Innovative Trend Methodologies in Science and Engineering.
Taïbi S, Meddi M, Mahe G (2018) Seasonal rainfall variability in the southern Mediterranean border: Observations, regional model sim-ulations and future climate projections. Atmosfera 32:39–54 Trenberth K (2011) Changes in Precipitation with Climate Change.
Yamina E, Hacene M, Abderrahmane I, Matteus FGA, Ragab R (2016) Evaluating the effects of climate change and variability on water resources: a case study of the Cheliff Basin in Algeria. Am J Eng Appl Sci 9.https://doi.org/10.3844/ajeassp.2016.835.845 Yue S, Pilon P, Cavadias g (2002) Power of the Mann–Kendall and
Spearman's rho tests for detecting monotonic trends in hydrological series. J Hydrol 259:254–271
Zeroual A, Assani AA, Meddi M, Alkama R (2019) Assessment of cli-mate change in Algeria from 1951 to 2098 using the Köppen– Geiger climate classification scheme. Climate Dynam 52:227–243 Zolina O (2012) Changes in intense precipitation in Europe, pp 97–120.