Bayesian Networks: A Tool for Macro-level Analysis
Ahmet Ekici, Bilkent University, Faculty of Business Administration, Ankara, Turkey Şule Önsel Ekici, Doğuş University, Faculty of Engineering, Istanbul, TurkeyThe main objective of this paper is to give a brief introduction of the Bayesian Networks and to illustrate it using one of the major domains of macromarketing: ethics. Bayesian networks allow researchers to analyze a domain from a system perspective. It is considered one of the most powerful tools for observing system changes. The method can also deal with multiple variables at once, which can lead to efficient scenario analyses, critical for understanding how a system functions. We belive that the adaptation of this methodology by the macromar-keting researchers is likely to be beneficial for the theory and practice of macromarmacromar-keting.
Introduction
Macromarketing scholars have long emphasized the importance of systemic/network approaches to business activities: actions cause reactions, which cause further reactions (e,g. Mittelstaedt, Kilbourne, and Mittelstaedt , 2006). At the same time, various scholars have pointed out the lack of (and therefore the need for) appropriate tools for macromarketing analysis. Dixon (2002), for example, calls attention to the certain shortcomings of the exist-ing work in macromarketexist-ing and to need for new methods by statexist-ing:
“The limited outlook of much current work, and the lack of coherence among the in-creasingly narrow threads of thought, reinforces an observation made more than a half century ago: ‘’The multitude of facts thus far assembled seem to add up to very little. One must conclude that something has gone wrong with the method of attack — a new and creative analysis is required’” (Alderson and Cox, 1948, p. 138). (Dixon, 2002).
Similarly, after a review of the knowledge accumulated about the marketing system over the past four decades, Layton (2006) concludes that a great deal has been done studying inputs and outcomes, but relatively little has emerged that looks at the operation of a system. Methods that the macromarketers use should allow a system/network level analysis. Moreo-ver, around the same time, Fiske (2006) points out the need for developing methods appro-priate for (network level) macromarketing analysis.
As evident from these scholars’ calls, there is a need for the use of network/system methods in macromarketing. The objective of this paper is to introduce one such method: Bayesian networks (BN). This method allows researchers to analyze a domain from a system perspective. In addition, Bayesian network (BN) method is considered one of the most pow-erful tools for observing system changes. The method can also deal with multiple variables at once, which can lead to efficient scenario analyses, critical for understanding how a system functions. In the following sections, we first provide brief information about the characteris-tics and the mechanics of the BN methodology and then illustrate it using one of the major domains of macromarketing: ethics.
Bayesian networks, as one of the most commonly used probabilistic models, are espe-cially useful in modeling uncertainty in a domain and have been applied particularly to prob-lems that require diagnosis based on a variety of types of input data in a system of variables (Nicholson et al. 2008). It is a graphical model that efficiently encodes the joint probability distribution for a large set of variables (Heckermann 1995)
Bayesian network theory is well established, and the method has been applied with success in various domains of business and economics (Ahn and Ezawa 1997; Scuderi and Clifton 2005; Cinicioglu et al. 2007; Fusco 2008; Jensen et al. 2009), medicine (Nicholson et al. 2008), ecology and environmental issues (Bromley et al. 2005), and transportation (Cinicioglu et al. 2012). A detailed analysis of the BN-model literature can be found in Korb and Nicholson (2011).
Advantages of BN Over Other Tools for Macro-level Analysis
There exists a growing interest for BN because of its semantic clarity and under-standability, its ease of acquisition and incorporation of prior knowledge, and the ease of in-tegration with optimal decision-making models (Friedman et al. 1997). There are many rea-sons for the BN method’s popularity in literature:
(1) Compared to standard regression models, in which the correlation between the variables leads to multicollinearity and lack of robustness of model fitting, BNs leverage on the mutual correlation between variables to define the conditional probability distribution (Sebastiani and Perls, 2008).
(2) They not only provide a clear graphical structure that most people find intuitive to understand but also make it possible to conduct flexible inference based on partial observa-tions which allows for reasoning (Onisko, 2008).
(3) BN can identify and analyze the relationships between the variables of the model not by depending on a single output variable or a predetermined assumption but rather, it uses conditional dependency relations in an interconnected system of variables (Cinicioğlu et al, 2013).
(4) They allow their user to engage in probabilistic analyses of much higher com-plexity than what would be possible through traditional approaches that mostly rely on rigid, purely arithmetic development (Biedermann et al., 2008).
(5) BNs enforce explicit considerate of the logic and assumptions in making man-agement recommendations under uncertainty (Steventon, 2008)
(6) BNs provide predictions described in terms of probabilities and percents which help to conduct effective analysis included prediction and diagnostics of observed variables in a system (Anderson and Vastag, 2004). Methods for the analysis which force the selection of one or more dependent variables and limit the estimation for these variables only deterio-rate both the quality of the model and also validity of the findings (Cinicioglu et al, 2012).
(7) Compared to structural equation models (SEM) that attempt to model determinis-tic relationships between cause and effect (with error terms which are usually assumed to be independent and normally distributed), Bayesian networks seek to represent the probability
distribution of the variables in question (Clarke et al., 2013). As a result, BNs are the ideal candidates for the analysis of networks since BN uses the probabilistic dependency structure of the network, all of the variables in the model can be estimated.
(8) BN can handle non-linear relations between variables which is not possible with regression or SEM (Anderson and Vastag, 2004). BNs are undeniably more powerful than deterministic ones in the sense that they are more appropriate representations of reality (Pour-ret O, 2008).
(9) Performing what-if queries is easy to conduct and understand (Lauria & Duchess, 2006). Such queries may include diagnostic reasoning (i.e., reasoning “upwards” from effects to cause), predictive reasoning (i.e., reasoning “downwards” from cause to effect), or inter-causal reasoning (e.g. given two mutually exclusive causes, evidence on one of them “ex-plains away” the other one). When used in this way, BNs can be thought of as powerful prob-abilistic inference engines.
(10) BNs can estimate the values of all variables in a network, while for-example structural equation models limit estimation to just dependent variables (Lauria and Duchessi, 2007). In fact, for a given network, by applying the rules of Bayesian inference, BNs can propagate the impact of changing one or more variable values on one or more of the remain-ing variables that comprise the network, estimatremain-ing those variables’ values and providremain-ing the associated probabilities.
(11) BNs are nonparametric models; thus, no functional form or variable distribution assumptions are necessary for probabilistic inference. Results are valid for nonlinear func-tions and for any probability distribution of disturbances. (Blodgett and Anderson, 2000)
(12) BNs do not include latent variables; therefore, all probabilistic inference is con-ducted at the observed level. SEMs, however, assume that each observed measurement is caused by latent variables. Thus, prediction based on observed measurements is not possible (Blodgett and Anderson, 2000).
Bayesian Network Structure
A Bayesian network is a directed acyclic graph where the nodes represent variables and the directed arcs define statistical relationships (Fenton et al. 2010). The graphs are rep-resentations of joint probability distributions (Korb and Nicholson 2011). If there is a di-rected arc from a variable X1 to a variable X2, the arc indicates that a value taken by X2 de-pends on the value taken by X1, or X1 ‘influences’ X2. X1 is called the parent of X2 and X2 the child of X1. Nodes without parents are defined through their prior probability distribu-tions. Nodes with parents are defined through conditional probability distribudistribu-tions. Condi-tional independence relationships are implicit in the directed acyclic graph: all nodes are con-ditionally independent of their ancestors given their parents.
Consider a BN containing n nodes, namely, X1 to Xn. A particular value in the joint distribution is represented by P(X1 = x1, X2 = x2, …, Xn = xn). The chain rule of probability theory allows factorizing joint probabilities, as given in the following formula. By this formu-la, the answer that the system will give under some certain probability states can be calculat-ed.
∏
− − = ⋅ ⋅ ⋅ = = = = = i i i n n n n n x x x P x x x P x x P x P x x x P x X x X x X P ) ,..., / ( ) ,..., | ( ... ) | ( ) ( ) ,...., , ( ) ,...., , ( 1 1 1 1 1 2 1 2 1 2 2 1 1 The structure of a BN implies that the value of a particular node is conditional only on the values of its parent nodes, so the formula becomes:∏
= i i i n P x Parents x x x x P( 1, 2,...., ) ( / ( ))The Stages of Bayesian Network Construction
Bayesian networks are constructed in an iterative multi-stage process (Dambacher et al. 2007). In the first stage, the analyst identifies the important variables (nodes).This stage is usually based on existing literature (Mase 2008; Dogan 2012), expert consultation (Stamelos et al. 2003; Nadkarni and Shenoy 2004; Cinicioglu 2012), and/or the analyst’s experience (Lin and Haug 2008). The literature does not favor any of the mentioned variable selection methods, accepting all three as legitimate. Expert judgement can be elicited in two ways: In structured methods, concepts in the maps are defined a priori by the modelers and are im-posed on the experts (Nadkarni and Shenoy, 2004). In unstructured methods, concepts emerge from the data or from the expert’s narrative.
In the second stage, the network structure must be constructed. This step includes cap-turing qualitative relationships between variables. There are three approaches used in the lit-erature to build a BN (Lin and Haug 2008). The first one is ‘all human-composed,’ in which human experts provide the nodes, arcs, and conditional probabilities. As the complexity of the network increases, this process can become very demanding and time consuming. The second approach combines a ‘human-composed structure and machine-learned parameters,’ in which human experts provide the causal relationships, the network structure is designed using this information, and the parameters can be learned from the data. The third approach, used in this study, can be called an ‘all machine-learned’ approach, and the network structure can be learned from data and the parameters. The third approach is particularly useful when there is no domain expert available to provide the structure or the probabilities, when the problem is too complex to be solved entirely by hand, or when the domain expert’s time is limited. In addition, this approach considers each theoretically possible configuration of the variables (Pourret 2008). In this type of BN, because domain experts are not involved in the construction of the network model, the arcs and their directions show conditional dependency relations rather than direct causality between parent and child nodes.
After specifying the structure of the net, the next step is to quantify the relationships between connected nodes, which is done by specifying a conditional probability distribution for each node (Korb and Nicholson 2011). Initially, all possible combinations of the values of the parent nodes must be examined (called ‘instantiation’). Then, for each distinct instantia-tion of parent node values, the probability that the child will take each of its values must be specified.
Illustration of the BN Method in The Context of Ethics (Bribery)
After explaining the mechanics and the stages of the BN methodology, in this section, we aim to illustrate how it actually works in the context of bribery. Corruption and bribery
has been identified as one of the most important barriers to worldwide economic develop-ment, growth, and ultimately well-being of societies (e.g. Gray and Kaufman 1998; Hotch-kiss 1998). Despite countless attempts to understand its antecedents and consequences, the problem of bribery persists. As suggested (but almost never executed) by many scholars (e.g. Argondona 2007; Cleveland et al. 2010), understanding bribery from a system perspective can be an important step toward minimizing it globally.
In this example, a host of political, legal, competitive, and other structural (e.g. mar-ket structure, crime and violence, financial system) factors in relation to bribery is investigat-ed by BN methodology. Using the World Economic Forum (WEF) data, we delineate a “sys-tem” of bribery in business transactions. Initially, the factors that are related to “Irregular Payments and Bribes” variable were determined by a panel of business ethics experts. As a second step, a BN is developed through structural learning using the tool WinMine [Hecker-man et al., 2000]. In the last step, a number of sensitivity analyses are conducted in order to help to macromarketers and the policy makers in their attempts to understand and reduce bribery activities in their countries.
Identification of Variables
In order to determine the variables that are related to “Irregular Payments and Bribes” variable, a survey has been conducted using a panel of business ethics experts. More specifi-cally, seven academics who have expertise on business ethics were given a list of 20 concepts of the first pillar of the Global Competitiveness Index-GCI, namely ‘‘institutions’’ and were asked to choose the concepts that they thought were related to Irregular Payments and Bribes (IPAB) in a given country. The common characteristic of the expert panel members is that they either teach undergraduate and/or graduate levels business/marketing ethics courses and/or publish regularly in major marketing and business journals publishing business ethics papers (such as the Journal of Business Ethics, Journal of Macromarketing, and Journal of
Public Policy and Marketing).
The majority of the group (6 from 7 experts) decided that the following 7 factors are related to Irregular Payments and Bribes (IPAB) in a given country:
Diversion of public funds (DPF) Public trust of politicians (PTP)
Favoritism in decisions of government officials (FDGO) Burden of government regulation (BGR)
Business costs of organized crime (BCOC) Reliability of police services (RPS)
Intensity of local competition (ILC)
The data related to these 8 variables are gathered from the last three years of WEF Competitiveness Reports. The countries analyzed by WEF differ slightly and the total num-ber of countries in the last three years, that is used also in this study is 148.
Determining the Network Structure
In the second stage of the proposed methodology, so as to determine and analyze the relationships between bribery activities and other political, legal and competitive factors; a network model is constructed using BN.
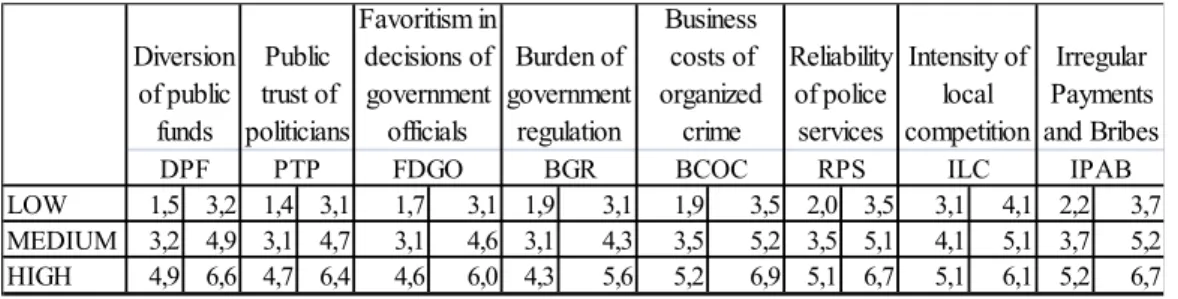
In order to identify the BN from data, the data were first transformed into a form where the ratings of each 8 variable are classified into 3 main probability states as low, mid-dle and high each having a different width of range. The reason of the different ranges in the-se states is becauthe-se of each variable’s having different minimum and maximum values. While doing this transformation, also called as discretizing, the difference between maximum and minimum values for each variable has been calculated and the related range has been divided to 3 intervals resulting in 3 states of the discrete version of the variable (Table 1).
Table 1. State Intervals of Variables
After determining the possible states for each variable; WinMine (Heckerman et al., 2000), a tool developed by Microsoft Research, was used to identify BN that represents the dependency relations of fundamental factors of irregular payments and bribe.
Using WinMine, the data first divided into two parts: 80% for training and the re-maining 20% for testing purposes. The value for kappa, which determines the granularity of the learned network, was set to 1 which helps to obtain a dense network representing the complete dependency structure between the variables. The related BN is given in Figure 4.
Figure 4. The BN of the system
As to evaluate the accuracy of the learned BN model, the log-score value is calculat-ed. Log-score is a quantitative criterion which evaluates how the provided model learned from the training data performs on the test set. The formula for the log score is given above where n is the number of variables and N is the number of cases in the test set.
nN el x p x x Score N i i N) log ( |mod ))/ ,..., ( 1 2 1
∑
= = LOW 1,5 3,2 1,4 3,1 1,7 3,1 1,9 3,1 1,9 3,5 2,0 3,5 3,1 4,1 2,2 3,7 1,0 3,0 MEDIUM 3,2 4,9 3,1 4,7 3,1 4,6 3,1 4,3 3,5 5,2 3,5 5,1 4,1 5,1 3,7 5,2 3,0 5,0 HIGH 4,9 6,6 4,7 6,4 4,6 6,0 4,3 5,6 5,2 6,9 5,1 6,7 5,1 6,1 5,2 6,7 5,0 7,0 Country ClusterBCOC RPS ILC IPAB
Public trust of politicians Diversion of public funds DPF PTP FDGO BGR Irregular Payments and Bribes Intensity of local competition Reliability of police services Business costs of organized crime Burden of government regulation Favoritism in decisions of government officials
The provided model resulted in a log score of -0,5388, meaning on average, the log probability that each variable assigns to the given value in the test case, given the value of other variables, is 68,83%. By using WinMine, also the lift over the marginal value can be found, which is the difference between the log scores of the provided model and the marginal model. A positive difference indicates that the model outperforms the marginal model on the test set. Accordingly, the lift over marginal value obtained by the proposed model is 0,44278, meaning that the predictive capacity of the provided model is about 18,19% better than the marginal model.
Analyzing the Bayesian Network
Once a Bayesian network is constructed, it can be used to make inferences about the variables in the model (Nadkarni and Shenoy, 2004). In order to make these inferences, in the last step of the methodology, the BN that was structured in the second step was created again using the Netica software this time. By doing so, entering evidence for variables and observ-ing the resultobserv-ing changes in the system is made possible. BNs can also deal with multiple variables at a time which can lead to efficient scenario analysis (Antony, 2006).
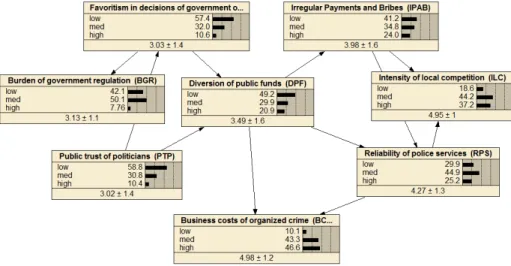
The BN created using the Netica software and the marginal probabilities of the varia-bles in the network can be seen in Error! Reference source not found.. The model consists of
hree components: a set of nodes, representing the variables of the bribery system; a set of links that represent the conditional dependence relationship between these nodes and finally a set of probabilities representing the belief that a node will be in a given state, given the states of the connecting nodes.
Figure 2. The BN of the system with the marginal probabilities of the variables
The overall results suggest that the executives around the world believe that irregular payments and bribes (IPAB) are common practice (the percentage of countries having a per-formance score between 2.2-3.7 is 41.2%) in the world and various structural factors are re-lated to the bribing activities in business transactions. Similarly, favoritism in decisions of government officials (FDGO) is also a common practice with a 57.4%.
After constructing BN, sensitivity analysis can be conducted by which the (parent) variables with the most explanatory power on another (child) variable are identified. The sen-sitivity analysis in BNs is done by calculating the “variance reduction” for each variable. Variance reduction is the expected reduction in the variance of the output variable (Q) due to the value of an input variable (F). The nodes are quantitative and have an initial distribution. When information is supplied about the state of an input node, the output node distribution may shrink towards more probable values, reducing its variance (Nash et al. 2013). In other words, variance reduction is the difference between the variance of the output node (var(Q)) and the variance of the output node given the input node (Var(Q|F)).The variable with the greatest variance reduction rate is expected to be the one to most change the beliefs of the observed variable, hence, it has the highest explanatory power over the output variable.
The analysis conducted on “Irregular payments and bribes” variable shows that the changes on the level of this variable can be mostly explained by the level of “diversion of public funds” variable (67%). In other words, it can be said that, the uncertainty on the level of IPAB for a country can be eliminated by 67% if the level of “DPF is known. “Reliability of police services” variables is the second most influencing variable on IPAB with a variance reduction of 60%.
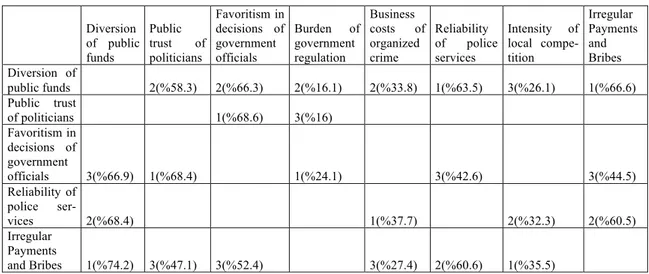
The results of the sensitivity analysis (i.e. identifying factors that have the highest ex-planatory power) on each variable and percent variance reduction information are given in Table 2.
Table 2. The BN of the system
Diversion of public funds Public trust of politicians Favoritism in decisions of government officials Burden of government regulation Business costs of organized crime Reliability of police services Intensity of local compe-tition Irregular Payments and Bribes Diversion of public funds 2(%58.3) 2(%66.3) 2(%16.1) 2(%33.8) 1(%63.5) 3(%26.1) 1(%66.6) Public trust of politicians 1(%68.6) 3(%16) Favoritism in decisions of government officials 3(%66.9) 1(%68.4) 1(%24.1) 3(%42.6) 3(%44.5) Reliability of police ser-vices 2(%68.4) 1(%37.7) 2(%32.3) 2(%60.5) Irregular Payments and Bribes 1(%74.2) 3(%47.1) 3(%52.4) 3(%27.4) 2(%60.6) 1(%35.5)
The columns of the table give us the information about the most influencing variables (the influence rank along with the variance reduction percentage value) of the related varia-ble. When the table is analyzed, it can be seen that the most important variables are “Diver-sion of public funds”, “Favoritism in deci“Diver-sions of government officials” and “Irregular Pay-ments and Bribes”. Thus, the level of bribery systems of countries can be explained by the level of these three variables. So the politicians trying to solve the bribery problem in a coun-try have to focus on decreasing the corruption through the diversion of public funds to com-panies, individuals, or groups and they have to prevent showing favoritism to well-connected firms and individuals when deciding upon policies and contracts. An increase in the perfor-mance of just these two variables can leverage the country’s perforperfor-mance in bribery.