TARIM BILIMLERI DERGISI 1999, 5 (1), 66-70
Prediction of Chlorophyll a in Kurtbo'ğ
azı
and Çaml
ı
dere Reservoirs
Nilsun DEMIR Handan ÇAMDEVIREN 2 Sıddık KESKIN 2
Geliş Tarihi : 16.11.1998
Abstract The relationships between chlorophyll a and some physical and chemical properties of water were investigated by using multiple linear and nonlinear regression models in Kurtboğazı and Çamlıdere reservoirs With these two different approaches chlorophyll a was aimed to be estimate more accurately.
The determination coefficients were found as 95% and 82% for multiple linear regression models while 85`)/0 and 7 O % for nonlinear regression models for Kurtboğazı and Çamlıdere reservoirs, respectively.
Key Words: Chlorophyll a, reservoir, multiple regression, nonlinear model
Kurtbo
ğ
az
ı
ve Çaml
ı
dere Barajlar
ı
nda Klorofil a' n
ı
n Tahmini
Özet : Kurtboğazı ve Çamlıdere barajlan içirı kurulan çoklu doğrusal ve doğrusal olmayan regresyon modeilerinden yararlanılarak, suyun bazı fiziksel ve kimyasal parametreleri ile klorofil a arasındaki ilişkiler değerlendirilmiştir Bu iki farklı yaklaşımdaki amaç klorofil a'nın güvenilir bir şekilde tahmin edilmesidir.
Belirleme katsayıları Kurtboğazı ve Çamlıdere baraj gölleri için, doğrusal çoklu regresyon modelinde sırasıyla %95 ve Ü/o 8 2 olarak bulunurken, doğrusal olmayan regresyon modellerinde %85 ve %70 olarak bulunmuştur.
Anahtar Kelimeler : Klorofil a, baraj, çoklu regresyon, doğrusal olmayan model
Introduction
The strong relationships betweerı physical, chemical
parameters and organic matter in water environment were used for the estimation of biomass and nutrients in fest decades. Models improved in these studies were classified as;
a- Simple linear and nonlinear regression models, b- Multiple linear and nonlinear regression models, c- Path analysis.
Most of these studies incorporated the use of sirripie linear and nonlinear regression models. Chlorophyll a, total phosphorus, Secchi depth were selected as dependent variable ( Dillon and Rigler, 1974; Seip et al., 1992; Mazumder, 1994a; Mazumder, 1994b; Zakova et al., 1993; Komarkova and Hejzlar, 1996). There are a few studies in which multiple linear regression, nonlinear regression models and path analysis were used (Brezonik, 1978; Hoyer and Jones, 1983; Vezina and Pace, 1994).
Multiple regression model was preferred to simple regression model in this study, because . multiple regression model describes the variation better while maintaining all linear and nonlinear direct effects.
Some model studies were performed for water sources of Turkey (Curi ve Tanyeri, 1974; Gökkurt, 1989;
Pulatsü et al., 1997). Limnefogical properties of Çamlıdere
and Kurtboğazı reservoirs were investigated by Bakan
(1997). This will be the first model for a reservoir in Turkey.
The aim of this study is to improve models which describe variation on the chorophyll a and to determine
complex relationships between parameters in Kurtboğazı
and Çamlıdere reservoirs.
Material and Method
Çamlidere reservoir situated 60 km southwest of
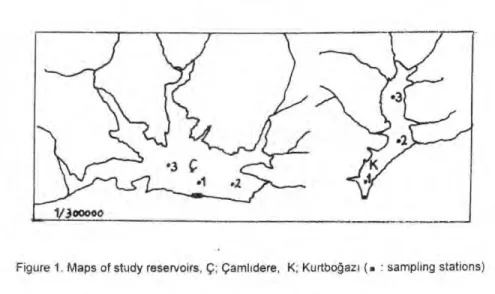
Ankara. The reservoir has a surface area of 32 km2 . In the reservoir, three stations were sampled. Station 1, located approximately 100 m distance from the dam, station 2 and station 3 located in the same distance east and west of station 1 (Fig. 1).
Universite of Ankara, Faculty of Agriculture Dep. of Fisheries and Aquaculture-Ankara Unıversıte of Ankara, Faculty of Agriculture Dep. of Animal Science-Ankara
DEMIR, N. et al. "Prediction of chicrophyll a in Kurtboğazı and Çamlıdere reservoırs" 67
Figure 1. Maps of study reservoirs, Ç; Çamlıdere, K; Kurtboğazı : sampling stations)
Kurtboğazı reservoir is situated 56 km west of Ankara in central Anatolie. The surface area of the reservoir is 5.5 km2. In the reservoir, three stations were sampled. Station 1 located approximately 100 m distance from the dam, station 2 located in middle part of the reservoir and station 3 located in the northern part of the reservoir (Fig. 1).
Kurtboğazı and Çamlıdere reservoirs were sampled
monthiy from June 1995 to May 1996. Water temperature (T), electrical conductivity (EC), Secchi depth (SD), pH and dissolved oxygen (DO) were measured in situ. In addition, organic matter (0M), alkalinity (Alk), total hardness (H), calcium (Ca)and magnesium (Mg) hardness, nitrite-nitrogen (NO2-N ), nitrate-nitrogen (NO3- ammonia-nitrogen (NH3-N), orthophosphate (ORTO) and total phosphorus (TP) were determined according to APHA (1975).
Phytoplankton (Phyto) and zooplankton (Zoo) samples were counted using an inverted microscope
according to Lund et al. (1958) and Wetzel and Likrıs
(1991). Chlorophyll a was determined according to Strickland and Parsons (1972).
Multiple linear regression equations were performed for each reservoir according to Draper and Smith (1980). Chlorophyll a is an important indicator of water quality. Because of this it was selected as dependent variable. 24 observations from each reservoir were used for models. The stepwise variable elimination method was used for selection of independent variables. The possibility of autocorrelation was analysed with Durbin-Watson test. Cook Di (i=1,...,24) and Mahalonobis Distance tests (MDi, i=1,,..,24) were also used to find out whether the outlier and influenced observations existed. VIF statistics were used for controlling highly correlated independent variables selected for models (multicollinearity).
Nonlinear regression equations were performed for each reservoir (Draper and Smith, 1980). The relationships between independent variables and chlorophyll a were plotted prior to constructing nonlinear models. Then, Quasi and Simplex estimation method was used for obtaining the coefficients of nonlinear equations and the suitable coefficients were selected as a result of iterations. The coefficients were controlled by loss function and included to the model when loss function was minimum iteration step.
Statistical analyses were carried out with Minitab (ver. 10.5) and Statistica for windows (ver. 5.0).
Results and Discussion
Multiple linear regression models
The data from Kurtboğazı reservoir were anaiysed
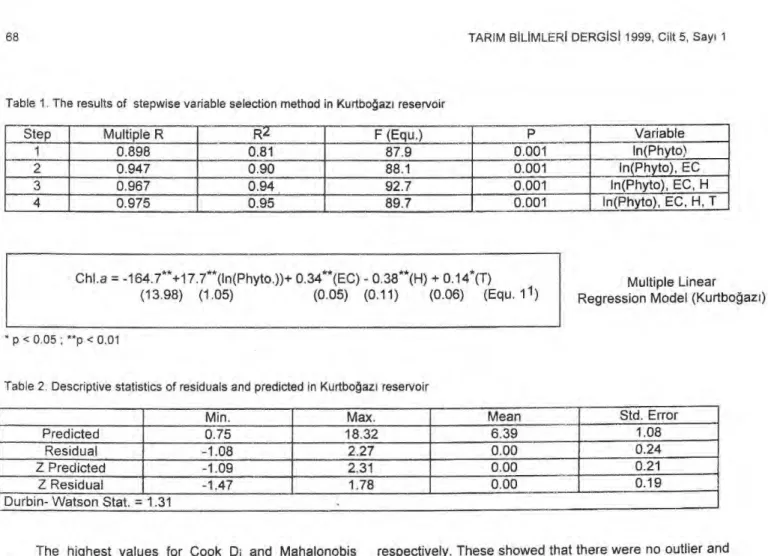
by stepwise variable selection method with four variables selected for multiple regression analysis (Table 1).
In(Phyto), EC, H and T were selected between the seventeen independent variables. Then, the multiple regression equation was developed to predict chlorophyll a (Equ. 11 )
After the hypothesis control, all the coefficients giyen in the regression equation were found significant (p <0.01). The standard error of the equation and determination coefficient were 1.28 and 95`)/0 respectively.
Durbin-Watson test (D=1.31) showed that there was no autocorrelation. Descriptive statistics of the residuals were analysed (Table 2). The minimum, maximum, mean and standard deviation of the residuals were found low and they showed the reliability of the model.
68 TARIM BILIMLERI DERGISI 1999, Cilt 5, Sayı 1
Table 1. The results of stepwise variable selection method in Kurtboğazı reservoir
Step Multiple R R F (Equ.) P Variable
1 0.898 0.81 87.9 0.001 In(Phyto)
2 0.947 0.90 88.1 0.001 In(Phyto), EC
3 0 967 0.94 92.7 0.001 In(Phyto), EC, H
0.975 0.95 89.7 0.001 In(Phyto), EC, H, T
Chl.a = -164.7**+17.7**(In(Phyto.))+ 0.34**(EC) - 0.38**(H) + 0.14*(T)
(13.98) (1.05) (0.05) (0.11) (0.06) (Equ, Regression Model (KurtboğMultiple Linear azı)
p < 0 05 ; **p < 0.01
Table 2. Descriptive statistics of residuals and predicted in Kurtboğazı reservoir
Min Max. Mean Std. Error
Predicted 0.75 18.32 6.39 1.08
Residuel -1.08 2.27 0.00 0.24
Z Predicted -1.09 2.31 0.00 0.21
Z Residuel -1.47 1.78 0.00 0.19
Durbin- Watson Stat. = 1.31 •
The highest values for Cook Di and Mahalonobis distance were found as 0.79 and 9.17 respectively. These showed that there were no outlier and influenced observations. Also, multicollinearity was not found (Variance influence factor = VIF < 10) between independent variables (Table 3). Because of these reasons, linear multiple regression equation was found
suitable for the estimation of chlorophyll a in Kurtboğazı
reservoir according to Draper and Smith (1980).
The data from Çamlıdere reservoir were analysed
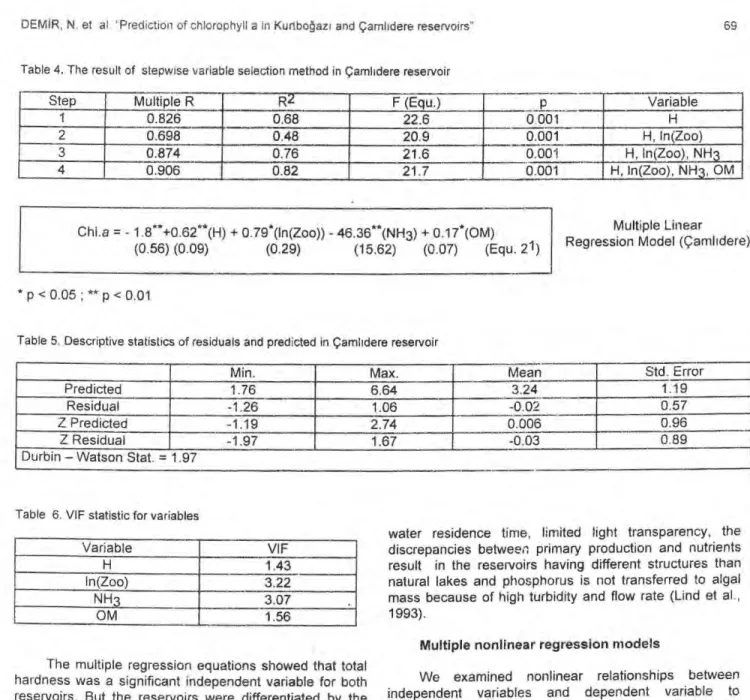
with Stepwise variable selection method with four variables selected for multiple regression analysis (Table4).
In(Zoo), H, NH3-N and OM were selected between the total 17 independent variables, Then, the multiple regression equation was developed to predict chlorophyll a ( Equ. 21).
After the hypothesis control, all the coeffıcients giyen
in the regression equation were found signifıcant (p <
0.01). The standard error and determination coeffıcient of
the equation were 0.64 and 82% respectively.
Durbin-Watson test (D=1.97) showed that there was no autocorrelation. The highest values for Cook Di and Mahalonobis distance were found as 0.41 and 9.40
respectively. These showed that there were no outlier and influenced observations (Table 5).
The variance influence factor was calculated for each variable showed that multicollinearity among independent variables were not found (Table 6). For these reasons linear multiple regression equation was found
suitable for the estimation of chlorophyll a in Çamlıdere
reservoir.
The multiple regression equations showed that total hardness was a significant independent variable for both reservoirs. But the reservoirs were differentiated by the other variables. While In(Phyto), EC and T were important
in Kurtboğazı, In(Zoo), NH3-N and OM were important in
Çamlıdere reservoir. These two reservoirs were different
from the point of trophic level and water quality.
Kurtboğazı reservoir was classified as eutrophic while
Çamlıdere reservoir as mesotrophic according to Secchi depth (USEPA, 1974).
Table 3. VIF statistic for variables
Variable VIF
In(Phyto) 1.24
EC 1.58
H 1.03
1.57
DEMIR, N. et al. "Prediction of chlorophyll a in Kurtboğazı and Çamlıdere reservoirs" 69
Tabie 4. The result of stepwise variable selection method in Çamlıdere reservoir
Step Multiple-R---- (Equ.)
p
O 001 0.00-1 Variable H- H, In(Zoo) 1 0.826 0.68 22.6 0.698 0.48 20.9 3 0.874 0.76 21.6 0.001 H, in(Zoo), NH 4 0.906 0.82 21.7 0.001 H, In(Zoo), NH
,
OM Chi.a = - 1.8**+0.62**(H) + 0.79*(In(Zoo)) - 46.36**(NH3) + 0.17*(0M) (0.56) (0.09) (0.29) (15.62) (0.07) (Equ. 21) Multiple LinearRegression Model (Çamlıdere)
*p< 0.05 ;**p< 0.01
Table 5. Descriptive statistics of residuals and predicted in Çamlıdere reservoir
Min. Max. Mean Std. crror
-
---Predicted 1.76 6.64 3.24 1.19 Residuel -1.26 1.06 -0.02 0.57 Z Predicted -1. 9 2.74 1.67 0.006 -0.03 0.96 0.89-- Z Residuel -1.97
Durbin
-
Watson Stat.=
1.97Table 6. VIF statistic for variables
Variable VIF
H 1.43
In(Zoo) 3.22
NH3 3.07
OM 1.56
water residence time, limited light transparency, the discrepancies between primary production and nutrients result in the reservoirs having different structures than natural lakes and phosphorus is not transferred to algal mass because of high turbidity and flow rate (Lind et al., 1993).
Multiple nonlinear regression models The muitiple regression equations showed that total
hardness was a significant independent variable for both
resenıoirs. But the reservoirs were differentiated by the
other variables. While In(Phyto), EC and T were important
in Kurtboğazı, In(Zoo), NH3-N and OM were important in
Çamlıdere reservoir. These two reservoirs were different
from the point of trophic level and water quality.
Kurtboğazı reservoir was classified as eutrophic while
Çamlıdere reservoir as mesotrophic according to Secchi
depth (USEPA, 1974).
We predicted chlorophyll a with multiple regression model. Riley and Prepas (1985) showed that chlorophyll a was predicted from total phosphorus (TP). Smith (1986) used muitiple regression models and showed that total phosphorus and total nitrogen were good predictors of
chlorophyll a. In our study, we didn't fınd a linear
relationship between TP and chlorophyll a. In reservoirs, TP is high because of floods and fertilization from the surrounding catchment area. However, the shortage of
We examined nonlinear relationships between independent variables and dependent variable to determine the relations in the system more accurately and
to explain the variations on chlorophyll a. We selected
independent veriables by plotting them against chlorophyll
a. Then, nonlinear equations were constructed for both
reservoirs (Equ. 3 and 4).
Phyto, Zoo, TP and SD variables were selected for
Kurtboğazı while Phyto, H and SD were selected for
Çamlıdere's models. We found nonlinear relationships between SU and chlorophyll a concentration for both reservoirs. Brezonik (1978) indicated linear and hyperbolic relationships between SD and chlorophyll a. Hoyer and Jones (1983) found relationships between chlorophyll and total phosphorus in reservoirs and developed a multivariable model regressing chlorophyll a on total phosphorus. They also showed how the zooplankton and chlorophyll a concentration were directly related, inversely
70 TARIM BILIMLERI DERGISI 1999, Cilt 5, Sayı 1
related or unrelated over time in Missouri reservoirs. In
Kurtboğazi's nonlinear model the effect of TP on
chlorophyll a together with SD were shown. This relationship was not found in multiple linear model. The chlorophyll a is an index of algal biomass and we found relationships between chlorophyll a and Phyto for both reservoirs.
Nonlinear regression model (Kurtboğazi)
The determination coefficients and standard error of the residuals were 8 5 °/o and 0.30, and 70% and 0.17 for equation 3 and 4, respectively. The determination coefficients were high and standard error of residuals were low in nonlinear estimations. These results indicated the appropriateness of the nonlinear models.
Nonlinear regression model (Kurtboğazi)
Chl a =a+b((ln(Phyto))+(ln(Zoo))c+d(TP)+SDe (Equ. 3) Chl a = a+b (In (Phyto))+ Hc + SDd (Equ. 4)
Tabie 7. The coefficients in the equation 3 and 4 ( ± standard error)
a C d e
Kurtboğazı -52 62 t 13.58 9.10-± 2.47 1.46 t 0.61 0.04 t 0.02 -9.21- ± 0.99
Çamlıdere -28.12- t 4.90 4.72- ± 0.89 0.59- ± 0.04 0.08 ± 0.34
• p < 0.05 ; ** p < 0.01 References
APHA. 1975. Standard Methods for the Examination of Water and Wastewater. 14th ed. John D. Lucas Co., 1193 p., USA.
Bakan, A.N. 1997. Ankara'ya Su Sağlayan Kurtboğazı ve
Çamlıdere Baraj Gölleri ile lvedik Su Arıtım Tesisinde
Plankton Kompozisyonunun Karşılaştırmalı Olarak
incelenmesi. A.Ü. Fen Bilimleri Ens., Doktora Tezi, 112 s., Ankara.
Brezonik, P.L. 1978. Effect of organic color and turbitidy on Secchi disk transparency. J. Fish. Res. Board Can. 35: 1410 - 1416.
Curi, K.V. and S. Tanyeri, 1974. Nehirlerdeki özümleme Kapasitesi Üzerine Genel Analitik Model Ve Porsuk Nehrine Tatbiki (TÜBITAK) Proje no: MAG-329, 103 p., Istanbul. Dillon, P.J. and F.H. Rigler, 1974. A test of a simple nutrient
budget model predicting the phosphorus concentration in leke water.J.Fish.Res. Board Can. 31 :1771-1778 .
Draper, N.R. and H. Smith, 1980. Applied Regression Analysis. Univ. of Wisconsin, 710 p., USA.
Gökkurt, S. 1989. Water Quality Model for Karasu River. M.E.T.U. Master Thesis, 105 p., Ankara
Hoyer, M.V. and J.R. Jones, 1983. Factors affecting the relation
between phosphorus and chlorophyll a in midwestern
reservoirs. Can. J. Fish. Aquat. Sci. 40 : 192-199.
Komarkova, J. and J. HejzIar, 1996. Summer maxima of phytoplankton in the Rimov reservoir in relation to hydrologic parameters and phosphorus loading Arch. Hydrobiol. 136 : 217-236.
Lind, 0.T., T.T. Terrell and B.G. Kimmel, 1993. Problems in
reservoir trophic-state classification and ımplications for
reservoir management. In : M. Straskaba, J.G. Tundisi, A. Duncan (eds), Comparative Reservoir Limnology and Water Quality Management, Kluwer Ac. Publ. p. 57-67.The Netherlands.
Lund, J.W.G., C. Kipling and E.D. Le Cren, 1958. The ınverted
microscope method of estimating algal numbers and statistical basis of estimations by counting. Hydrobiologia, 11 : 143-170.
Mazumder, A. 1994 a. Phosphorus-chlorophyl relationships under contrasting herbivory and thermal stratification: prediction and pattemrns. Can. Jj. Fish. Aquat. Sci, 51 : 390-400,
Mazumder, A, 1994 b. Phosphorus-chlorophyll relationships under
contrasting zooplankton community Structure potential mechanisms. Can. J. Fish. Aquat. Sci. 51 : 401-407.
Pulatsü, S., H. Çamdeviren and E. Başpınar, 1997. Mogan
gölünde (Ankara) klorofil-a konsantrasyonunun tahmininde
çoklu regresyon ve path analizi kullanımı. Tarım Bilimleri
Dergisi, 3 : 65-68.
Riley, E.T. and E.E. Prepas, 1985. Comparison of the phosphorus-chlorophyit relationships in mixed and stratifical laket. Can J. Fish. Aquat. Sci. 42 : 831-835.
Seip, K.L, H. Sas and S. Vermij, 1992. Changes in Secchi disk depth with eutrophication. Arch Hydrobiol. 124 : 149-165. Smith, V. H. 1986. Light and nutrient effects on the relative
biomass of blue-green algae in lake phytoplankton. Can. J. Fish. Aquat. Sci. 42 : 148-153.
Strickland, J.D.H. and T.R. Parsons, 1972. A Practical Handbook
of Seawater Analysis. 2nd Ed. Bull. Fish Res. Board Can.
No: 167, 311 p., Canada.
USEPA, 1974. An Approach to a Relative Trophic Index System for Classifying Lakes and Reservoirs. US Environmental Protection Agency, 22 p., USA.
Vvzina, A. F. and M. L. Pace, 1994. An inverse model analysis of planktonic food webs in exqerimental lakes. Can. J. Fish. Aquat. Sci. 51:2034-2044.
Lwetzel, R. G. and G. E. Likens, 1991. Limnological Analysis, 2"d ed. Springer Verlag, 324 p., New York.
Zakova, Z., D. Berankova, E. Kockova, P. Kriz and H. Mlejnkova, 1993. investigation of the development of biological and chemical conditions in the Vir reservoir 30 years after impoundment. Wat. Sci. Tech, 28: 65-74.


