Full Terms & Conditions of access and use can be found at
https://www.tandfonline.com/action/journalInformation?journalCode=taar20
Journal of Applied Animal Research
ISSN: 0971-2119 (Print) 0974-1844 (Online) Journal homepage: https://www.tandfonline.com/loi/taar20
The application of six different models to estimate
the genetic parameters, variance components and
breeding values for birth weight of Holstein calves
Aziz Şahin, Zafer Ulutaş & Emre Uğurlutepe
To cite this article: Aziz Şahin, Zafer Ulutaş & Emre Uğurlutepe (2017) The application of six different models to estimate the genetic parameters, variance components and breeding values for birth weight of Holstein calves, Journal of Applied Animal Research, 45:1, 598-602, DOI: 10.1080/09712119.2016.1239581
To link to this article: https://doi.org/10.1080/09712119.2016.1239581
© 2016 The Author(s). Published by Informa UK Limited, trading as Taylor & Francis Group
Published online: 07 Oct 2016.
Submit your article to this journal
Article views: 1202
View related articles
The application of six different models to estimate the genetic parameters, variance
components and breeding values for birth weight of Holstein calves
AzizŞahina, Zafer Ulutaşband Emre Uğurlutepea
a
Department of Animal Science, Faculty of Agriculture, Ahi Evran University, Kırşehir, Turkey;bDepartment of Animal Production and Technologies, Faculty of AyhanŞahenk Agricultural Sciences and Technologies, Niğde, Turkey
ABSTRACT
This research was conducted to determine variance component, genetic parameters and breeding values (EBV) for the birth weight (BW) of Holstein calves. In this context, the direct genetic (s2
a), maternal genetic (s2
m) and maternal permanent environmental effects, which affect BW, were separately assessed. The multi-trait, derivative-free restricted maximum likelihood programme was used for determining the effect of the genetic parameters by using models that either included or excluded the maternal genetic and/or permanent maternal environmental effects. The estimation of the BW of Holstein calves was optimized by evaluating six different models. The best model was chosen according to the log-likelihood ratio tests. Within the context of the study, a total of 4443 calves were investigated between 1987 and 2006. Among the six different models, model 4 was selected as the best model, since it had the lowest value for the likelihood ratio. The range of the values for direct heritability (h2
d) and maternal heritability (m
2
) were between 0.07–0.13 and 0.04–0.09, respectively. In conclusion, an estimation of the genetic parameters for BW can be used as a selection criteria for Holstein calves.
ARTICLE HISTORY
Received 6 May 2014 Accepted 30 August 2016
KEYWORDS
Variance component; genetic parameters; breeding value; direct genetic; maternal genetic
1. Introduction
The Holstein is a breed of cattle commonly reared across Turkey, and the calves of this breed are often raised for their meat and milk. The birth weight (BW) of calves is a vital feature of cattle breeding that significantly affects meat and milk production (Bakır et al. 2004) as well as the animal’s growth performance. For this reason, BW is a par-ameter that is generally included in the selection criteria. The BW provides cues regarding a calf’s prenatal develop-ment, while also serving as an indicator about its growth fol-lowing birth. BW is controlled by a multitude of genetic, maternal and environmental factors. Such factors may be associated with the genes of the calf, the genes of the dam or with environmental factors that affect the calf and/or the dam. The overall BW is a polygenic feature that is also influ-enced by environmental factors. Consequently, efforts to improve live weight through selection requires a consider-ation of both maternal and direct components (Meyer 1992, 1993). The number of studies evaluatings2
min the BW of Hol-stein calves as well as the ram by employing restricted maximum likelihood (REML) is limited. The purpose of the present research was to examine the significance of maternal effects on BW of Holstein calves, applying six animal models including both environmental and genetic effects. Further-more, the six models were also used to estimate the EBV and the relationships between direct genetic effects and maternal genetic effects.
2. Materials and methods
2.1. Data collection and preparation
The records for a 20-year period (1987–2006) were obtained from the Tahirova Official Farm in Turkey with data on a total of 4433 calves (2152 females and 2281 males) descending from 940 dams and 223 sires. There were on average 3.72 off-spring for each dam.
The BW was measured utilizing a scale with 150 g sensitivity within 24 hours after birth. Abnormal records were removed from the data set.
2.2. A preliminary analysis
The fixed effects were determined by using the Minitab (1998) software (version 12.1). Analyses were performed in each one of the models, by taking into account the effects associated with the year of birth, the sex of the calf and the type of calving. Dam age was considered as a linear covariate. Effects determined as non-significant were excluded from the models by using backwards elimination.
2.3. Estimation of variance component, genetic parameters and breeding values
Variance components and genetic parameters were estimated by multi- trait, derivative- free restricted maximum likelihood
© 2016 The Author(s). Published by Informa UK Limited, trading as Taylor & Francis Group
This is an Open Access article distributed under the terms of the Creative Commons Attribution License (http://creativecommons.org/licenses/by/4.0/), which permits unrestricted use, distri-bution, and reproduction in any medium, provided the original work is properly cited.
CONTACT A. Sahin [email protected] Department of Animal Science, Faculty of Agriculture, Ahi Evran University, 40100 Kırşehir, Turkey VOL. 45, NO. 1, 598–602
(MTDFREML) software package (Boldman et al.1995). Six differ-ent models were used for each analysis. In all analyses a conver-gence criteria was used to the value of 10−9. Each analysis was also re-started to avoid a local maximum until reaching the global one. Dam age was considered as a covariate. Random effects associated with the calf, sire and dam were also con-sidered. The parameters estimated by using the six animal models are provided inTable 1.
The analysis was repeated with the estimates at earlier apparent convergence as the starting values until a global minimum of −2 log L was detected, when −2 log L values remained constant to the fifth denary after successive repetition (Lee and Taper2002; Tilki et al.2008). The parameters listed in Table 1were estimated using the six different animal models. In the models applied, the animal was considered as a random factor. The s2
c was added in the models as a random effect, with no correlation with the other effects in the models (Ap Dewi et al.2002). Thes2
m was employed as a second random effect for animals with similar covariance as the direct effect. The models used in the analysis are summarized below.
Model 1: Yijklm= Fijk+ al+ eijklm Model 2: Yijklmn= Fijk+ al+ Pm+ eijklmn
Model 3: Yijklmn= Fijk+ al+ mm+ eijklmnwithσAMA = 0 Model 4: Yijklmn= Fijk+ al+ mm+ ejiklmnwithσAMA≠0 Model 5: Yijklmn= Fijk+ al+ mm+ pm+ eijklmnwithσAMA = 0 Model 6: Yijklmn= Fijk+ al+ mm+ pm+ eijkmnwithσAMA≠0 In these equations;
Yijklmn: standardized weights with dam and fixed effect composition.
al:σa2, pm:s2c, mm:s2m, eijklmn: random error Fijkl: fixed effects bmi+ sj+ byk+ btl+θ(Xijkl− Y ) bmi: the effect of the birth season,
sj: the effect of the calf sex, byk: the effect of the birth year, btl: the effect of the birth type,
θ: the regression coefficiency of detected weights on dam age,
Xijkl: dam age, Y: mean dam age, h2
T was determined using the next formula (Willham1972): h2
T= (s2a+ 0.5s2m+ 1.5sam)/s2p.
The best equality was determined with the likelihood ratio test (Saatcı et al.1999). This test involved comparing a value
from the chi square distribution with the−2 Log L, and mining the difference between the two. EBV for BW was deter-mined using the best model. For the EBV, genetic trends were calculated according to the years of birth.
3. Results and discussion
Thes2
awere higher than the level ofs2mfor all traits. Six different model analysis results are summarized inTable 1andTable 2. In general, thes2
a was higher than thes2a leading to lower esti-mates of m2compared to h2
d.
3.1. Heritabilities
Model 1, fitting animal as the only random effect, produced considerably higher estimates for s2
a and h2d than other models. Likewise, higher heritability estimates for BW from model one have been informed for different cattle breeds (Abera et al.2011; Sahin et al.2012).
Observeds2
aand h2d(0.11) in model 1 were higher than those in the other models. Except for models 1, 2 and 3, estimateds2 a and h2
dwere close to each other. In model 1, wheres2
mwere disregarded, h2d was 0.11, while the inclusion ofs2
m in models 3, 4, 5 and model 6 decreased the h2
d. When the s 2
m was added in the model, s2a ranged from 0.882 to 1.142.
According to models, the maternal effects were separated into two units, as environment and genetic. In model 2 s2 c decrease has been observed in boths2
a and h2d compared to that in model 1. Includings2
a with nos2a in model 3 resulted in lowests2
a and h2d compared to those estimated in models 4 and 6.
But, insertings2
mwith nos2cin model 4 resulted in highers2a and h2
dcompared to those estimated in models 2, 3 and 5. Model 4 (s2
cremoved) generated the highest h2dands 2 athan models 2 and 5. Also, addings2
am in model 4 gave rise to the highests2
aand h2d than models 2 and 5. When thes 2
c was dis-regarded (model 4), thes2
pwas attributed to thes2m, emerging in overestimation of the m2compared to model 3.
In model 5, s2
m was added but σam was removed. Conse-quently model 5 created lowers2
aand h2dthan the other models. In model 6, whens2
mands2cwere included, 5% of thes2pwas attributed to thes2
mand 4.3% to the c 2.
It was apparent that the model used for analysis consider-ably affected the relative values for maternal and direct herit-ability. In general,s2
m is lower thans2a, which leads to higher estimates of h2
d compared to m 2
. In the current study, the h2 T for BW varied between 0.09 and 0.26. Higher total heritability estimates varying between 0.37 and 0.62 were reported by Abera et al. (2011) for Zebu and their crosses Jersey and Hol-stein cattle. Furthermore, Tilki et al. (2008) and Sahin et al. (2012) also determined higher h2
Tfor Brown Swiss cattle. Estimates of total heritability represent a useful mean for estimating response to selection based on the phenotypic value. Estimates can be influenced by the breeds, models and data size that are used (Solomon and Gemeda2002).
In this research, according to chosen model, h2
d varied from 0.07 to 0.11 and m2ranged from 0.04 to 0.09. Karabulut et al. (2012) reported that estimates for h2
d ranged from 0.02 to
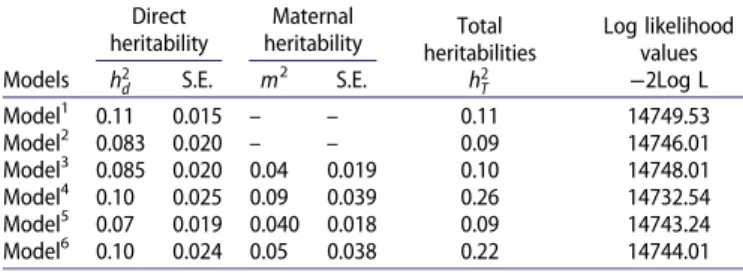
Table 1.Estimates of heritabilities and log-likelihood values.
Models
Direct heritability
Maternal
heritability heritabilitiesTotal Log likelihoodvalues h2 d S.E. m 2 S.E. h2 T −2Log L Model1 0.11 0.015 – – 0.11 14749.53 Model2 0.083 0.020 – – 0.09 14746.01 Model3 0.085 0.020 0.04 0.019 0.10 14748.01 Model4 0.10 0.025 0.09 0.039 0.26 14732.54 Model5 0.07 0.019 0.040 0.018 0.09 14743.24 Model6 0.10 0.024 0.05 0.038 0.22 14744.01 Notes: h2
T: total heritability (h2T= (s2a+ 0.5sm2+ 1.5sam)/s2pWillham1972), S.E.
Standard error. s2
a: direct additive genetic variance, s2m: maternal additive
genetic variance, s2
am: the covariance between direct and maternal genetic
effects,s2
c: the variance of the permanent environmental effect of the dam
(maternal environmental variance),s2
p: phenotypic variance, c
2: the permanent
environmental variance due to the dam as a proportion of phenotypic variance, cam: genetic variance between direct and maternal effects as a proportion of the
total variance, ram: genetic correlation between direct and maternal effects,−2
log L: log likelihood.
0.48, m2from 0.12 to 0.45, camfrom−0.09 to −0.14, c2from 0.01 to 0.24 and ramwas−1.00 for Holstein calves, respectively. But then Tilki et al. (2008) informed estimates of h2
d from 0.15 to 0.37, m2 from 0.06 to 0.15, ram from 0.73 to 0.92, cam from 0.085 to 0.090, c2from 0.001 to 0.083 for Brown Swiss calves, respectively. By the preferred model, m2 ranged from 0.04 to 0.09 for BW. Based on model 4 (the best model), the estimates of m2for BW were 0.09 ± 0.039. In the study of Demeke and Neser Schoeman (2003), a small (yet non-zero) estimate was also reported for maternal heritability for BW. This finding was similar to those in the study of Sahin et al. (2012). Pico (2004) and Plasse et al. (2002a, 2002b) previously informed m2 for BW values of 0.11, 0.08 and 0.07 in Brahman cattle; these values are lower than the ones identified in the current study. Furthermore, Aynalem (2006) reported that m2 estimates in Boran and their crosses were 0.25 ± 0.05 and 0.18 ± 0.05, which are closer to the estimates of the current study. Low levels or the complete lack of maternal effects on growth traits indicates that improvement in these traits can be achieved more efficiently through selection based on the direct genetic potential of the animal. In general, maternal effects at birth result from the cytoplasmic effect and prenatal maternal environment (Wasike et al. 2006). On the other hand, Wasike et al. (2006) reported a lack of maternal influence on BW in Boran breeds. But then Karabulut et al. (2012) deter-mined higher m2(0.12–0.45) in Holstein calves and also a nega-tive ram. However, Tilki et al. (2008) estimated higher m2(0.06– 0.15) for Brown Swiss calves and a positive ram.
Meyer (1992) previously demonstrated that models exclud-ing s2
m could provide considerably higher estimates for the s2
a, and, hence, higher estimates for h2das well. In case maternal effects are not taken into account, part of the maternal variance will be included in the estimate of additive genetic variance. Thus, includings2
m will have the effect of decreasing the esti-mates of h2
d.
It was observed that the permanent maternal environmental effects (or maternal environmental variance) varied between 0.023 and 0.472 for BW. Gemeda et al. (2003) attributed the s2
cin BW to the dam’s uterine conditions. The same researchers also noted that thes2
c was associated with the dam’s uterine capacity, maternal behaviour and feeding during late gestation. It is likely that maternal behaviour reflects the rearing ability of a dam. Maniatis and Pollott (2003) previously showed the influ-ence of record in separating maternal environmental and maternal genetic effects from the integrated direct effects. These authors indicated that the accuracy of maternal effect
estimates is dependent on the pedigree information, and that the number of progeny per dam as well as the ratio of dams having their own record in the data is significantly affected by the estimation of the variance component.
3.2. Genetic correlations and covariances
The ramwas negative and high for models 4 (−0.76 ± 0.027) and 6 (−0.67 ± 0.115). Similarly, genetic correlations estimated by Sahin et al. (2012) for Brown Swiss calves, Karabulut et al. (2012) for Holstein calves were negative and ranged from −0.58 to −1.00. However, compared to the results of the current study, lower ramestimates (−0.35 to −0.37) have been informed for Brahman cattle (Plasse et al. 2002a; Pico 2004), while similar estimates have been noticed for Nellore cattle (−0.72, Eler et al.1995) and Boran cattle (−0.55, Haile-Mariam & Kassa-Mersha1995).
The negative correlation observed between the rameffects is possibly a symptom of genetic conflict between genes; hence, taking this correlation into consideration during selection pro-grammes is important. Meyer (1992) and Swalve (1993) pre-viously proposed that environmental covariances between offspring and dam that are not taken into account may lead to bias in the ram. For beef cattle, Robinson (1996) noted that negative ram could be the result of other effects in the data rather than an actual negative genetic relationship.
On the other hand, contrary to the results of the present investigation, Demeke and Neser Schoeman (2003) suggested that a large and positive correlation (0.48) between the s2 a ands2
mcould be associated with bias due to the breed additive effect and the dam’s additive effects not being taken into account. Numerous studies conducted on different breeds have reported a negative association between ramfor BW and weaning weight (Maria et al.1993; Tosh & Kemp1994; Ligda et al.2000). But, a number of studies have also reported a posi-tive relationship (Nasholm & Danell 1996; Yazdi et al. 1997). Nasholm and Danell (1996) described that, in this instance of a positive relationship between ram, selection for augmented weights will also lead to an improvement in the maternal ability. These authors did not provide a conclusive explanation for these negative estimates. They might be associated with natural selection for an intermediate optimal (Tosh & Kemp 1994). It is generally assumed that, for body weight, thes2
am is usually negative (Maria et al. 1993; Tosh & Kemp 1994); however, certain studies have also identified a positive relation-ship (Nasholm & Danell1996; Yazdi et al.1997).
Table 2.Estimates of parameters and correlations.
Models
Parameters and correlations
s2 a s2m s2am s2c σ 2 e s2p cam ram S.E. c2 S.E. Model1 1.249 – – 9.876 11.124 – – – – – Model2 0.938 – – 0.471 9.782 10.720 – – – 0.042 0.019 Model3 0.882 0.472 – – 9.683 10.565 – – – – – Model4 1.097 1.026 –0.808 – 9.743 10.840 0.075 –0.760 0.027 – – Model5 0.829 0.497 – 0.023 10.757 11.585 – – – 0.002 0.000 Model6 1.142 0.632 0.657 0.470 9.792 10.934 0.060 –0.670 0.115 0.043 0.017 Notes: h2
T: total heritability (h2T= (s2a+ 0.5s2m+ 1.5sam)/s2pWillham1972), S.E. Standard error.s2a: direct additive genetic variance,s2m:maternal additive genetic
variance,s2
am: the covariance between direct and maternal genetic effects,s2c: the variance of the permanent environmental effect of the dam (maternal environmental
variance)s2
p: phenotypic variance, c 2
: the permanent environmental variance due to the dam as a proportion of phenotypic variance, cam: genetic covariance between
The cam ranged from 0.060 to 0.073. Cundiff (1972) stated that the negatives2
amexplained from an evolutionary point of view prevents species from becoming increasingly larger. In this study, s2
am were determined as positive. The findings of the present research were in agreement with those of Meyer (1992) and Tilki et al. (2008). But, this result was not supported by Karabulut et al. (2012). Moreover, some researchers informed that a possible existence of a negative environmental covari-ance between offspring and dam could result in a biased esti-mation of ram(Meyer1992; Ligda et al.2000).
Lows2
cin model 5 reflects thats2cis not considerable for BW as mentioned by Rodriguez-Almeida et al. (1995) for Mac Nay and Rhodes calves. In this study,s2
amwas estimated as positive. Meyer (1992) reported the positives2
amfor the BW of different calves, which is in line with the conclusions of the current research; nevertheless, Cantet et al. (1988) informed a negative s2
amfor BW of Hereford calves. Szwaczkowski et al. (2006) pre-viously demonstrated that, when the maternal contribution is omitted during evaluation, the negatives2
amserves as an indi-cation of the different rankings of individuals. In addition, Swalve (1993) described that the negatives2
ammight be associ-ated with the managing scheme. On the other hand, a study directed by Dodenhoff et al. (1999) on various strains of beef steers indicated that breed determines the dependence and ram. Furthermore, Přibyl et al. (2008a, 2008b) demonstrated that correcting the records plays a role in determining the genetic parameters, and that it also contains a more complice pedigree and harvests considerably diverse conclusions.
3.3. The likelihood test
The results are shown inTable 2. According to the theories of the MTDFREML software package, model 4 with the lowest like-lihood ratio is selected as the best model (Van Vleck 1993; Ulutas 1998; Lee & Taper 2002; Ulutas et al.2002). This con-clusion is in contradiction with the results of Tilki et al. (2008) who described that model 6 was the best model.
3.4. Breeding values
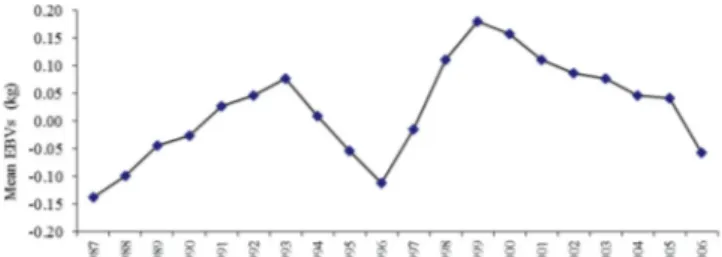
EBV breeding value has been estimated using the best model (model 4). According to birth year, changes of the breeding values are shown inFigure 1. The genetic trend was estimated to the regression of EBV according to birth year. It was positive, 0.0085 kg/year, and important. A significant trend was not observed in the research period. The genetic trend was deter-mined as non-zero. According to birth year, uneven fluctuations were observed in breeding values. The genetic trend (0.0085 kg/
year) calculated in the current research was lower than the results of Intaratham et al. (2008). However, Tilki et al. (2008) stated that no positive and negative EBV for BW was determined.
4. Conclusions
The estimates of genetic parameters for Holstein calves were consistent with previous research results. This research revealed that the addition of only maternal effect to a model caused a reduction in estimates of h2d for BW of Holstein calves. Conse-quently, maternal effect on BW in diverse ages of Holstein cattle was important and should be considered in any selection scheme for these calves.
Acknowledgements
The authors are thankful to the Republic of Turkey Ministry of Food, Agricul-ture and Livestock and General directorate of Agricultural Enterprises.
Disclosure statement
No potential conflict of interest was reported by the authors.
References
Abera H, Abegaz, S, Mekasha Y.2011. Genetic parameter estimates of pre-weaning weight of Horro (Zebu) and their crosses with Holstein Friesian and Jersey cattle breeds in Ethiopia. Int J Livestock Prod. 2 (6):84–91.
Ap Dewi I, Saatci M, Ulutas Z.2002. Genetic parameters of weights, ultra-sonic muscle and fat depths, maternal effects and reproductive traits in Welsh Mountain sheep. Anim Sci. 74:399–408.
Aynalem H.2006. Genetic and economic analysis of Ethiopian Boran Cattle and their Crosses with Holstein Friesian in Central Ethiopia. A Ph.D. Thesis division of dairy cattle breeding National dairy research institute, Karnal-132001 (Haryana), India, pp. 65–146.
Bakır G, Kaygısız A, Ulker H.2004. Estimation of genetic parameters of milk yield in Brown Swiss and Holstein Friesian cattle. Pak J Biol Sci. 7:1198– 1201.
Boldman KG, Kriese LA, Van Vleck LD, Van Tassell CP, Kachman SD.1995. A manual for use of MTDFREML, a set of programs to obtain estimates of variances and (co)variances. Washington, DC: USDA, ARS.
Cantet RJC, Kress DD, Anderson DC, Doornbos DE, Burfenning PJ, Blackwell RL.1988. Direct and maternal variances and (co)variances and maternal phenotypic effects on pre-weaning growth of beef cattle. J Anim Sci. 66:648–660.
Cundiff LV. 1972. The role of maternal effects in animal breeding: VIII. Comparative aspects of maternal effects. J Anim Sci. 35:1335–1337. Demeke SFWC, Neser Schoeman SJ.2003. Variance components and genetic
parameters for early growth traits in a mixed population of purebred Bos indicus and crossbred cattle. Livestock Prod Sci. 84:1–11.
Dodenhoff J, Van Vleck LD, Gregory KE.1999. Estimation of direct, maternal, and grand maternal genetic effects for weaning weight in several breeds of beef cattle. J Anim Sci. 77:840–845.
Eler JP, Van Vleck LD, Ferraz JBS, Lobo RB.1995. Estimation of variance due to direct and maternal effects for growth traits of Nelore cattle. J Anim Sci. 73:3253–3258.
Gemeda D, Schoeman SJS, Cloete WP, Jordaan GF.2003. Genetic parameters for early growth traits in a Merino lambs estimated using multitrait analy-sis. Ethiopian J Anim Prod. 3(1):1–11.
Haile-Mariam M, Kassa-Mersha H.1995. Estimates of direct and maternal covariance components of growth traits in Boran cattle. J Anim Breeding Genet. 112:43–52.
Intaratham W, Koonawootrittriron S, Sopannarath P, Graser HU, Tumwasorn S.2008. Genetic parameters and annual trends for birth and weaning
Figure 1.Mean EBVs of birth weight according to years.
weights of a Northeastern Thai indigenous cattle line. Asian-Aust J Anim Sci. 21:478–483.
Karabulut O, Mundan D, Sehar Ö.2012. Variance components and breeding values of birth weight in Holstein calves. Harran Univ J Faculty Vet Med. 1:28–34.
Lee S, Taper ML.2002. A composite likelihood approach to (co)variance component estimation. J Stat Planning Inference 103:117–135. Ligda CH, Gavriilidis G, Papodopoulos TH, Georgoudis A.2000. Investigation
of direct and maternal genetic effects on birth and weaning weights of Chios lambs. Livestock Prod Sci. 67:75–80.
Maniatis N, Pollott GE.2003. The impact of data structure on genetic (co)var-iance components of early growth in sheep, estimated using an animal model with maternal effects. J Anim Sci. 81: 101–108.
Maria GA, Boldman KG, van Vleck LD.1993. Estimates of variances due to direct and maternal effects for growth traits of Romanov sheep. J Anim Sci. 71:845–849.
Meyer K. 1992. Variance components due to direct and maternal effects for growth traits of Australian beef cattle. Livestock Prod Sci. 31:179–204.
Meyer K.1993. Estimates of (co)variance components for growth traits of Australian Charolais cattle. Aust J Agric Res. 44:1501–1508.
Minitab for Windows (Version 12.1) [Computer Program].1998. Distributor: Minitab Inc., State College, PA, USA.
Nasholm A, Danell O.1996. Genetic relationships of lamb weight, maternal ability and mature ewe weight in Swedish fine wool sheep. J Anim Sci. 74:329–339.
Pico BA2004. Estimation of genetic parameters for growth traits in South African Brahman cattle. A MSc. Thesis, Free State University, Bloemfontein, South Africa, p. 56.
Plasse D, Verde O, Arango J, Camaripano L, Fossi H, Romero R, Rodriguez CM, Rumbos JL.2002b. (Co)variance components, genetic parameters and annual trends for calf weights in a Brahman herd kept on floodable savanna. Genet Mol Res. 1(4): 282–297.
Plasse D, Verde O, Fossi H, Romero R, Hoogesteijn R, Bastidas P, Bastardo J.
2002a. (Co)variance components, genetic parameters and annual trends for calf weights in a pedigree Brahman herd under selection for three decades. J Anim Breeding Genet. 119:141–153.
Přibyl J, Krejčová H, Přibylová J, Misztal I, Tsuruta S, Mielenz N.2008b. Models for evaluation of growth of performance tested bulls. Czech J Anim Sci. 53:45–54.
Přibyl J, Přibylová J, Krejčová H, Mielenz N.2008a. Comparison of different traits to evaluate the growth of bulls. Czech J Anim Sci. 53, 273–283.
Robinson DL. 1996. Models which might explain negative correlations between direct and maternal genetic effects. Livestock Prod Sci. 45:111–122.
Rodriguez-Almeida FA, Van Vleck LD, Willham RL, Northcutt SL. 1995. Estimation of non additive genetic variances in three synthetic lines of beef cattle using an animal model. J Anim Sci. 73:1002–1011.
Saatcı M, Ap Dewi I, Ulutas Z.1999. Variance components due to direct and maternal effects and estimation of breeding values for 12-week weight of Welsh Mountain lambs. Anim Sci. 69:345–352.
Sahin A, Ulutas Z, Yılmaz Adkinson A, Yılmaz Adkinson RW.2012. Estimates of phenotypic and genetic parameters for birth weight of Brown Swiss calves in Turkey using an animal model. Trop Anim Health Prod. 44:1027–1034.
Solomon A, Gemeda D.2002. Genetic and environmental trends in growth performance of a Flock of Horro Sheep. Ethiopian J Anim Prod. 2(1):49–58. Swalve HH. 1993. Estimation of direct and maternal (co)variance com-ponents for growth traits in Australian Simmental beef cattle. J Anim Breeding Genet. 110:241–252.
Szwaczkowski T, Wojtowski J, Stanislawska E, Gut A. 2006. Estimates of maternal genetic and permanent environmental effects in sheep. Archiv für Tierzucht. 49:186–192.
Tilki M, Saatcı M, Colak M.2008. Genetic parameters for direct and maternal effects and estimation of breeding values for birth weight in Brown Swiss Cattle. Turk J Vet Anim Sci. 32:287–292.
Tosh JJ, Kemp RA. 1994. Estimation of variance components for lamb weights in three sheep populations. J Anim Sci. 72, 1184–1190. Ulutas Z.1998. Production traits and marked values of Welsh Black Cattle.
PhD thesis, University of Wales Bangor, United Kingdom.
Ulutas Z, Saatcı M, Dewi IA.2002. Six different models for estimation of genetic parameters and breeding values for pre weaning and post-weaning weights in suckler cattle. Turk J Vet Anim Sci. 26:215–220. Van Vleck LD.1993. Estimation of non additive genetic variances for a
total-merit model including maternal effects. J Anim Sci. 71:2006.
Yazdi MH, Engstrom G, Nasholm A, Johansson K, Jorjani H, Liljedahl LE.1997. Genetic parameters for lamb weight at different ages and wool pro-duction in Baluchi sheep. J Anim Sci. 65:224–255.
Wasike CB, Ilatsia ED, Ojango JMK, Kahi AK.2006. Genetic parameters for weaning weight of Kenyan Boran cattle accounting for direct-maternal genetic covariance. S Afr J Anim Sci. 36(4): 275–281.
Willham RL. 1972. The role of maternal effects in animal breeding: III. Biometrical aspects of maternal effects in animals. J Anim Sci. 35:12– 1293.