Vol. 135 (2019) ACTA PHYSICA POLONICA A No. 4
Special Issue of the 8th International Advances in Applied Physics and Materials Science Congress (APMAS 2018)
Energy Recovery Analysis in A-Type Pressure Regulation
and Measurement Stations in Istanbul, Esenyurt
M. Atmaca
a,∗, Y. Uraltaş
a, A. Onat
aand C. Ezgi
baMarmara University, Mechanical Engineering Department, Istanbul, Turkey bBeykent University, Mechanical Engineering Department, Istanbul, Turkey
Converting energy sources into electrical energy is as important as gaining energy. After producing natural gas, which is one of the most common energy sources and classified as fossil fuel, it is sold by the natural gas and petrol companies to the world by compressing it in the compressor stations. Gas companies compress incoming gas which is lost in the pipeline into 35–75 bar equal to the loss rate and transfer it to the A-type pressure regulation measurement stations. In these stations, natural gas that enters with high pressure is reduced to 12–19 bar by throttle valve. This process happens using the Joule–Thomson effect. Hence, no energy is produced in this process. There is a big waste of producible electrical energy in this situation. In this work, turboexpander which is suitable for radial type variant flow has been considered to be used instead of throttle valve at the stations. In this work, A-type pressure regulation measurement station in Esenyurt yearly gas values, inlet and outlet gas pressure values, inlet and outlet temperature values were searched and gained electric energy value was searched in case of installing turboexpander to this station.
DOI:10.12693/APhysPolA.135.622
PACS/topics: pressure regulation measurement station (RMS), turbine, energy, efficiency
1. Introduction
Energy requirement of human civilization has existed and continued since the existence process itself. Re-sources above and under the ground have been utilized in order to meet energy requirements. Efficient utiliza-tion of energy obtained from resources above and un-der the ground is as significant as production of energy. Energy saving is the most important factor in terms of energy efficiency. Saving on energy actually denotes de-crease in energy consumption amount by utilization of energy wastes as well as prevention of existing energy losses. The issue of energy efficiency comprises methods including prevention of energy losses of heat, gas, steam, air, and electricity, recovery and utilization of various types of wastes or decrease in energy demand without lowering the production value, which have been possible due to advanced technology and energy recovery [1, 2].
One of the methods of ensuring energy efficiency is pro-ducing electric energy through usage of turboexpander instead of expansion valve which does not produce work due to the Joule–Thomson effect in natural gas pressure reducing stations [3, 6]. The results obtained when tur-boexpander is placed instead of expansion valves which are employed as a standard in A-type pressure reducing station have been researched in this study. Various sim-ilar studies can be found in this regard in the literature. Mirandola and Minca [7] have determined design criteria by taking into account thermodynamic conditions as re-garding power generation from high pressure natural gas,
∗corresponding author; e-mail: [email protected]
gas withdrawal amounts, pressure reduction phases, as well as preheating requirements. They suggested design conditions for 8 plants in Italy. The number of stages varied from 1–3, while the inlet pressures ranged from 51–11.3 bar, and outlet pressure ranged from 6–1.5 bar. It was shown that the specific production of electrical energy could be 0.028–0.0644 kWh/(N m3) of gas. With design flow rates ranging from 5000–30000 N m3/h, re-sulting power output varied from 300–1400 kWh. In a subsequent paper, Mirandola and Macor [8] presented experimental results and analysis of real data from a pro-totype plant built in 1987 in Ravenna, Italy. At initial stages the plant showed some operational problems which were rectified later. In two separate periods totalling 84 days, it produced 971 MWh of electricity. Poživil re-ported simulation results for a gas transmission station at Velké Němčice, Czech Republic [9]. It is mentioned that temperature drop in the throttle valve can be about 0.45– 0.6◦C per bar of pressure drop, whereas with turboex-panders it can be much higher, around 1.5–2◦C per bar, depending on the gas composition.
2. Material and methods
Instant gas flow, instant temperature changes as well as instant pressure values within the year, were provided by virtue of turbine meter, ultrasonic meter, pressure, and temperature meter equipments currently operating in RMS-A, Regulation and Measurement Station (Es-enyurt District A-type Pressure Reducing Station) in ad-dition to obtaining components of the gas through uti-lization of gas chromatography device in this study. In the light of this data, energy recovery analysis in case of placing turboexpander instead of expansion valve Es-enyurt District RMS-A located in İstanbul province, was
Energy Recovery Analysis in A-Type Pressure Regulation and Measurement Stations. . . 623 conducted through utilization of the process simulation
program named HYSYS which is especially used in the energy sector and the theoretical calculation method in order to confirm foregoing. Expansion has been calcu-lated by virtue of Eqs. (1)–(6), taking into account the power generation to turbine, gas consumption to take place at preheating, required turbine inlet temperature, work performed, and total electricity production.
3. Results and discussion
According to January data in Esenyurt RMS-A sta-tion: gas inlet pressure P1 = 45.78 bar, turbine
in-let pressure P2 = 45.78 bar, average gas flow Q =
423.618 S m3/h, gas inlet temperature T
1= 13.39◦C, gas
outlet temperature T3 = 12.58◦C, turbine outlet
pres-sure P3 = 21.55 bar, average higher heat value (HHV)
for natural gas = 9347.2734 kcal/(S m3), turbine adia-batic efficiency = 78% (assumed), gear box and gener-ator efficency = 90% (assumed), density of natural gas (ρ) = 0.7163 kg/m3 (15◦C and 1.01325 bar). The
tur-bine efficiency (ηT) is calculated as follows:
ηT = h2− h3 h2− h3s
. (1)
s2 = s3s kJ/(kg K) (isentropic process). For P1 =
45.78 bar and T1 = 13.39◦C, from diagram (pressure–
enthalpy diagram for methane), h1 and s1 are found
as follows: h1 = −75 kJ/kg, s1 = −2.18 kJ/(kg K),
P2= 45.78 bar, T2= 56◦C (turbine inlet temperature T2
is assumed as 56◦C for 78% turbine efficiency). For P2=
45.78 bar and T2 = 56◦C, from diagram, h2 and s2 are
found as follows: h2 = 40 kJ/kg, s2= −1.81 kJ/(kg K).
For P3 = 21.55 bar and T2 = 12.58◦C, from diagram,
h3 and s3 are found as follows: h3 = −52 kJ/kg, s3 =
−1.66 kJ/(kg K). At this point, P3s = P3 = 21.55 bar.
If s2 = s3s is assumed as isentropic, from diagram
(pressure–enthalpy diagram for methane), T3sand s3sare
found as follows: T3s = −1◦C, s3s = −1.81 kJ/(kg K)
and h3s = −78 kJ/kg. If the enthalpy values are
writ-ten in Eq. (1), turbine adiabatic efficiency nT is found as
follows:
nT ∼= 77.96 (as found). Total amount of preheating
gas consumption (Qcons) are calculated as follows:
Qcons= ˙Q/HHV, (2)
˙
Q = ˙mcp(T2− T1)/4.18 kcal/h, (3)
˙
m = ρQ, (4)
where Q is average gas flow for January, ˙m = 0.7163 × 423618 = 303437.5734 kg/h, ˙Q = 303437.5734 × 2.18 × (56 − 13.39)/4.18 is ˙Q = 6743123.32 kcal/h.
Accordingly, Qcons = 6743123.32/9347.2734, Qcons =
721.4 S m3/h. Total power in turbine ˙
W = ˙mcp× (T2− T3)/3600 kW,
˙
W = 303437.5734 × 2.18 × (56 − 12.58)/3600 =
7978.35 kW. (5)
If the gearbox and generator efficiency is assumed as 90%, net power ( ˙Wnet) is found as follows:
˙
Wnet= 0.9 ˙W ,
˙
Wnet= 7978.355 × 0.9 = 7180.51 kW. (6)
In this study, an energy recovery analysis was imple-mented in case the expansion turbine was replaced with the expansion valve in the RMS-A in Esenyurt, Istan-bul. This analysis was carried out using the simulation program HYSYS used in the energy sector. The heat ex-changer and the turboexpander were defined in the pro-gram. Subsequently, chromatographic structure of the gas entering the system was defined, and then Peng– Robinson model was chosen as the analysis method. Af-terwards boiler hot water inlet temperature for turboex-pander, gas inlet flow, gas inlet and outlet pressure, gas inlet and outlet temperature, and turbine adiabatic effi-ciency were defined.
Composition of gas as a percentage for Esenyurt BDİ-A station: methane = 0.932, ethane = 0.046, propane = 0.0105, i-butane = 0.0018, n-butane = 0.00180, i-Pentane = 0.000418, n-pentane = 0.000310, nitrogen = 0.00395, CO2 = 0.00154, H2O = 0, n-Hexane = 0.00023.
The turbine inlet temperature was observed to be 56◦C by virtue of the HYSYS program. It was observed that this input temperature value, which was found by looking at the P –h diagram for methane gas, is compatible with the temperature value obtained through the program.
Monthly electricity production values of the Esenyurt District Pressure Reducing Station and the required tur-bine inlet temperature values are shown in Table I. Po-tential electricity generation of the turbine is realized as 7978 kWh in the light of current data. The total gener-ated electricity energy was calculgener-ated as 7180 kWh based on the assumption that the gearbox and generator effi-ciency is 90%. Electricity production was found to be linear with the amount of gas flow as it can be seen in Table I. When the gas flow reached 423618 S m3/h, the electricity generated became 7180 kWh. The lowest elec-tricity production occurred in July when the gas flow was 125464 S m3/h and the electricity production amount
be-came 2837 kWh. It is observed that increase in P1/P2
rate causes an increase in potential electricity generation of the turbine. The average amount of electricity gener-ation during the year was calculated as 5270 kWh.
In Fig. 1 the amount of preheating gas consump-tion depending on the gas flow is shown for those two months of the year. When Fig. 1 is examined, it is seen that as the flow of gas passing through the turboex-pander increases, the preheating gas requirement also increases. At the RMS-A in Esenyurt District, when the gas flow rate reached 429626 S m3/h, the flow of
the gas spent for preheating was 721 S m3/h. The
low-est gas consumption was realized as 250 S m3/h in July
when the gas flow rate was 125464 S m3/h. When pre-heating is made in the expansion valve, the consump-tion of gas is 231 S m3/h for January. As this is an
624 M. Atmaca, Y. Uraltaş, A. Onat, C. Ezgi
TABLE I Esenyurt A type regulation and measurement station producing electricity
Month Flow [S m3/h] Energy [kWh] P1/P2 Inlet pres. [bar] Outlet pres. [bar] Inlet temp. [◦C] Turbine inlet temp. [◦C] Turbine outlet temp. [◦C] January 423618 7180 2.1 45.78 21.55 13.3 56.00 12.37 February 349541 6692 2.4 53.91 22.48 13.6 60.00 10.56 March 389526 7588 2.4 53.62 22.02 14.0 62.00 11.72 April 251725 5188 2.5 55.87 21.83 14.6 65.00 11.78 May 213374 4655 2.8 58.30 20.47 15.7 68.00 11.67 June 155707 3547 2.8 58.01 20.54 17.5 70.00 11.17 July 125464 2837 2.8 58.47 20.40 19.3 70.00 11.61 August 144715 3448 3.0 60.00 20.05 20.9 73.00 11.47 September 138244 3405 3.0 60.00 20.42 21.5 75.00 11.39 October 263562 5645 2.6 58.36 22.06 20.9 60.00 12.69 November 429626 7191 2.2 49.89 22.38 19.0 55.00 11.78 December 366302 5894 2.1 47.03 22.29 15.2 53.00 11.45 annual average 270950 5270 2.6 55.30 21.37 17.1 64.58 11.64
isentropic process, pressure decreases in the turboex-pander while enthalpy changes, and therefore work is produced between inlet and outlet point. Temperature decreases more in the turboexpander compared to the ex-pansion valve, because pressure decrease occurs between the range of 1.5◦C and 2◦C/bar, so it is seen that more preheating is involved to the preheating process in order to achieve the desired output temperature. Consumption of preheating gas was 721 S m3/h for January. As a
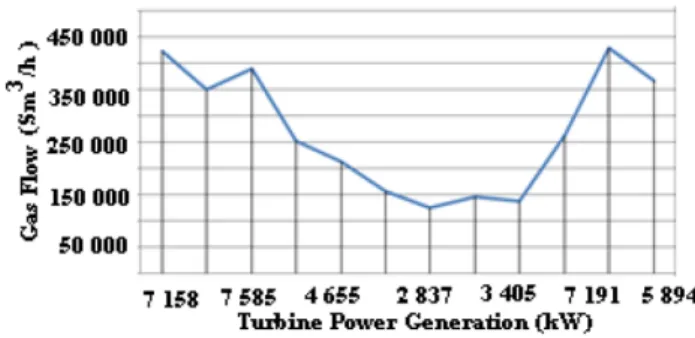
re-sult, the turboexpander has been found to have almost four times more preheating gas consumption compared to the expansion valve during the year. The amount of electricity production of the turboexpander system de-pending on the gas flow during twelve months is shown in a comparative way in Fig. 2. It was observed that the electricity production was parallel to the amount of gas flow and when the gas flow reached 429626 S m3/h the amount of electricity generated became 7180 kWh. The lowest electricity generation was realized in July when the gas flow was 125464 S m3/h. In July, electricity
pro-duction was realized as 2837 kWh.
The electricity production values for twelve months starting from the first month of the turboexpander at 78%, 82%, and 86% efficiencies is shown in a compara-tive way in Fig. 3. At each level of efficiency increase, the turbine-produced electrical generation increased linearly as can be seen in Fig. 3. Furthermore, it was determined that increase in electricity production between 168 kWh and 585 kWh took place at each four-point efficiency in-crease. Turbine inlet temperatures starting from the first month at 78%, 82%, 86% efficiencies of turboexpander were provided in a comparative way. Turbine inlet tem-perature was observed to increase linearly at each level of efficiency increase. Furthermore, it was observed that preheating temperature increased between 1◦C and 6◦C at each four-point efficiency increase. Turbine preheat-ing gas consumption comparison was made startpreheat-ing from the first month at 78%, 82%, and 86% efficiencies of the turboexpander, respectively. It was observed that pre-heating gas consumption increased between 20 S m3/h and 84 S m3/h at each four-point efficiency increase.
Fig. 1. Gas flow — pre-heating gas consumption.
Fig. 2. Flow and total produce electricity in turboex-pander.
Fig. 3. Expansion turbine efficiency–electricity gener-ation.
Energy Recovery Analysis in A-Type Pressure Regulation and Measurement Stations. . . 625 4. Conclusions
Turboexpander application was made for Esenyurt District A-type Pressure Reducing Station (RMS-A) in this study. Electricity generation value of Esenyurt Dis-trict RMS-A station, distribution of electricity produc-tion value during the year, the value of gas withdrawal within the year, and gas consumption values spent for preheating were found in this context. It was observed that when the turboexpander system was utilized instead of the expansion valve, decrease in pressure between 1.5◦C/bar and 2◦C/bar took place. It was calculated that there was almost four times more gas consumption in preheating compared to expansion valve so that the gas could reach the required pressure and temperature values at the outlet. It was observed that gas consumption and turbine efficiency changed in direct proportion. It was also observed that at each four-point efficiency increase there was gas consumption increase between 20 S m3/h
and 84 S m3/h and at each four-point efficiency increase
there was preheating temperature increase between 1◦C and 6◦C. It was determined that increase in P1/P2
ra-tio caused increase in the turbine’s potential electricity production. It is expected that an average of 5270 kWh of electricity will be generated annually if this system is installed. It was determined that electricity production increased linearly in line with the increase of the inlet gas flow. As a result, if a turboexpander is utilized instead
of the expansion valve, a substantial amount of wasted energy will be recovered. Furthermore, it is expected to provide contribution to decrease in greenhouse gas emis-sion values with the utilization of the existing wasted energy.
References
[1] Ç. Akyol, RMS-A Regulation and Measuring Station, Istanbul 2015.
[2] Ö. Deniz, M.Sc. Thesis, İstanbul Technical Univer-sity, Institute of Science and Technology, İstanbul 2014.
[3] G. Bisio,Energy 20, 161 (1995).
[4] H.P. Bloch, C. Soares, Turboexpanders and Process Applications, Butterworth, Stoneham (MA) 2015. [5] W.G. Kortekaas, C.J. Peters, J.D.S. Arons, Fluid
Phase Equilibr. 139, 205 (1997).
[6] I. Andrei, T. Valentin, T. Cristina, T. Niculae,Proced. Eng. 69, 986 (2014).
[7] A. Mırandola, L. Minca, in: Proc. 21st Intersoci-ety Energy Conversion Engineering Conf., San Diego (California) 1986, Vol. 1, p. 16.
[8] A. Mirandola, A. Macor, in: Proc. 23rd Intersoci-ety Energy Conversion Engineering Conf., Colorado 1988, Vol. 4, p. 33.