A
NEW
DIRECTIONAL ACOUSTIC LENS:
V-GROOVE LENS
A.
Bozkurt, G. Yaraliozlu,
A.
Atalar and
H.
Koymen
Bilkent University, Ankara, Turkey
06533
ABSTRACT
A new directional acoustic lens is introduced. The geometry is very similar t o the line-focus lens except the lens cavity, which is shaped as a groove with flat-bottom V cross section. T h e slanted planar edges of the groove are inclined in order t o generate waves incident on the object surface a t a critical angle. Hence, t h e edges of the groove act like two wedge transducers facing each other. The cross section of the lens is t h e same as that of the Lamb Wave Lens. Therefore, it en- joys the same sensitivity t o surface wave excitations. On t h e other hand, since the cross section remains the same along one of the lateral directions, it has directional properties very similar t o that of t h e Line Focus Beam Lens. The waves normally incident on the object surface generated from t h e flat-bottom, interfere with those a t the critical angle, giving rise t o a V(Z) effect. Calculated responses of the lens are presented for silicon (001) surface as a function of crystal orientation. T h e calculated curves are compared with mea- surement results. The leaky wave velocities are extracted from the measurement results using the conventional FFT
algorithm. A new model based algorithm is proposed for extracting the velocity information from V (
2)
data.Introduction
A directional lens such as line focus beam (LFB) lens
[I]
produce a V ( 2 ) pattern from which surface wave velocity in a particular direction can be deduced with high accuracy. T h e accuracy depends on the number of oscillations in the pattern. For high velocity materials the period is large, and thus there will be a limited number of oscillations, resulting in a low measurement accuracy. Moreover, the signal level in
V (
2)
gets smaller as the defocus distance is increased. The conventional spherical lens was originally designed for imaging purposes. After it is discovered that V ( 2 ) has unique material characterization properties, this lens is used mostly for characterization despite its deficiency in exciting leaky waves. Lamb wave lens combines the V ( 2 ) effect with its higher efficiency of leaky wave excitation. It maintains a large signal level a t an extended defocus range. However, it does not have a direction sensitivity which is required for t h e characterization of anisotropic materials.In this paper, we introduce a new directional lens, V-groove lens, with a higher sensitivity as compared to other
directional lenses. It inherits the high efficiency of the Lamb wave lens, while providing t h e high directionality of the LFB lens. First, the geometry of the V-groove lens is described and design considerations are discussed. Then, the response of t h e lens as a function of defocus distance is investigated. Theoretical simulations are performed for an anisotropic crys- tal t o deduce the accuracy of such a lens. Experimental results are presented and compared with the theory. More- over, a refinement in the procedure of extracting velocity information from
V ( 2 )
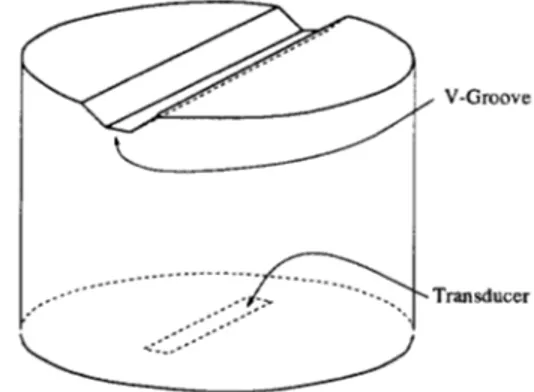
data is presented. The new proce- dure involves a model based analysis approach rather than a simple F F T analysis on the data.Figure 1: Geometry of the V-groove lens
V-Groove
Lens
V-groove lens differs from the line-focus-beam lens in the way t h e refracting element of the lens is fabricated. As opposed
t o t h e cylindrical cavity of the LFB lens, V-groove lens has a
V
shaped groove with flattened bottom as shown in Fig. 1 . Essentially, the relationship between the LFB lens and the conventional lens is the same as the relationship between V- groove lens and the Lamb wave lens [2]. In other words, leaky waves are selectively excited on the surface of the object when V-groove lens is used, while, in case of LFB lens, all of the modes are excited due to its wide angular spectrum.T h e transducer is designed so as to insonify a substantial por- tion of the groove with minimal waste of power elsewhere. The flat bottom part does not cause any refraction, and thus a part of the incident beam insonifies the object surface a t normal incidence. Symmetrical sides of the groove causes a
refraction, and hence two symmetrical beams insonify the ob- ject surface a t the same incidence angle. T h e interference of the refracted beams. which encounter leaky wave modes on the object surface, with the reference beam resulting from the specular reflection of the normally incident beam pro- duces the
V(2).
A
good match between median direction of the refracted beam and the critical angle for the object improves the measurement accuracy.Simulations and Experiments
Simulating the performance of a lens involves propagation of acoustic waves between the transducer and the refracting element. The wavefront is then propagated through the re- fracting element using ray theory. The wave front is then re- flected from object surface upon propagation in liquid. This analysis is similar to the one developed for Lamb wave lens
[a],
except for the circular symmetry. While the circular symmetry of the Lamb lens allows the use of fast Hankel transform for propagation purposes, propagation problem in V-groove lens requires the more costly two dimensional F F T . Also, the calculation of the reflection coefficient a t a liquid anisotropic solid interface is considerably more complicated 131. 0.00 -5.00m^
E h2
-10.00 -15.00 -6.000 -4.000 -2.000 0.000 2.000z
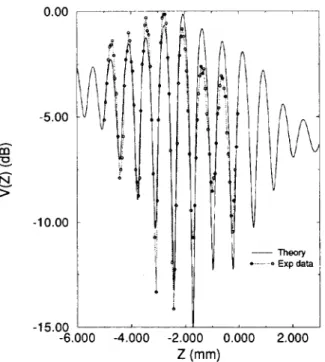
(mm)Figure 2: Calculated and measured V ( 2 ) values along [loo] direction on (001) surface of Si at f = 2 5 klHz
A V-groove lens is designed to measure surface acoustic wave velocity on silicon. Lens operates a t 25 hlHz. T h e silicon sample is a 529 microns thick silicon wafer. The Rayleigh wavelength is approximately 200 microns, and hence the
wafer thickness is large enough for measurement purposes. Water temperature was stable within 0.2 degrees. The align- ment of the lens is achieved easily by maximizing the signal from t h e flat part of the lens, since the maximum signal is reached when t h e object surface is perfectly parallel t o the flat part of V-groove.
A
simulation is done for this lens for the (001) surface of silicon as the reflector. The result- ingV(2)
curve is depicted in Fig. 2 together with the mea- surements along [loo] direction. The V ( 2 ) simulations are repeated along varying directions for the same surface of sil- icon.Leaky wave velocity extraction
T h e conventional procedure [4] adapted for extracting SAW velocity from measured V ( 2 ) data can be summarized as follows: 10 0 5 0
Y
Y
z
h 'c 0 02
-5 0Model
" ~- -10.0Z
(mm.)
Figure 3: Experimentaldata points V2(Z)-V:e,(Z) for (001) surface of Si (F=25 M H z ) and least squared fitted curve
0 Measure V ( Z ) for the object
0 Obtain a L!.e,(Z) using an object with no leaky wave generation a t the V-groove excitation range.
0 Find L"(2) - K:,(Z)
0 Filter out any unwanted interference frequencies
0 Pad d a t a with zeros
0 Use a proper window function
0 Apply
FFT
to find the period of oscillation0 Determine velocity from period
I This method yields its best results if there is only one leaky
wave mode. It is difficult t o get accurate results particularly when there are two modes with close velocities. Unfortu- nately, many anisotropic materials support pseudo surface waves along particular directions [5] with a velocity very close t o the SAW velocity. F F T algorithm gives biased results in such a case. To alleviate this problem, a n alternative proce- dure is proposed.
A
model based algorithm [6] is adopted, which suits better to the physical nature of the V ( 2 ) :5600.0 Actual o---.. .. o FFT extracted '. 5400.0 h 5200 0 \ E v .- 0 0 0 Q) 50000
-
t
-
0 Q) 5200.02
E v - o e ow
- 0 .-0
0 0-
>"
5000.0 4800 0 t L 0\
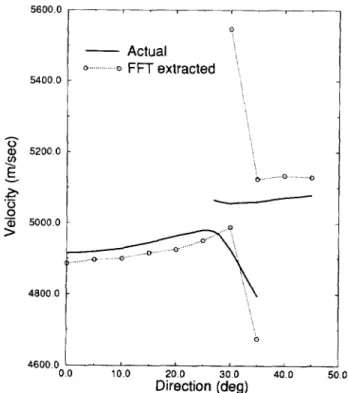
0 4600 0 0 0 10 0 200 3 0 0 400 I Direction (deg) IFigure 4: Calculated and measured velocity (using FFT
method) values on (001) surface of Si as a function of di- rection
0 Measure V ( Z ) for the object 0 Obtain a V , , j ( Z ) as above
0 Fit the model parameters t o Vre,(Z) in the least mean square sense, using Nelder-Meade simplex search.
0 Find V ' ( 2 ) - v,",,(Z)
0 Fit t h e model parameters using the same algorithm t o the squared difference. Find the period of oscillation.
0 Determine velocity from period
A
simple model is selected t o reduce the computational com- plexity of t h e search process. The model assumes uniform insonification of t h e V-groove and ignores the diffraction in t h e liquid. T h e output voltage is obtained as the absolute value of a sum of three complex terms. The first term is due t o the flat central portion of the V-groove lens and its phase is assumed to change linearly with the defocus distance. The second term arises from the specular reflection of obliquely incident waves. The change in its phase depends on the incli- nation angle of the V-groove as well as the defocus distance. Variation in its amplitude is determined from geometrical considerations. T h e last term exists only if a leaky wave is excited on the object surface. The phase of this term is as- sumed t o depend on the critical angle of the object material. Since leaky waves are assumed to decay exponentially [ 7 ] , t h e amplitude of the third term is exponentially dependent on t h e defocus distance. Copper is used as the reference material, since no leaky wave can be excited on its surfaceby this lens. Using the reference material data,
Vref(.Z),
t h e unknown parameters in the first and second term are deter- mined. T h e parameters of the third term -among them is the leaky wave velocity of the object- is subsequently deter- mined from the measured V ( 2 ) data on the object. Fig. 3 shows t h e measured squared difference data together with t h e results of the simple model whose parameters are opti- mized t o best fit the data.Si
(001)5600.0
Actual
D---.---Q Model fitted (1 st order)
5400.0
4600 0
0.0 10 0 20 0 30.0 40 0 50.0
Direction (deg)
Figure 5: Calculated and measured velocity (using model
fitting method) values on (001) surface of Si as a function of direction
T h e velocity is extracted from the measured
V(2)
d a t a for(001) surface of silicon along different directions using
FFT
method and t h e proposed method. These experimental re- sults are given in Fig. 4 along with calculated leaky wave velocities from elastic constants [8]. The estimated velocity values follows the variation predicted from tabulated elastic constants within 1%. It is interesting to note that for angles larger 25 degrees, presence of pseudo surface waves is indi- cated by an emerging extra peak in the frequency spectrum. However, the accuracy a t points where the two modes are of equal magnitude seems to be degraded.
T h e velocity estimates obtained from the same experimental d a t a using model fitting method is depicted in Fig. 5. The
model assumes a single leaky wave excitation. It can be observed t h a t the agreement between the extracted values and the calculations are significantly better, when there is no pseudo surface wave excitation. Obviously, in the presence of pseudo surface waves, a single model order can not match t h e inherent complexity of the data. Hence, the estimated velocity value falls somewhere between the two modes.
Conclusions
T h e proposed V-groove lens is proved to be a powerful tool for measuring leaky velocities with a good directional sen- sitivity. Directional properties is comparable to LFB lens while its leaky wave excitation efficiency is as good as t h e Lamb wave lens. Since its excitation angle is fixed, a given V-groove lens can only be used for a limited range of veloci- ties. Typically, for a particular material a matching V-groove lens must be used. Because of its high excitation efficiency, the modulation index in the V ( 2 ) curve maintains a high value over an extended defocus distance. This provides a high signal-to-noise ratio. Hence, a more accurate charac- terization is possible.
The best use of V ( 2 ) data requires a processing procedure which concur with nature of the physical problem. The tra- ditional approach is t o use a F F T based spectral algorithm t o find the velocities. This method yields particularly erro- neous results if there are more than one leaky wave excita- tion. The method proposed in this paper adopts a model based approach to extract velocity. T h e model makes use of all available physical and geometrical data with some un- known parameters. The unknown parameters are found a t the end of a minimization procedure which fits the measured d a t a to the model prediction. The performance of the
V-
groove lens used along with the new extraction procedure is experimentally tested on silicon. Characterization of silicon has inherent difficulties because of its relatively high SAW velocity.
As long as the surface wave velocity remains within the range dictated by the fixed inclination angle of the V-groove lens, it
is possible t o estimate the surface wave velocity as a function of orientation with a very high accuracy.
Acknowledgment
This work is supported by Turkish Scientific and Technical Research Council, TUBITAK.
References
J.
Kushibiki and N. Chubachi “Material characterization by line-focus-beam acoustic microscope,” IEEE Trans.Sonics Ultrason.. vol. 32, pp. 189-212, 1985.
A. Atalar and H. Koymen “ A high efficiency lamb wave lens for subsurface imaging,” in Proc. of IEEE 1989 UI-
trasonics Syrnposzurn, pp. 813-816, 1989.
0. Arikan, E. Teletar, and A. Atalar “Reflection coefi- cient null of acoustic waves a t a liquid-anisotropic-solid interface,” J . Acoust. Soc. A m . , vol. 85, pp. 1-10, 1989.
A. Briggs. Acoustzc Mzcroscopy. Oxford Press, Oxford, 1992.
T.C. Lim and G.W. Farnell “Character of pseudo sur- face waves on anisotropic crystals,”
J . Acoust. Soc. A m . ,
vol. 45. pp. 845-851, 1969.
S.L.
Marple Jr. Digital Spectral Analysis wzth Applica-tions. Prentice-Hall, Englewood Cliffs, 1987.
H.L. Bertoni and T. Tamir “Unified theory of rayleigh angle phenomena for acoustic beams a t liquid-solid in- terfaces,” Appl. Phys., vol. 2 , pp. 157-172, 1973.
B.A. Auld.
ume 1 . Wiley, New York, 1973.
Acoustic Fields and Waves in Solids, vol-