Load And Inflation Pressure Effects On Tractive Performance Of Tractor
Tires
Hanifi KÜÇÜKSARIYILDIZ1, Kazım ÇARMAN2
1Karamanoğlu Mehmetbey Üniversitesi Meslek Yüksekokulu, Karaman 2Selçuk Üniversitesi Ziraat Fakültesi Tarım Makineleri Bölümü, Konya
e-mail: [email protected]
Abstract
In this study, effects on tractive performance of four different axle load, three different inflation pressure and four different drawbar pull was determined.
The experiments were carried out on concrete surface in drawbar power running track. Slip, drawbar power, dynamic traction ratios and tractive efficiency as a depending on drawbar pull varied from 0.79 % to 23.54 %, from 12.1 kW to 30.1 kW, from 0.213 to 1.156 and from 0.54 to 0.97 respectively.
The effects on slip, drawbar power and tractive efficiency of dynamic axle load, inflation pressure and drawbar pull was found significant (P<0.01).
Key Words: Slip, tractive efficiency, drawbar pull, drawbar power, dynamic traction ratio. Introduction
The mechanisation investments which are suitable for the crop production benefit to the agricultural farms and its future and profits. The tractor is the most important input in the mechanisation investments, and also the selection of the suitable tractor power and size to the farms is necessary for the profit of the agricultural farms and the Turkish economy (Çarman 2005).
As energy from fosil fuel sources dwindles and subsequently becomes more expensive, the efficient utilization of energy resources becomes a major concern to agricultural production systems. The farm tractor consumes approximately 20% of the total on farm energy requirements in USA (Burt et al., 1983).Optimizing the performance of agricultural tractors could, therefore, help to minimize energy waste.
The power efficiency of pneumatic tires ranges from about 90% when operating on concrete to less than 50% when operating on loose or sandy soils. Between 20% and 55% of the energy delivered to the drive wheels of tractors is wasted. This energy is not only wasted but also the resulting soil compaction. This loss of energy by the pneumatic tire has has prompted research to determine operational parameters that could improve tractive efficiency (Burt et al., 1983). Rolling resisstance power, slipping loss power, drawbar power and transmission efficiency effect tractor efficiency. Tractor efficiency increases as increasing in drawbar pull. At the same time increasing drawbar pull increases the slipping loss power and transmission power (Kadayıfçılar 1991). The ratio of the maximum drawbar pull to the tractor weight is known as dynamic drawbar pull and it is a very important technical criteria in comparison of the tractors.
The tractive characteristics of a tire depend on the type and condition of the soil, the tire parameters, and tire loading. The most important factor is the weight on the driving wheels, which must match the power available, therefore, the tractors manufacturers increased the weight on the driving wheels . Pneumatic tires in soil are usually operated between 10 and 20 % travel reduction, it is generally accepted that below 5% the drive tire safety is too low, and above 25% the power losses an tire wear are too high (Taylor 1985).
Lyne et al. (1984) reported on the effect of tire and engine parameters on tractive efficiency. They used 18.4R30 radial ply tires on tilled soil surface. Four levels of static load and inflation pressure were used. The tractive efficiency tended to increase as static load increased for a given inflation pressure. However this effect was not consistent. Tractive efficiency tended to decrease as inflation pressures increased, but minimally in some instances. Their work suggests tractive efficiency is affected by an interaction between static load and inflation pressure.
In this study, the effect on the tractive performance of four different axle loads, three different inflation pressures and four different drawbar pulls was determined.
Material And Methods
This study was made in traction test running track of Agricultural Tools and Machines Test Center of Ministry of Agriculture. Traction test running track is approximately 400 meters long and has a concrete surface. There is a 65 meters long tractive test tunnel which is isolated from atmosphere (Closed Area) in the running track. The concrete surface was processed for increasing the friction of the tires.
In the experiment, New Holland TD 60 D-2 WD model tractor which was produced by Turk Tractor, was used. The tractor which was tested appropriate to the “Agricultural Tractors Official Test OECD Standard Code (Code-2)”, was used.
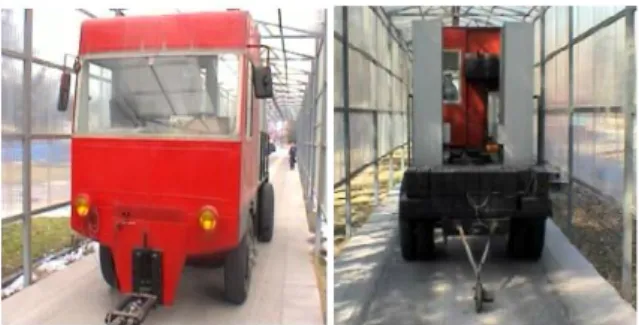
The traction car which was produced specially is shown in Figure 1. The command cabinet which is in front of the traction car, has two parts which are called operator part and command part. Rotation, fuel gauge, break pedal and shifting gate with three shifts are placed in the command part. A place for laptop, convertor and a potentiometer which is conducted to a generator are placed in the operator part. Electrical energy is provided with two batteries.
Figure 1. The front and the rear views of the traction car
The dinamometer was binded on the tool with two springs and on the drawbar shown in Figure 2. The tail beam revolution sensor, the speedometer which is in the rear part of the vehicle and the sensor which is in the dinamometer are conducted to the laptop by using a converter. Drawbar power, velocity of the vehicle, slipping values are being read by using a computer program (Figure 3).
Figure 2. Traction two springs tool which was used in the experiment
Figure 3. The computer program monitor view which was used in the experiment
The power loss which is conducted to the tires from the engine is taken %10, the equation of the tractive efficiency is shown below (Macmillan, 2002): e ç ç
N
N
*
9
.
0
During the experiments 14-9 R30 [129 A8] tire was used. Radius of the wheel was measured for each axle load and inflation pressure at zero net traction. Because of this consistence oil was applied on the surface of the drive wheel. The drive wheel was provided the revolution 4 times in straight line in low speed. The contact points of the wheel were measured with ruler (in meters) and the aritmatic avarage was found. The value of this measurement was calculated with the computer program.
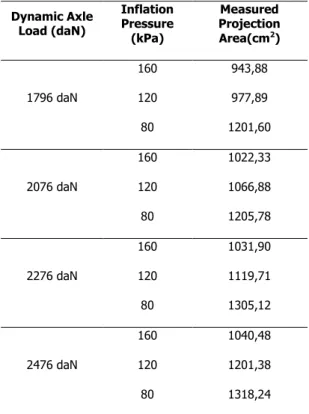
For measuring the projection area of the tires, surface of the tire was painted from contact point by lifting jack then lowered on the white paper which was placed on the surface. This process was being continued 4-5 times and every time the tire was rolled 5-10°. The projection areas which were scanned on the white paper, were measured by use of SigmaPro Scan program (Çarman 2005). In table 1, the changes in the projection areas of tire depending on the dynamic axle load and inflation pressure were given.
Tests were carried out at four axle load (1796, 2076, 2276 and 2476 daN) and three inflation pressure (80, 120 and 160kPa) on the concrete surface. The velocities in the agricultural working were used as tractor velocity, 2-3 gear level was chosen. This gear level nearly provides 7.5 km/h velocity.
Table 1. The changes in the Projection Areas (Concrete surface) as a depending on the Dynamic Axle Load and Inflation Pressure Dynamic Axle Load (daN) Inflation Pressure (kPa) Measured Projection Area(cm2) 1796 daN 160 943,88 120 977,89 80 1201,60 2076 daN 160 1022,33 120 1066,88 80 1205,78 2276 daN 160 1031,90 120 1119,71 80 1305,12 2476 daN 160 1040,48 120 1201,38 80 1318,24
The chosen drawbar pull values were loaded manually to the tractor which was in full throttle mode and in the chosen gear level, this load was made by the help of potantiometer which was placed in the traction car.
The statistical analyses were made for determining the effects on the tractive efficiency of axle load and inflation pressure (Düzgüneş et al., 1987). Minitab program was used for obtaining the results of variance analysises and LSD test.
Results And Discussion
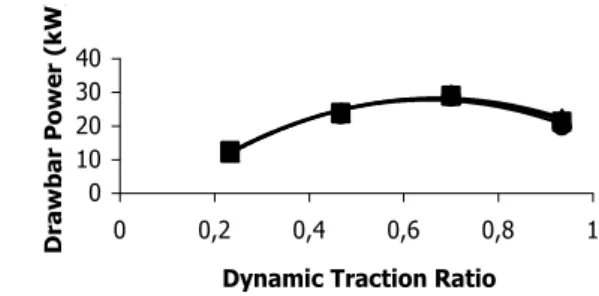
The relationship between the drawbar power and the dynamic traction ratio defined as the ratio of the drawbar power to the axle load is given in Figure 4...7. As decreasing dynamic axle load, dynamic traction ratio increased. Dynamic traction ratio varied from 0.213 to 1.156. In the values 0.626 to 0.867 of the dynamic traction ratio, maximum drawbar power was obtained. As increasing in dynamic axle load drawbar power increased. When the axle load increases, maximum drawbar power can be obtained in lower dynamic traction ratios.
0 10 20 30 40 0 0,2 0,4 0,6 0,8 1 1,2
Dynamic Traction Ratio
Dra w b a r P o w er ( kW )
Figure 4. Drawbar Power Change Belongs To The Dynamic Traction Ratio in 1796 daN Axle Load (●:160
kPa ■:120 kPa ▲: 80 kPa)
0 10 20 30
0 0,5 1 1,5
Dinamic Traction Ratio
Dr aw b ar P o w e r (k W ) Fi gure 5. Drawbar Power Change Belongs To The Dynamic Traction Ratio in 2096 daN Axle Load (●:160 kPa ■:120 kPa ▲: 80 kPa)
0 10 20 30 40 0 0,2 0,4 0,6 0,8 1
Dynamic Traction Ratio
Dra w b a r P o w e r ( kW )
Figure 6. Drawbar Power Change Belongs To The Dynamic Traction Ratio in 2296 daN Axle Load (●:160 kPa ■:120 kPa ▲: 80 kPa)
0 10 20 30 40 0 0,2 0,4 0,6 0,8 1
Dynamic Traction Ratio
Dra w b a r P o w e r ( kW )
Figure 7. Drawbar Power Change Belongs To The Dynamic Traction Ratio in 2496 daN Axle Load (●:160 kPa ■:120 kPa ▲: 80 kPa)
Not much changes was observed in the relationship between dynamic traction ratio and drawbar power during decreasing inflation pressure. For each inflation pressure, similar values were obtained.
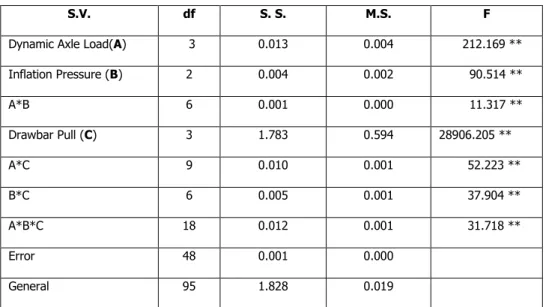
Tractive efficiency values varied from 0.59 to 0.935 depending on the drawbar pull. An increase of approximately of 300% in drawbar pull resulted in an tractive efficiency increase of 55%. Variance analysis and LSD tests results made on tractive efficiency values was given in Table 2. The variance analysis results showed that the effect on the tractive efficiency of independent variables is significant (P<0.01).
Table 2. Variance Analysis and LSD Test Results
S.V. df S. S. M.S. F
Dynamic Axle Load(A) 3 0.013 0.004 212.169 ** Inflation Pressure (B) 2 0.004 0.002 90.514 ** A*B 6 0.001 0.000 11.317 ** Drawbar Pull (C) 3 1.783 0.594 28906.205 ** A*C 9 0.010 0.001 52.223 ** B*C 6 0.005 0.001 37.904 ** A*B*C 18 0.012 0.001 31.718 ** Error 48 0.001 0.000 General 95 1.828 0.019 ** Statistically important in the level of %1 (P<0.01)
* Statistical difference between the avarages which are shown with he same letters are not important
The tractive efficiency values increased as increasing in the axle load. For an increase of approximately 38% in dynamic axle load, tractive efficiency increased about 4%. This situation was caused the increase in the projection area and the friction between tire and concrete surface as increasing axle load. The variance analysis results showed that the effect on tractive efficiency of the axle load was significant (P<0.01)(Table 2).
The tractive efficiency values decreased with the increasing inflation pressure. The between inflation pressures values of 80 kPa and 120 kPa was not found an important difference as statistically. At inflation pressure of 160 kPa, tractive efficiency was found at the lowest level.
Zombori (1967) and Lee and Kim had found the same results in 1998. The variance analysis results showed that the effect of inflation pressure on the tractive efficiency is significant.
Non linear regression analyses of experimental data showed a good relationship with a high correlation coefficient (R) between tractive efficiency and axle koad(W) to inflation pressure(P).
ç
=1.192 - 0.0002 W + 0.0003 P - 0.00003 P2 R=0.94Factor A(*) Factor B(*) Factor C(*)
0.794 a 0.800 a 0.912 a 0.805 b 0.813 b 0.935 b 0.809 c 0.813 b 0.797 c 0.826 d 0.590 d LSD % 5: 0.003 LSD % 5: 0.002 LSD % 5: 0.003
Conclusions
The following conclusions were drawn from this study.
1. Maximum tractive efficiency was obtained as 97%, at inflation pressure of 120 kPa and dynamic axle load of 2496 daN.
2. Dynamic axle load of tire was the major contributory factor on traction performance as compared to inflation pressure
3. Traction performance was increased more at the higher axle load because of a increase in the holding on forces.
4. For a given drawbar pull, the tractive efficiency of radial – ply tire can be maximised by selecting appropriate levels of dynamic axle load.
5. Within the inflation pressure range of 80 to 120kPa, there is no effect of inflation pressure on the tractive efficient.
References
Anonim, 2004. Tarım ve Köyişleri Bakanlığı Tarım Alet ve Makinaları Test Merkezi Müdürlüğü. Deney Raporu. Rapor No:937/2217 TGK 14, Ankara. Anonim, 2008. DİE Motorlu Kara Taşıtları İstatistikleri. Haber
Bültenleri Sayı 33, Ankara.
Burt, E. C., Lyne, P. W. L., Meiring, P., Keen, J. F., 1983. Balast and Inflation Effects on Tire Efficiency. Transactions of The ASAE. 1352-1354
Çarman, K., Şeflek, A.Y., 2005. Lastik Defleksiyonu-Temas Alanı İlişkisinin Değerlendirilmesi. Tarım Makineleri Bilimi Dergisi, 1(1), 49-54, Konya Çarman, K., Şeflek, A.Y., 2005. Lastiklerin Çeki Performansı
İçin Bulanık Uzman Sistem Tasarımı, Tarım Makineleri Bilimi Dergisi, 1(1), 63-68, Konya Düzgüneş, O., Kesici, T., Kavuncu, O., Gürbüz, F., 1987.
Araştırma Deneme Metotları (İstatistik Metotları II). Ankara Üniversitesi Ziraat Fakültesi Yayınları. Yayın No: 1021, Ders Kitabı, 295, Ankara
Kadayıfçılar, S., Kadayıfçılar, S., 1991. Tarım Traktörlerinin Tasarım Esasları.Türkiye Zirai Donatım Kurumu Yayınları. Yayın No:55, Ankara
Lee, D.R., Kim, K.U., 1998. Effect of Inflation Pressure On Tractive Performance of Bias-Ply Tires. J. Terramechanics, 34(3): 187-203
Macmillan, R.H., 2002. The Mechanics of Tractor-Implement Performance, Universty of Melbourne
Sabancı, A., Akıncı, İ., Yılmaz, D., 2003. Türkiye’deki Traktör Parkı ve Bazı Teknik Özellikleri, Tarımsal Mekanizasyon 21. Ulusal Kongresi, Konya Taylor J.H., 1985. Controlled Traffic Aspin-off Soil Dynamic
Research. International Conference on Soil Dynamics. Alabama.
Zombori, J., 1967. Drawbar Pull Tests of Various Traction Devices on Sandy Soils, J. Terramechanics 4 (1):9-17