a thesis
submitted to the department of computer engineering
and the institute of engineering and science
of bilkent university
in partial fulfillment of the requirements
for the degree of
master of science
By
¨
Ozlem Nurcan Subakan
August, 2005
Prof. Dr. ¨Ozg¨ur Ulusoy (Advisor)
I certify that I have read this thesis and that in my opinion it is fully adequate, in scope and in quality, as a thesis for the degree of Master of Science.
Asst. Prof. Dr. ˙Ibrahim K¨orpeo˘glu
I certify that I have read this thesis and that in my opinion it is fully adequate, in scope and in quality, as a thesis for the degree of Master of Science.
Asst. Prof. Dr. H. Murat Karam¨uft¨uo˘glu
Approved for the Institute of Engineering and Science:
Prof. Dr. Mehmet B. Baray Director of the Institute
WITH INVERTED INDEXING
¨
Ozlem Nurcan Subakan M.S. in Computer Engineering Supervisor: Prof. Dr. ¨Ozg¨ur Ulusoy
August, 2005
Collectively, a population contains vast amounts of knowledge and modern communication technologies that increase the ease of communication. However, it is not feasible for a single person to aggregate the knowledge of thousands or millions of data and extract useful information from it. Collaborative infor-mation systems are attempts to harness the knowledge of a population and to present it in a simple, fast and fair manner. Collaborative filtering has been suc-cessfully used in domains where the information content is not easily parse-able and traditional information filtering techniques are difficult to apply. Collabora-tive filtering works over a database of ratings for the items which are rated by users. The computational complexity of these methods grows linearly with the number of customers which can reach to several millions in typical commercial applications. To address the scalability concern, we have developed an efficient collaborative filtering technique by applying user clustering and using a specific inverted index structure (so called cluster-skipping inverted index structure) that is tailored for clustered environments. We show that the predictive accuracy of the system is comparable with the collaborative filtering algorithms without clustering, whereas the efficiency is far more improved.
Keywords: Collaborative filtering, recommender systems, clustering, inverted files, performance evaluation.
EV˙IR˙ILM˙IS
¸ D˙IZ˙IN YAPILI VE TOPAKLAMA TEMELL˙I
˙IMECEL˙I S ¨UZGEC¸LEME
¨
Ozlem Nurcan Subakan
Bilgisayar M¨uhendisli˘gi, Y¨uksek Lisans Tez Y¨oneticisi: Prof. Dr. ¨Ozg¨ur Ulusoy
A˘gustos, 2005
C¸ a˘gımız toplumları, ileti¸simi kolayla¸stıran b¨uy¨uk ¨ol¸cekli bilgi ve ¸ca˘gda¸s teknolo-jilere sahiptirler. Ancak, bir ¸sahsın ¸cok b¨uy¨uk miktarlardaki verileri tek ba¸sına k¨umeleyip bu verilerden yararlı bilgiler elde etmesi olanaklı de˘gildir. ˙Imeceli bilgi sistemleri bir toplumun bilgilerini basit, hızlı ve adil bir ¸sekilde bir araya toplama ¸cabalarının b¨ut¨un¨ud¨ur. ˙Imeceli s¨uzge¸cleme, bilgi kayna˘gının kolayca ayrı¸stırılamadı˘gı ve geleneksel bilgi s¨uzge¸cleme tekniklerinin uygulanmasında zor-luklarla kar¸sıla¸sıldı˘gı alanlarda ba¸sarıyla uygulanmaktadır. ˙Imeceli s¨uzge¸cleme, kullanıcılar tarafından oylanan bir madde de˘gerlendirme veri tabanı ¨uzerinde ¸calı¸smaktadır. Bu y¨ontemlerin i¸slemsel karma¸sıklıkları tipik ticari uygulamalarda milyonları bulabilecek kullanıcı sayısına do˘grusal orantılı olarak artmaktadır. Bu t¨ur ¨ol¸ceklenirlik kaygılarını ortadan kaldırmak i¸cin, kullanıcı topaklaması uygu-layan ve topaklanmı¸s ortamlara uydurulmu¸s belirli evirilmi¸s dizin yapısında olan (topak atlamalı evirilmi¸s dizin yapısı da denebilir) verimli imeceli s¨uzge¸cleme tekni˘gini geli¸stirdik. Bu sistemin ¨ong¨or¨uc¨u do˘grulu˘gunun topaklama uygu-lanmayan imeceli s¨uzge¸cleme algoritmalarıyla aynı ¨ol¸cekte olmasına ra˘gmen verimlili˘ginin ¸cok daha iyile¸stirilmi¸s oldu˘gunu g¨osterdik.
Anahtar s¨ozc¨ukler : ˙Imeceli s¨uzge¸cleme, tavsiye sistemleri, topaklama, evirilmi¸s sistemler, ba¸sarım analizi.
First and foremost I would like to thank to my supervisor Prof. Dr. ¨Ozg¨ur Ulusoy, for giving me the invaluable chance of working with him. He has always encouraged me genuinely and believed me right from the beginning. They are absolutely his exceptional guidance, most pleasant personality and traits as a researcher and advisor what made this graduate study enjoyable and what made others jeaolus.
A gigantic amount of thanks goes to ˙I. Seng¨or Altıng¨ovde. Without his motivation, assistance, discussions, “meetings at anywhere and anytime”, and all his support, this thesis would not be possible. I owe him a lot.
I am grateful to all of my friends for their motivating and caring friendships, just-in-time buggings and debuggings, and for the significance they brought in my life.
Last, but not least, I want to thank to my family who have been very support-ive and encouraging through my long trek, and always have gsupport-iven me the strength when I needed it, they were never afraid to push me and give their opinions even on things they did not understand.
1 Introduction 1
1.1 Common Methods to Handle Information Overload . . . 2
1.1.1 Information Retrieval . . . 2
1.1.2 Content Based Filtering . . . 3
1.1.3 Collaborative Filtering . . . 3
1.2 Motivation . . . 4
1.3 Overview of the Thesis . . . 6
2 Background and Related Work 7 3 Methodologies 22 3.1 Cluster Based Collaborative Filtering with Cluster-Skipping In-verted Index Structure . . . 23
3.1.1 Clustering Techniques . . . 26
3.1.2 File Structures . . . 31 3.2 Hybrid Filtering with Cluster-Skipping Inverted Index Structure . 38
4 Experiments and Results 40
4.1 Implementation Details . . . 42
4.2 Experimental Setting . . . 45
4.3 Efficiency and Effectiveness . . . 45
4.4 MoRec: MOvie RECommendation System . . . 53
5 Conclusion 60
2.1 Clustering methods . . . 11
2.2 Similarity measures . . . 14
3.1 Example of a k-means clustering . . . 26
3.2 Example of a D matrix . . . 29
3.3 C3 M . . . 30
3.4 Neighhborhood computation for collaborative filtering with in-verted indexing . . . 32
3.5 Inverted file structure with skips . . . 34
3.6 Document matrix . . . 35
3.7 IC- Inverted centroids structure . . . 36
3.8 Cluster-skipping inverted index structure . . . 37
4.1 Document vector format . . . 43
4.2 Inverted Index with skipping data format . . . 44
4.3 Modules of the System . . . 46
4.4 Index page of MoRec system . . . 55
4.5 Sign-up page of MoRec system . . . 56
4.6 A user homepage in MoRec system . . . 57
4.7 Prediction on a movie in MoRec system . . . 58
4.1 CBR - Users : Collaborative filtering . . . 49
4.2 CBR - Centroids : Collaborative filtering . . . 49
4.3 CBR - Users : Hybrid filtering . . . 49
4.4 CBR - Centroids : Hybrid filtering . . . 50
Introduction
Recent years have brought about the exponential growth of the volume of ev-eryday things with the developments in science and technology. The number of products, news, movies, music, books, and the flow of papers is incredibly huge. We are truly in an “information age”. People are overwhelmed when browsing through today’s information ocean and could not possibly filter through the items in order to select the ones they actually want and need. Which papers should I read to learn about that area? Which movies should I watch? Which books should I buy? People handle this information overload through their own effort. They take into account the recommendation of other people for movies, CDs, books, music, etc. by the word of mouth, by reviews, by surveys, etc. However with the explosive growth of the information, this way of filtering becomes less and less a factor. As the world becomes more digital and interactive, more and more options will become available. We then will need much more time and effort than we can dedicate in order to face this information process.
The field of information filtering, in general terms, attempts to automate this process by supporting people by recommending the items they would really want and need and eliminating the things that they do not want to be bothered with. Currently, the application domain of recommendation is also very wide: news [6], research papers [29], music [36], radio [20], movies [30], Web pages [41], jokes [19], etc.
1.1
Common Methods to Handle Information
Overload
Currently, there are three different techniques commonly used to tackle the infor-mation overload challenges: Inforinfor-mation Retrieval (IR), Content Based Filtering (CBF) and Collaborative Filtering (CF).
1.1.1
Information Retrieval
“Information retrieval is the art and science of searching for infor-mation in documents, searching for documents themselves, search-ing for metadata which describes documents, or searchsearch-ing within databases, whether relational stand alone databases or hypertext net-worked databases such as the Internet or intranets, for text, sound, images or data.”1
1
In that sense, IR focuses on allowing users to express queries, and then se-lect the items that match a topic of interest. Internet search engines such as Google [18] and Yahoo! [42] are popular information retrieval systems. With the exponential expansion of the Internet, such search engines may return millions of pages for one keyword search. Each year, journals, conferences and magazines report on thousands of researches. Intrinsically, retrieving the most relevant in-formation from the Web is still difficult.
1.1.2
Content Based Filtering
This is the common and obvious technique used in this domain and also called information filtering. The filter selects the items for the user’s consumption based upon the correlations between the syntactic and semantic content of the items and the user’s preferences. In content based filtering, the items must be in machine parse-able form, or features must have been assigned to the items manually. In that sense, application domain is restricted. System Lira which recommends Web pages is an example of content based filter [4].
1.1.3
Collaborative Filtering
Collaborative filtering is a popular technique for information overload which has been developed over the past decade. It works over a database of ratings for items by users. It is based on the collaboration among the users, ideally like-minded users. Therefore, collaborative filtering is also called social filtering. There are generally two cases: It either provides prediction for some item or outputs a recommendation (suggestion) list for some user based on the similarities between
user rating histories. The logic behind collaborative filtering based systems is that each user belongs to a community of like-minded people; hence the items favored by these users can be used to form predictions or suggestions. A collaborative filtering based system maintains a user profile database, which records each user’s interests (positive and negative) in specific items. Then it compares the active user’s profile to all the other profiles and weighs each profile for its degree of similarity with the active user’s profile. Finally, the system considers a set of the most similar profiles and uses information contained in them to recommend items to the users. Collaborative filtering has been successfully used in domains where the information content is not easily parse-able and traditional information filtering techniques are difficult to apply [32].
1.2
Motivation
As we have discussed above, the main task in collaborative filtering systems is defining a peer group and predicting the votes for the active user effectively and efficiently. When a collaborative filtering system just starts, there does not exist enough ranking data and it is hard to find the peer groups, so the accuracy of the recommendation will not be good. After some time, when the database becomes bigger, the efficiency of the system is influenced since the collaborative filters need more time to scan the database to find the like-minded people. Therefore, the major challenges for collaborative filtering are the effectiveness and the efficiency. This thesis presents cluster based collaborative filtering with inverted indexing and a hybrid approach that combines collaborative filtering with content based filtering by a two-stage clustering based on first the attributes of the items to
be recommended and then the users’ profiles. Our approach is better than the current social filters in terms of efficiency and it shows comparable accuracy.
The contributions of this thesis are as follows:
• We improve the efficiency of collaborative filtering by applying user cluster-ing and uscluster-ing a specific inverted index structure (so called cluster-skippcluster-ing inverted index structure), that is tailored for clustered environments. We show that the predictive accuracy of the system is comparable with the collaborative filtering algorithms without clustering, whereas the efficiency is far more improved.
• We present a hybrid filter which combines content based filtering with col-laborative filtering by a two-stage clustering, i.e., first clustering the items and then imposing user clusters on top of these item clusters. Although clustering has been applied for users and items in previous works [39], and inverted index structure for collaborative filtering has been adopted in a nonclustered environment in a very recent work [14] separately, we are not aware of any other studies that combine user clustering with an inverted index structure.
• We choose our application domain as movie recommendation systems. Ex-perimental results demonstrate the capabilities of the proposed technique and its potential for immediate application. A prototype of the system, namely MoRec, is currently in use.
1.3
Overview of the Thesis
The remainder of the thesis is organized as follows. In Chapter 2, we discuss pre-vious research in this area. In Chapter 3, we describe cluster based collaborative filtering with inverted indexing and hybrid filtering. In Chapter 4, we provide the experimental settings, and present the results for the proposed approaches. In the last chapter, we detail possibilities for future work for the system and for recommendation systems in general, and present our conclusions.
Background and Related Work
The concept of collaborative filtering descends from the work in the area of in-formation filtering. The term collaborative filtering was introduced by Goldberg et al. [17] who published about collaborative filtering techniques in the filtering of information. They developed a system called Tapestry for filtering emails. Tapestry accepted the ratings or annotations of the users for the items, in this case electronic documents such as emails and Netnews. As users read documents they attach annotations to the documents. The filters that search the annotations were however constructed by the user, using complex queries. The collaborative filtering provided by Tapestry was not automated and required users to make complex queries. The query may involve keywords, subject, authors, etc. and the annotations given by the people. In this system, you still had to know who the people are with tastes like yourself.
First automated collaborative system was introduced by GroupLens which provided personalized predictions for UseNet news articles using a neighborhood
based algorithm. It used Pearson correlations to weigh user similarity, used all correlated neighbors and presented a weighted average of deviations from the neighbor’s mean as the final prediction [32]. 1
In 1996, interest in collaborative filtering led to a workshop on the topic at the University of California, Berkeley. The results of this workshop led to Communications of the ACM special issue on recommender systems, the term was introduced by Resnick and Varian [33]. Resnick and Varian define a rec-ommender as a system which accepts user models as input, aggregates them, and returns recommendations to users. Two early collaborative filtering recom-mender systems were Firefly and LikeMinds. Firefly evolved from Ringo [36] and HOMR (Helpful OnlineMusic Recommendation Service) and allows a website to make intelligent book, movie, or music recommendations 2
. Firefly’s underlying algorithm is now used to power the recommendation engines of sites such as Bar-nesandNoble.com. LikeMinds was acquired by MacroMedia. Various commercial sites make use of collaborative based IF, including CDNow.com, reel.com, and Amazon.com. Another example for collaborative filtering based systems is the FAB system, which is a Web page recommendation system that computes the similarity between user profiles to identify the advisors for active users [3]. In FAB system, Web pages that are highly rated by the advisors are recommended to the active user. WebWatcher is another example of collaborative filters [27]. After been fed some information, WebWatcher can accompany the users about which links to take from a Web page on a website based on a short description of the user’s interest which is learned from the user when entering the site. By tagging each page the interests of all users who went to this page, the system is
1
GroupLens technology is commercially available through Net Perceptions.
2
able to compare a user’s interest with this community interest and recommend whether to follow the link going to that page.
Collaborative approaches constitute the main thrust of current recommender systems research. Once users are modeled, the process of collaborative filtering can be viewed operationally as a function which accepts a representation of users and items as input and returns a recommended subset of those items as output. Since people’s likes and dislikes are naturally not orthogonal it can be claimed that collaborative filtering for recommendation is an effective technique.
Although there seems to be an increasingly strong demand for collaborative filtering techniques, only a few different algorithms have been proposed in the literature thus far, and there have been limited published results on the rela-tive performance of various algorithms used in collaborarela-tive filtering systems. Currently, the algorithms can be classified into memory-based and model-based algorithms [8]. Model-based collaborative filtering algorithms provide item rec-ommendation by first developing a model of user ratings whereas memory-based algorithms utilize the entire user-item database to generate a prediction. Model-based algorithms require more time to train but can provide predictions in shorter time in comparison to memory-based algorithms. Memory-based algorithms re-peatedly scan the preference (or profile) database to locate the peer groups for the active users. A prediction is then computed by weighing the votes of the users in the peer groups. The people in the peer groups are identified based on their similarity in preferences to the active user in-memory. Then, different al-gorithms are employed to provide a prediction or a top-N recommendation list for the active user. Consequently, these algorithms can be equivalently called
correlation-based or nearest-neighbor collaborative filters. This structure is dy-namic and immediately reacts to changes in the user database. Every new rating added to the user database is included in the neighborhood calculation, since similarities between users are calculated in memory when needed. Model-based systems use a probabilistic approach and compute the expected value of a user prediction, given his/her ratings on other items. In terms of accuracy, model based algorithms performs as well as memory based ones [8]. These algorithms do not suffer from memory bottlenecks found in memory based predictions. How-ever, the inherent static structure of these techniques makes it difficult to update the model without rebuilding it. The model building process is performed by different machine learning algorithms such as Bayesian network, clustering, and rule-based approaches. The Bayesian network model [8] formulates a probabilis-tic model for collaborative filtering problem. The rule-based approach applies association rule discovery algorithms to find association between co-purchased items and then generates item recommendation based on the strength of the as-sociation between items. The clustering model treats collaborative filtering as a classification problem [39], and works by clustering similar users in the same class and estimating the probability that a particular user is in a particular class, and computes the conditional probability of ratings.
In general terms, clustering is the unsupervised division of data into group of similar objects. In our case, either people or items or both are grouped into clusters based on their similarity of interest. Some systems cluster items based on user rating data [31]. Some others cluster users based on a model; generally com-pute conditional probabilities of votes for certain items for each cluster, estimate probability distributions for the active user for being in each cluster, and return weighted sum of the votes. Also there exist models which cluster both users and
Figure 2.1: Clustering methods [25]
items together simultaneously without assuming that each user and item should only belong to a single cluster [37]. Besides, some approaches tend to cluster the items returned as a result of a user query in an information retrieval system, which may be called post-retrieval clustering [38].
There are many different ways to express the clustering problem. For instance, the clusters that are identified may be exclusive, so that every object belongs to only one group. Or, they may be overlapping, so that one object may fall into several clusters, or they may be probabilistic, where an instance belongs to each group according to a probability, or they may be hierarchical, such that there is a rough division of the objects into clusters at a high level [25]. Figure 2.1 classifies several clustering methods.
In hierarchical clustering the data are not partitioned into a particular cluster in a single step. Instead, a series of partitions takes place, which may run from a
single cluster containing all objects to n clusters each containing a single object. The end result of the algorithm is a tree of clusters called a dendrogram, which shows how the clusters are related. By cutting the dendrogram at a desired level, a clustering of the data items into disjoint groups is obtained. Partitional clus-tering, on the other hand, attempts to directly decompose the data set into a set of disjoint clusters. They obtain a single partition of the data instead of a clus-tering structure, such as the dendrogram produced by a hierarchical technique. Partitional methods have advantages in applications involving large data sets for which the construction of a dendrogram is computationally expensive.
The popular clustering algorithms used in this domain are k-nearest neighbor and k-means. The K-means algorithm is based on a very simple idea: Given a set of initial clusters, assign each point to one of them, and then each cluster center is replaced by the mean point on the respective cluster. These two simple steps are repeated until convergence. A point is assigned to the cluster which is close in Euclidean distance to the point. It is easy to implement but has two drawbacks. First, it can be slow since in each step the distance between each point to each cluster has to be calculated, which can be expensive in the presence of a large dataset. Second, this method is sensitive to the provided initial clusters. The goal of k-nearest neighbor clustering method is to simply separate the data based on the assumed similarities between various classes. It finds the k observations in the learning set that are closest to some particular item and predicts the class of that item by majority vote, i.e., chooses the cluster that is most common among these k neighbors.
Another clustering method is Cover-Coefficient Based Clustering, shortly C3
that belong to only one cluster each. It chooses a set of seed items that are later used as centroids, and assigns each non-seed item to a cluster by calculating the similarity of the document with each centroid. The document is then placed into a cluster whose centroid is most similar to it [12].
Cover Coefficient, CC is the base concept of the C3
M clustering algorithm. CC concept serves:
1. Identifying the relationships among documents of a database by means of a matrix, the so-called CC matrix.
2. Determining and calculating the number of clusters that a document database will have.
3. Selecting cluster seeds using a cluster seed power. 4. Forming clusters with respect to C3
M, by applying the concepts 1-3. 5. Correlating the relationships between clustering and indexing.
During clustering and query/user cluster matching, based on the attribute val-ues, the distances between the objects have to be determined. For this purpose, several distance measures, i.e., metrics on the feature space are used to evaluate the similarity of the patterns. Some of these measures are Euclidean distance, Manhattan distance, Mahalanobis distance, cosine coefficient, Dice Coefficients, Jaccard Coefficient, Hamming distance, Pearson Correlation Coefficient and vec-tor similarity as illustrated in Figure 2.2 .
The cosine coefficient, Pearson correlation and the Euclidean distance are the measures that have been commonly used. They work well when the data set has
Figure 2.2: Similarity measures [25]
compact or isolated clusters [38]. One way of computing the similarity between two items is to treat each item as a vector in the space of users and use the cosine measure between these vectors as a measure of similarity. Formally, if R is the n×m user-item matrix, then the similarity between two items x and y is defined as the cosine of the n dimensional vectors corresponding to the xth and yth column of matrix R. The cosine between these vectors is given by
sim(x, y) = cos (~x, ~y) = ~x · ~y k~xk2· k~yk2
(2.1)
The most common measure for calculating the similarity is the Pearson cor-relation algorithm. Pearson corcor-relation measures the degree to which a linear relationship exists between two variables. The Pearson correlation between users a and i is defined as in [8] w(a, i) = P j(va,j − ¯va)(vi,j− ¯vi) q P j(va,j − ¯va)2Pj(vi,j− ¯vi)2 (2.2)
where va : profile for user a (all votes of user a)
va,j : user a’s vote for item j
¯
va : mean value of the votes for user a
j : index that runs over all intersecting items in two profiles, i.e. j ∈ {va∩ vi}.
Once clusters are created, recommendations are produced, which can be of two types, given a set of ratings for that user and other users in the system. Prediction is a numerical value expressing the predicted score of the item for the active user. Recommendation list is a list of N products that the system believes the user will like the most. Simply, a prediction system can be extended to pro-vide recommendations by predicting the user’s ratings for all items that have not yet been rated and returning the top-rated items. There are several prediction algorithms in the literature. SWAMI, a research conducted for collaborative fil-tering algorithm development at University of California, Berkeley, exploits three prediction algorithms, namely a Pearson correlation-based method, the support vector method, and a scalable Pearson correlation-based method that uses cluster-ing to improve scalability and accuracy [16]. Correlation-based prediction is one of the mostly used methods in collaborative filtering applications. The underly-ing idea in correlation-based method is to compute a user’s predicted ratunderly-ing of an item as a weighted average of the ratings given to that item by other users. Rather than sum over all of the users in the system to generate the prediction, the algorithm [32] only considers the neighborhood of users who are well correlated with the current users. This is more efficient, since the average is computed over a much smaller set of values, and more accurate, since the votes of potentially
large numbers of poorly correlated users do not affect the current user [22]. Sup-port vector method views the prediction problem as a classification task. It uses existing users to identify voting classes, and then uses these classes as a basis for prediction. In order to overcome the scalability problems with Simple Pearson method, the users are clustered according to their correlation level. Hence, the clusters can be used to find out the neighbors of a specified user. As clustering algorithm, a method similar to k-means algorithm is used. K-means algorithm requires a distance metric between points, however it is not possible to provide a metric value for correlations between users. Therefore, in each iteration the center is determined by finding the user that has the best overall correlation with all the other users in the cluster. The main advantage of Clustered Pearson is improved scalability. However, on the other hand, the method requires a long off-line training time to improve scalability. And also, using k-means algorithm causes instability due to randomized initial cluster selection and due to undefined k value, the number of clusters [16].
For faster calculation of predictions, some approaches adopt disk based in-verted file structures [14]. Coster et al. have two reasons for this. Firstly, matching user profiles in a collaborative filtering system can be very expensive. Secondly, if all user preferences stored can be accessed directly from disk it is possible to maintain a much larger set of users and titles. Actually the reason for using inverted file search in this domain is that a user query contains a small percentage of the total number of the items in the document collection. Here a user’s votes for items can be seen as a document. Accumulators are stored in main memory during the scan of each inverted list, for holding partial sums of votes. For calculating the similarities between the active user and all other users, several correlation methods are employed. One of them is Simple Pearson
algorithm which is also used in [16]. Another algorithm is extended Pearson algorithm, which uses Inverse User Frequency (IUF). The more the number of votes that a title has, the lower weights it is assigned. This is due to the assump-tion that the titles that are rated by many users are less useful in capturing the similarity between two users. In addition to these, Default Voting (DEF) is used in experiments. The idea is to assign default votes for the titles that have not been rated by both users. The value of the default vote depends on the system. Hence, the similarity is calculated by using all the titles. As a fourth method, Default Voting is extended by Inverse User Frequency (DEFIUF). For speeding up the algorithm, some early termination heuristics, such as Quit and Continue, are also used.
Collaborative filtering recommendation systems are evaluated using different metrics with different data sets. Breese et al. evaluate their algorithm for three different data sets: i) MS Web, the data set capturing the individual visits to various areas of the Microsoft corporate web site. ii) Television data set using Neilsen network television viewing data for people. iii) EachMovie explicit voting system for movie database. For prediction of some specific item x, in order to judge the effectiveness they look at the average absolute deviation of the predicted vote to the actual vote on items on which the users in the test set have actually voted. These scores are then averaged over all the users in the test set of users as in the GroupLens project. For top-N recommendation list, they estimate the expected utility of a particular ranked list to a user. The expected utility of a list is the probability of viewing a recommended item times its utility. In this analysis, they set the utility of an item as the difference between the vote and the default vote in the domain.
SWAMI uses EachMovie data set for experimentation. To examine the ef-ficiency and effectiveness, SWAMI has three metrics: The first is the mean absolute error, already in common use in the literature, where the error is the absolute value of the differences between the actual vote and the pre-dicted vote. This measures the accuracy of the prediction algorithm. The second metric is the variance of the mean absolute error, which measures how reliable the prediction algorithm is. The third metric, weighted mean, aims at measuring how well the prediction algorithm does on the “harder” movies to predict, movies with high vote variance. The weight given to a movie is | true user vote − mean user vote |. The weight is higher for movies that are far from the user’s mean. Thus, the formula for the weighted mean is | (true user vote − mean user vote) ∗ (true user vote − predicted user vote) |.
Ungar et al. experiment their system on both synthetic data and real data from Purchase CDNow. They test their system on CDNow’s customers by sending email recommendations of new artists. They claim that the automated system resulted in doubling of the purchase rate.
Herlocker et al. use MovieLens data set for experimentation. They consider three metrics for evaluation. Coverage is a measure of the percentage of the items for which a recommendation system can provide predictions. They compute the coverage as the percentage of the items over all users for which a prediction was requested and the system was able to provide a prediction. To assess the accuracy, they compute both mean absolute error and root mean squared error as statistical accuracy metric, and ROC (receiver operator characteristic) sensitivity as the decision support accuracy metric. ROC measures the sensitivity and specificity of the test. Sensitivity is the probability of a randomly selected recommendable
(good) item being accepted by the filter, whereas specificity is the probability of a randomly selected bad item being rejected by the filter.
Although collaborative filtering based systems have been successful in several domains, they still possess some problems such as:
Sparsity: One of the biggest problems is the extreme sparsity of the data. Con-sider that there may be thousands of users, several million items. However, each user may rate only a dozen of items, giving a highly sparse data. So, there will be a real problem in obtaining a large amount of data about any item or user with such little data.
Cold start: The sparsity problem can be difficult to overcome after users have made a large number of recommendations; however it is even harder to overcome when the system has just been started and there are no user recommendations at all.
New item: Similarly, a new item that has not had many ratings also cannot be easily recommended. New item problem can be handled by content information gathered by inferring the similarities between existing items and the new item [35]. Na¨ıve Bayes text classifier applied to person/actor data is used. For each person a separate na¨ıve Bayes classifier is trained so no collaborative information is used. The model is trained with Laplace smoothing. All movies in the data set should be rated. Such hybrid recom-mendation systems which combine content-based and collaborative filtering can help the new item problems [35].
Scalability: The other major problem affecting most of the recommender sys-tems is their ability to scale up to large syssys-tems. With millions of isys-tems and
users a typical recommender system will suffer serious scalability problems. Gray sheep: In a small or medium community of users, there are individuals whose opinions do not agree or disagree with a group of people. These users will rarely receive accurate predictions even after initial start up phase for the user and the system.
On the other hand, in content-based techniques, the user model includes infor-mation about the content of items of interest, e.g., whether these are web pages, movies, music, or anything else. The items of interest are defined by their associ-ated features. Using these items as a basis, the technique identifies similar items that are returned as recommendations. A content-based recommender learns a profile of the user’s interests based on the features present in objects the user has rated. Schafer et al. call this item-to-item correlation [34]. The type of user profile derived by a content-based recommender depends on the learning method employed. Decision trees, neural nets, and vector-based representations have all been used.
In content based systems, the first step is to gather content data about the items. For example book title, author, description etc. for the books or the direc-tor, cast etc. for the movies are some of the common content information. Most systems use information extraction techniques to extract these data, and infor-mation retrieval techniques to retrieve the relevant inforinfor-mation [3]. Web crawlers collecting data on the web are common tools in this step. Secondly, user ratings are collected. Then using the using ratings together with the content information, user profiles are compiled. Finally, unrated items’ contents are compared with the user profiles and scores are assigned according to the degree of similarity.
Content based techniques might prove highly suitable for users who have spe-cific interests and who are looking for related recommendations. Many machine learning techniques have been applied to this problem. Some researchers working on these, such as Chen and Norcio [13] and Jennings and Higuchi [26] have mod-eled users with the application of neural network methodology. NewsWeeder [28] , NewsDude [7] also belong to the category of content-based recommender systems.
However, content based filtering has limitations too:
• Either the items must be of machine parse-able form or attributes must be assigned to the items by hand.
• This technique recommends more of what the user has already seen before, i.e. it has no inherent method to generate serendipitous recommendations. • Content-based techniques also have a start-up problem in that they must
accumulate enough ratings to build a reliable classifier.
In light of these issues, we aim an efficient and effective solution for informa-tion overload which overcomes as many problems stated as possible. We present collaborative filtering with inverted indexing using either C3
M or K -Means clus-tering algorithms and enhance the filclus-tering process by adding the content in-formation in a two-stage clustering strategy. Experiments and results show the achievements.
Methodologies
The approaches we use for handling information overload consist mainly of two dominant research paradigms: content based filtering and collaborative filtering. A pure content based filter recommends items based solely on a profile built up by analyzing the content of the items that a user has rated [3]. Content based filters are less affected by the mentioned problems of the pure collaborative filters because they use techniques that apply across all documents. For example, a filter that predicts high rating for movies with the word “Jedi” in their plot summaries or with the genre “Action” can give the prediction before anyone has watched the movie. Despite these strengths, content based filters alone can prove ineffective. These techniques can have difficulty in deciding between high quality and low quality information on the same theme. Also, as the number of items increases, the number of items in the same content based category increases too, further decreasing the effectiveness of these filters. Collaborative filtering exploits the speed of computers with the intelligence of the people. Collaborative filters correlate the ratings of a user with those of other users to determine how to make
future predictions for the rater. As well, these filters share the ratings with other users so they can use them in giving their own votes.
In light of these, we first introduce a cluster based collaborative filtering tech-nique with a specific inverted index structure to improve the efficiency of the collaborative filtering. We then describe a hybrid filter approach exploiting col-laborative filtering added with content information with this inverted indexing, cluster-skipping inverted index structure (CS-IIS), for further improvement in performance. We evaluate the performance of our collaborative and hybrid filter-ing approaches with a previously proposed technique, collaborative filterfilter-ing with inverted indexing [14].
3.1
Cluster Based Collaborative Filtering with
Cluster-Skipping Inverted Index Structure
Collaborative filtering is probably the most familiar, most widely implemented and most mature of the technologies in recommendation systems. Collaborative filters aggregate ratings of items, recognize the cohesion between users on the basis of their votes for items, and generate new ratings (predictions) based on inter-user similarities.
The greatest strength of collaborative filters is their applicability to all do-mains of rating data being completely independent of any machine parse-able representations of the items to be recommended. However, it is still challenging to improve the efficiency and the accuracy of the collaborative filters. On this
basis, we try to improve the performance of the collaborative filtering method-ology by combining it with clustering algorithms. For comparative purposes, we work on both K-means clustering algorithm, which is one of the mostly used al-gorithms in this area, and Cover-Coefficient Based Clustering, shortly C3
M, due to its comparable efficiency [12]. Furthermore, we use a cluster-skipping inverted index structure (CS-IIS) [11], a recently proposed file structure for clustered data sets, for improving efficiency by reducing in-memory computation costs. We im-prove the scalability of the collaborative filtering technique using these approaches altogether.
Our approach involves a clustering phase of the users according to their cor-relation in the ratings for the items. Clustering is done by either C3
M or K -means. In the search strategy, i.e., cluster-based retrieval (CBR), a two-stage query processing is performed. The queries are first compared with the clus-ters, or more accurately, with cluster representatives called centroids. Detailed query-by-document comparison is performed only within selected clusters. So, the first stage is selecting the best correlated clusters of a user profile, and the second stage is selecting the best correlated neighbors from these best correlated clusters. Best matching clusters are found by using the previously computed centroids. An inverted index file is also created for the centroids. Then a cluster-skipping inverted index structure is exploited to find the best matching users among the best matching clusters to the given query profile. During this stage, two alternatives can be applied, either all users of the best matching clusters are searched, or only the centroids of the clusters are considered to be the best cor-related “virtual” users. We use Simple Pearson correlation (see Equation 2.2) to decide on the degree of similarity in both stages. A comprehensive example for illustrating our filtering methodology is also provided later. After the formation
of the neighborhood, the final step in the methodology is providing the prediction considering the degree of correlation of the neighbors and the ratings given for the items by these neighbors, specifically movies. We use a correlation based method which is the most popular prediction technique in collaborative filtering applications. It was originally used in the GroupLens project [32]. The basic idea is to compute a user’s predicted rating of an item as a weighted average of the ratings given to that item by other users. Specifically, prediction pu,x for user u
on item x is given by [16]:
pu,x = µu+ κ
X
i6=u
wu,xvi,x− µu (3.1)
where wu,i : similarity between user u and i
vi,x : user i’s vote for item x
µu : user u’s mean vote
¯
va : mean value of the votes for user a
κ : appropriate normalization factor
3.1.1
Clustering Techniques
3.1.1.1 K -Means
K -means clustering algorithm is the simplest and the most popular clustering algorithm by far. This main-memory algorithm is based on a very simple idea. Given a set of initial clusters, assign each point to one of them, then each cluster center is replaced by the mean point of the respective cluster. These two simple steps are repeated until convergence. A point is assigned to the cluster which is the closest - according to a distance measure - to the point [25].
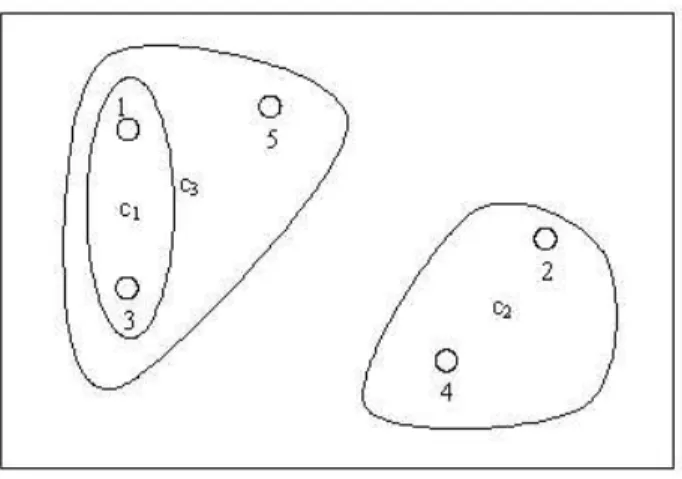
For a simple example, suppose we have five points as in Figure 3.1 and want to have k =2 clusters. Suppose we assign the points 1, 2, 3, 4 and 5 in that order for k =2. Then the points 1 and 2 are assigned to the cluster 1 and cluster 2 respectively, and become their centroids initially.
Figure 3.1: Example of a k-means clustering
Now we consider the points. Suppose point 3 is chosen and it is closer to point 1 than to point 2, so 3 goes to cluster 1. The centroid of that cluster changes to c1. Now suppose we are to assign 4, and 4 is closer to point 2 than to c1. So,
it is joined to the cluster 2 and the centroid of that cluster moves to c2. The
remaining point 5 is closer to c1 than to c2, therefore goes to cluster of c1. The
final situation is clusters {1, 3, 5} and {2, 4} with centroids c3 and c2, respectively.
The reasons for the popularity of this algorithm are [25]:
• It is easy to implement.
• Its time complexity is O(nkm), where n is the number of points/items, k is the number of clusters and m is the number of iterations taken by the algorithm to converge. Typically, k and m are fixed in advance and so the algorithm has linear time complexity in the size of data set.
• Its space complexity is O(n + k).
• It is order independent, i.e. for a given initial seed set of clusters, it gener-ates the same partitioning of the items independent of the order in which the points/items are presented to the algorithm.
However, in the presence of a large data set, it can be slow since in each iteration the distance between each point to each cluster has to be calculated. Moreover, this algorithm is sensitive to the selection of the initial seed set. The number of clusters, k, should be given to the algorithm.
Several variants of the k-means algorithm have been described in the litera-ture [2]. Some of these methods attempt to select a good initial partition so that the algorithm is more likely to find the global minimum value. Another variation is to permit splitting and merging of the resulting clusters. Typically, a cluster is split when its variance is above a specified threshold, and two clusters are merged
when the distance between their centroids is below another specified threshold. Using this variant, it is possible to obtain the optimal partition starting from any arbitrary initial partition, provided that proper threshold values are specified [5]. Our k-means implementation uses a correlation based method. In the simple k-means algorithm, a metric is required to calculate the distance between points, however it is not possible to provide a metric value for correlations between users in collaborative filtering. Therefore, we use a Pearson correlation method formulated in Equation 2.2 for calculating neighbors.
3.1.1.2 Cover Coefficient based Clustering
In our methodology, as an alternative to popular k-means algorithm, we use C3
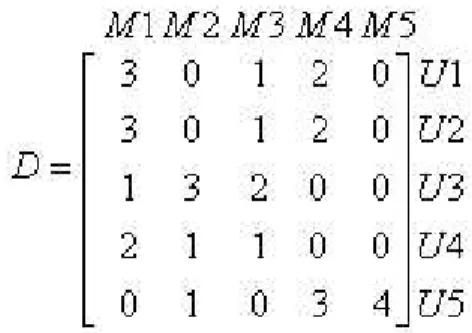
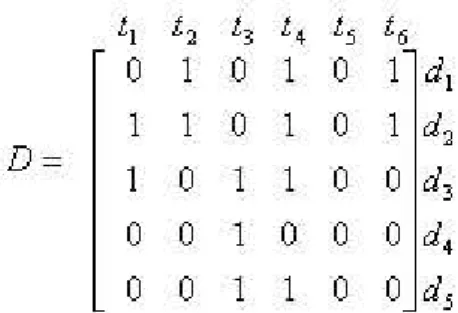
M which was shown to have many desirable properties for a clustering algorithm with respect to other algorithms in the literature. This clustering method can be used in dynamic environments incrementally for cluster maintenance [10]. This method models the document collection in a vector space. Here a document collection is represented by a document matrix D, of size mxn, where m is the number of documents and n is the number of terms. An example D matrix is given in Figure 3.2.
In the example, the terms t2, t4 and t6 appear in document d1. In our domain,
documents correspond to the users and terms correspond to the items, specifically movies. The number of clusters is determined by using the cover coefficient concept, CC [12]. For an m by n document matrix, this number, nc and the
Figure 3.2: Example of a D matrix average cluster size dc are specified as follows:
1 ≤ nc ≤ min(m, n) ; max(1, m/n) ≤ dc ≤ m. (3.2)
C3
M maps the document matrix D to a cover coefficient matrix C of size m by m by using a two-stage probability calculation. This C matrix represents the relationships among the documents in the database. To illustrate this concept we summarize the calculation of c12. According to the D matrix, d1 contains three
terms {t2, t4, t6}. According to the two-stage probability model, to calculate cl2
we must first randomly select each one of the terms of d1, and then try to select
d2, from the outcome (term) of the first stage. At the first stage, if we select t2
or t6, then d2 has a chance of 1
2. However, if t4 is selected at the first stage, then
the probability of selecting d2 at the second stage is 1
4. This is because t2 and
t6 appear in d1 and d2. On the other hand, t4 appears in d1, d2, d3and d5 . At
the first stage, the probability of selecting each element of {t2, t4, t6} from d1 is 1 3,
and for the rest the probability is 0 (i.e., no term in {t1, t3, t5} appears in d1). If
we denote the probability of selecting document di from term tk at the first stage
with pik and similarly denote the probability of selecting document dj from term
c12 = 6 X k=1 p1k× p02k = 1 3× 1 2+ 1 3× 1 4+ 0 × 0 + 0 × 1 2+ 1 3× 1 2+ 0 × 0 = 0.42 (3.3)
Some of the documents are chosen as cluster seeds and other documents are assigned to the clusters initiated by the seed documents. For clustering process, C3
M does not need the entire C matrix. The diagonal entries of C matrix are used to find the number of clusters, nc, and the cluster seeds. In order to assign
a non-seed document di to a cluster, the relationship between di and the seed
document dj is determined by calculating the cij entry of C, which shows the
extent with which di is covered by dj. Hence, only (m + (m − nc) ∗ nc) entries
of the total m2
entries of C matrix are required. This is actually a small value compared to m2
, since nc m. A brief description of the algorithm is given in
Figure 3.3. A thorough discussion and complexity analysis of C3
M are available in [12].
Algorithm 1: C3M
1: Determine the cluster seeds of the database.
2: i = 1
3: repeat; /* construction of clusters */
4: if di is not a cluster seed then
5: Find the cluster seed (if any) that maximally covers di if there is more than one
cluster seed that meets this condition, assign di to the cluster whose seed power
value is the greatest among the candidates.
6: i = i + 1
7: until i ≥ m
8: If there remain unclustered documents, group them into a ragbag cluster (some nonseed documents may not have any covering seed document).
Figure 3.3: C3
The algorithm has been shown to satisfy some important characteristics. Clus-ters produced are stable, i.e., small errors in the description of the documents lead to small changes in the clustering. The algorithm is independent of the order of the documents and so generates a unique classification. Extra data structures needed for the implementation of the algorithms require a very small memory space. The algorithm distributes the documents evenly among the clusters, i.e., it does not generate a few fat clusters and many singletons. Also, it does not require nc to be pre-specified, but obtains it inherently.
3.1.2
File Structures
3.1.2.1 Inverted File Search Algorithm
In the basic inverted indexing, for each query term, corresponding inverted list is scanned [40]. During this scan, accumulators are stored in main memory for holding partial sums of ratings for items. In our case, partial sums will be the partial similarities between the active user and the other users. After process-ing all inverted lists, weight arrays such as containprocess-ing normalization factors are combined with the complete accumulators to produce the final score for a user. To apply inverted search to correlation, we use the partial accumulators method proposed by Coster et al. [14] and keep three different accumulator structures in-memory for Equation 2.2: one for the sum in the nominator, and two for the sums in the denominator. Figure 3.4 elucidates the algorithm of Coster et al. for neighborhood calculation of collaborative filtering with inverted indexing.
Algorithm 2: Inverted correlation neighborhood search
Input is the user profile va, max number of neighbors K and array of means M EAN S.
Output is array of nearest neighbors.
1: Allocate accumulators SAI, SAA and SII of size N .
2: Allocate array T OP of size K for nearest neighbors.
3: forall j ∈ va do
4: locate inverted list L for title j
5: foreach user u and vote v in L do
6: SAI[u] = SAI[u] + (va,j− ¯va) ∗ (v − M EAN S[u])
7: SAA[u] = SAA[u] + (va,j − ¯va)2
8: SII[u] = SII[u] + (v − M EAN S[u])2
9: forall u ∈ SAI, such that SAI[u] 6= 0 do
10: corr = SAI[u]/p
(SAA[u] ∗ SII[u])
11: if corr ≥ T OP [K − 1] then
12: add (u, corr) to T OP
13: restore T OP to sorted order
14: return T OP
Figure 3.4: Neighhborhood computation for collaborative filtering with inverted indexing [14]
Notice that, theoretically Coster et al. defines 3 different accumulators instead of a single one as in a typical information retrieval, to store required values for computing Pearson coefficient. The mean values of votes for each user are stored in the static array MEANS. N denotes the number of users in the database. The algorithm computes the top K neighbours to user a. The sorting step is performed by using min-heaps.
3.1.2.2 Cluster-Skipping Inverted Index Structure
One of our contributions to efficient collaborative filtering is the adaptation of cluster-skipping inverted index structure (CS-IIS) [11]. This approach provides
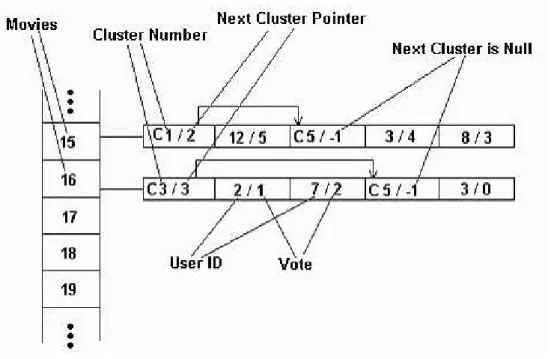
efficient and effective cluster based retrieval for large databases without consid-erable additional storage overhead, and improves scalability which is one of the important problems in collaborative filtering approaches. It significantly reduces the cost of similarity calculations. CS-IIS provides efficient access to the clustered documents based on the common terms with the queries.
In cluster based retrieval strategy, there are two components whose file struc-tures crucially affect the efficiency of the system. These are selection of ns
num-ber of best matching clusters using centroids, and selection of ds number of best
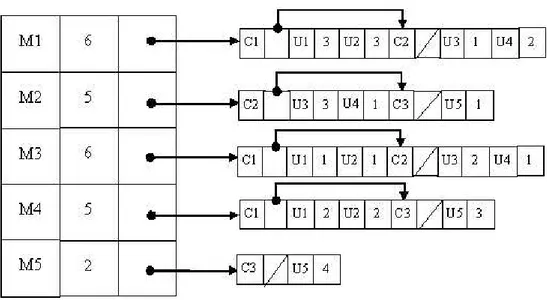
matching documents of the selected best matching clusters. One of the possible structures that can be used is inverted index for both centroids and documents, i.e., IC inverted index of centroids and IIS inverted index of all documents. In CS-IIS, Can et al. keep IC in its usual structure; however in IIS component they store not only posting list information but also cluster membership information. Posting list information associated with the members of a cluster is stored next to each other, and it is followed by the members of the next cluster. Pointers are used from the beginning of one cluster’s posting list to the next one for skipping the clusters which are not selected as best matching clusters. An example is il-lustrated in Figure 3.5. In this example, the given D matrix is clustered using C3
M.
In Figure 3.5 each posting list header contains the associated term, the number of posting list elements associated with that term, and the posting list pointer (disk address). The posting list elements are of two types, “cluster number -position of the next cluster” and “document number - term frequency” for the documents of the corresponding clusters. If we assume that the user query con-tains the terms t3, t5 and the best-matching clusters for this query are C1, C3;
using the cluster-skipping IIS approach during query processing after selecting the best-matching clusters we only consider the posting lists associated with t3
and t5. While processing the posting list of t3 we skip the portion corresponding
to C2 (since it is not a best-matching cluster). Similarly, while processing the posting list of t5; we again skip the unnecessary C2 portion of the posting list
and only consider the part corresponding to C3. In other words, by using the skip approach we only handle the documents that we really need to match with the query.
The presented cluster based retrieval strategy has been shown to improve the efficiency of query processing via in-memory similarity calculations. For large databases, this strategy can achieve a time efficiency and effectiveness compara-ble with full search. This characteristic helps us significantly in improving the scalability of collaborative filters.
Example: We illustrate our methodology with an example. Suppose we have movie set as M : {M 1, M 2, M 3, M 4, M 5} and user set as U : {U 1, U 2, U 3, U 4, U 5}. Our document matrix which contains the ratings of these users for these movies is as in Figure 3.6:
Figure 3.6: Document matrix of the example
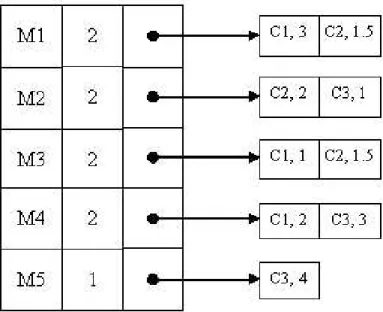
C1 = {U 1, U 2}, C2 = {U 3, U 4}, and C3 = {U 5}. According to the profiles given in D matrix, we compute the centroids of the clusters by averaging the votes for each movie item by the corresponding users of each cluster, i.e.,
Centroid-C1 : hM 1 : 3 M 3 : 1 M 4 : 2i Centroid-C2 : hM 1 : 1.5 M 2 : 2 M 3 : 1.5i Centroid-C3 : hM 2 : 1 M 4 : 3 M 5 : 4i
The corresponding inverted index structure for centroids can be given as in Figure 3.7. So, for a given user query Uq : {M 1 : 4, M 4 : 2}, assume that we set
the number of best correlated clusters and the number of best correlated users to 1, i.e., we are to select the most correlated cluster considering the centroids, and then to select the best matching user from this best cluster. Applying Pearson correlation method as in Figure 3.4, we find the best cluster as C1.
Figure 3.7: IC- Inverted centroids structure of the example
Now for selecting best matching users, two alternatives, using centroids or using all users in the best matching clusters exist. In order to find the best
Figure 3.8: Cluster-skipping inverted index structure of the example matching users considering all users in the best matching clusters, we use the cluster-skipping inverted index structure given in Figure 3.8 and again by apply-ing Pearson correlation, we find the 1 best matchapply-ing user to be U1. Then we can exploit the prediction method explained in Section 3.1 to give the predicted ratings.
3.2
Hybrid Filtering with Cluster-Skipping
In-verted Index Structure
Hybrid recommender systems combine two or more recommendation techniques to gain better performance with fewer of the drawbacks of any individual rec-ommender technique. Most commonly, collaborative filtering is combined with some other technique in an attempt to avoid some of the associated problems such as cold start1
. One of the most common hybrid recommendation techniques is the filtering scheme which combines content based and collaborative filters together [9].
Content based filters only require one user, but have the weakness of not being able to predict interest on information that is significantly different from anything seen before. Collaborative filters require multiple users; they can handle new and unseen information items, but only as long as some other user has seen and rated the item. Thus, the goal of hybrid filters is to take the best features of each technique and minimize the impact of their weaknesses with the goal of outperforming each individually.
One of our approaches is to facilitate collaborative filtering without throwing away the content information available so that alleviating some of the problems each approach could possess. To accomplish this, we perform a repeated clus-tering technique [39]. Firstly, we generate the clusters according to the genre attribute of movies. In this stage, first the movies are partitioned into clusters according to their genre attribute. This produces clusters such as Action, Drama, Romance, etc. These clusters are overlapping, i.e., a movie may fall into several
1
clusters, such as both Drama and Romance. Then the users are clustered ac-cording to genre of the movies they watched. These clusters are non-overlapping, since a user falls into the cluster from which s/he has watched the largest number of movies. Then, the users of each cluster obtained in this stage are subject to another clustering using either C3
M or K-Means. For example, suppose we have two clusters, e.g. Action and Drama, obtained in the first partitioning stage. The users who have watched movies from Action cluster are clustered among themselves and similarly the users who have watched movies from Drama cluster are clustered among themselves. Then these clusters are presented to the rest of the methodology, i.e., either collaborative filtering with inverted indexing or collaborative filtering with cluster-skipping inverted index structure is applied. The experimental results given in Chapter 4 verify our expectations.
Experiments and Results
Throughout the previous chapters, we have described existing techniques for han-dling information overload, discussed the problems associated with them and provided our own approaches for improvement. In this chapter, we try to evalu-ate the improvement gained via our approaches in comparison with the existing algorithms by conducting a large set of experiments. We also describe the devel-oped prototype movie recommender system, MoRec, which is currently in public use1
[24].
Advancing in two ways, separate hardware and software configurations have been employed for the experimental evaluation and for the development of MoRec. The hardware needed to configure a test environment for our research includes a machine, which operates on LINUX, with a memory of minimum 256 Mbytes RAM and a 2.4 GHz Intel Pentium-IV processor. The proposed and existing approaches were implemented in C programming language on a Linux platform.
1
http://pcvideo.cs.bilkent.edu.tr/MoRec/index.aspx.
C code was compiled by gcc, the GNU Compiler Collection,2
and for debugging purposes, kdebugger, KDbg a graphical user interface to the GNU debugger,3
was utilized. The hardware needed to configure MoRec consists of a machine with at least 512 Mbytes RAM and a processor of at least 2 GHz since this machine is both a Web and a database server. It also needs an Internet connection so that the Web page requests can be satisfied. The software configuration of MoRec includes Windows XP Professional as the operating system, Internet Information Services (IIS) as the Web server and Microsoft Visual Studio .NET as the imple-mentation platform. Storing, retrieving and interacting with the data are handled by Microsoft SQL Server 2000 Personal Edition. As a result, the user interface package of Microsoft Visual Studio .NET and the database management system Microsoft SQL Server 2000 Personal Edition are used as off-the-shelf components. We use the EachMovie dataset as both the test-bed of our approaches and as the database of MoRec, collected by the Digital Equipment Corporation (DEC) Systems Research Center from 1995 through 1997. This dataset comprises a total of 2811983 ratings of 1628 movies by 60087 users. Each rating is on a scale of 0 to 54
[15]. We have used a Web crawler, WebSPHINX (Website-Specific Processors for HTML INformation eXtraction) developed by Rob Miller at Carnegie Mellon University, in order to gather the content data of movies from The Internet Movie Database (IMDb) [23] for hybrid filtering approaches. Out of 1628 movies present in EachMovie dataset, the content information –including synopsis, genre, key actors and actresses– of 1482 movies could be downloaded. Out of these 1482 movies, 1224 movies have synopsis.
2
http://gcc.gnu.org/
3
KDbg is authored by Johannes Sixt.
4
To evaluate our approaches, we have conducted a set of experiments. We have used a popular statistical accuracy metric, mean absolue error (MAE) to evaluate the accuracy and the elapsed time for neighborhood formations to evaluate the efficiency of our approaches. MAE calculates the absolute difference between the actual vote and the prediction, averaged over all predictions.
4.1
Implementation Details
The underlying testing system consists of 7 modules responsible for different stages of information filtering process:
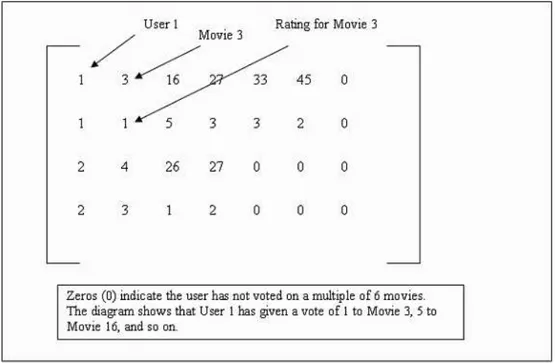
1. Preprocessing: In this module, the data files provided by EachMovie dataset, for movies, votes and users, are modified to form two document vectors by eliminating the unnecessary parts in these files. One of these document vector files includes the train user data used to train the predic-tor. The other document vector file is for keeping the test user data. While generating these files, the usual matrix representation is not used, instead a sparse matrix representation of vectors is exploited. A simple example is given in Figure 4.1. The actual document vector contains 15 movies in a line instead of 6 as in the example.
2. Inverted Index Structure - IIS : In this module, the inverted index structure of train user data is generated and kept as a binary file, so that it can be accessed randomly, i.e., the votes of any user can be accessed without reading the file sequentially.
Figure 4.1: Document vector format
read in train and test user binary files. Then we generate a pre-defined number of predictions, usually 5, for each user and calculate the absolute difference between the prediction generated by the system and the actual vote given by the user. At last, we calculate the average of the absolute differences of each prediction to form Mean Absolute Error. We output the mean absolute error together with the time statistics.
4. Clustering: This module deals with the cluster formation of train users. It groups similar users into one cluster. There are two algorithms as explained in Chapter 3: C3
M and K-Means. Both of these algorithms take train user data and create two files, one that shows the users of each cluster and another that shows the cluster of each user.
5. Centroid Generation: In this module, we create the centroids, virtual users representing each cluster using the train user data and clustering files. We
Figure 4.2: Inverted Index with skipping data format
generate a file, which holds the mean votes of these centroids. Another file that is created is a binary file, which contains the movies with the votes of each centroid as they are virtual users with votes on movies. The last output of this module is another file which shows a list of movies with the number of centroids that have votes on them. This file is used to determine the size of the data structures used in the last module, Cluster Based Collaborative Filtering with CS-IIS.
6. Cluster-Skipping Inverted Index Structure: This module reads in the in-verted list of votes before clustering, as well as the clustering information. It outputs the inverted index with skipping data structure as exemplified in Figure 4.2.
7. Cluster Based Collaborative Filtering with CS-IIS : This module is a more developed version of Collaborative Filtering with IIS. Again, it reads each user’s votes from a binary file when needed; however, unlike Collaborative
Filtering with IIS, it first selects a number of clusters, and then generates a prediction from train users of these clusters.
In Figure 4.3, an overview of these modules is given according to components’ input and output relations.
4.2
Experimental Setting
We have used the largest available public dataset, EachMovie, for testing our algorithms. We compare our approaches –cluster based collaborative filtering with cluster-skipping inverted index structure and the hybrid approach– against collaborative filtering with inverted indexing proposed by [14].
4.3
Efficiency and Effectiveness
Several evaluation metrics for evaluating the accuracy of collaborative filtering approaches have appeared in the literature (see Chapter 2). The most common metric is the Mean Absolute Error (MAE). MAE is the average absolute devia-tion of the predicted ratings from the actual ratings on items the test users have voted. The lower the mean absolute error, the more accurate the scheme. We choose MAE in our experiments for two reasons: a) It is the most commonly used metric and allows us to compare our results with a larger set of previous works. b) There is a vast research literature on performing statistical significance testing and computing confidence intervals for MAE. Furthermore, Herlocker et
al. [22] have also suggested the use of MAE for prediction evaluation. For evaluat-ing the efficiency, we measure the neighborhood formation times for comparative purposes.
The MAE is calculated by summing the absolute errors of the correspond-ing ratcorrespond-ing-prediction pairs and then computcorrespond-ing the average as given in Equa-tion 4.1 [22]. M AE = N X u=1 |Pu,i− Ru,i| N (4.1)
where Pu,i means the prediction for user u on item i; Ru,imeans the actual rating
of the user u on item i in the test data; N is the number of rating-prediction pairs between the test data and the prediction result.
We evaluated the algorithms on the AllBut1 protocol, meaning that for each user we held out a single vote that should be predicted on the basis of all the other votes in the profile as Coster et al. [14]. We experimented with a training set size of 90% of all users, i.e., 55000 users. This choice is due to comparison with Coster et al. who used the inverted file search algorithms for collaborative filtering (see Chapter 2). We used a neighborhood size k of 30. We set the number of clusters that are used as the best correlated clusters from which k nearest neighbor is selected, to 10% of the total number of clusters. We set the number of movies for which a prediction is calculated for each test user, to 5. Different cluster sizes were experimented, 24, 200, and 1300, for both C3
M and K-means algorithms. 24 is due to C3
M, since the algorithm itself determines the cluster size if it is not predetermined by the user. Since we let C3
M select the number of clusters in each partial cluster for hybrid filtering approach, this stage generates a total of nearly 200 clusters for all first-stage clusters. Therefore, in order to compare the hybrid filtering approach with the collaborative filtering
![Figure 2.1: Clustering methods [25]](https://thumb-eu.123doks.com/thumbv2/9libnet/5632324.111837/22.892.177.798.187.507/figure-clustering-methods.webp)
![Figure 2.2: Similarity measures [25]](https://thumb-eu.123doks.com/thumbv2/9libnet/5632324.111837/25.892.196.839.208.469/figure-similarity-measures.webp)
![Figure 3.5: Inverted file structure with skips [11]](https://thumb-eu.123doks.com/thumbv2/9libnet/5632324.111837/45.892.171.752.316.885/figure-inverted-file-structure-with-skips.webp)