On the stability and necessary electrophoretic
mobility of bare oil nanodroplets in water
Cite as: J. Chem. Phys. 152, 241104 (2020);doi: 10.1063/5.0009640
Submitted: 2 April 2020 • Accepted: 8 June 2020 • Published Online: 26 June 2020
S. Pullanchery,1 S. Kulik,1 H. I. Okur,1,2 H. B. de Aguiar,3 and S. Roke1,a)
AFFILIATIONS
1Laboratory for Fundamental BioPhotonics, Institute of Bioengineering (IBI), Institute of Materials Science (IMX) and Engineering, School of Engineering (STI), and Lausanne Centre for Ultrafast Science, École Polytechnique Fédérale de Lausanne (EPFL), CH-1015 Lausanne, Switzerland
2Department of Chemistry and National Nanotechnology Research Center (UNAM), Bilkent University, 06800 Ankara, Turkey 3
Laboratoire Kastler Brossel, ENS-Université PSL, CNRS, Sorbonne Université, Collège de France, 24 rue Lhomond, 75005 Paris, France
a)Author to whom correspondence should be addressed:[email protected]
ABSTRACT
Hydrophobic oil droplets, particles, and air bubbles can be dispersed in water as kinetically stabilized dispersions. It has been estab-lished since the 19th century that such objects harbor a negative electrostatic potential roughly twice larger than the thermal energy. The source of this charge continues to be one of the core observations in relation to hydrophobicity, and its molecular explanation is still debated. What is clear though is that the stabilizing interaction in these systems is understood in terms of electrostatic repulsion via Der-jaguin, Landau, Verwey, and Overbeek theory. Recent work [A. P. Carpenter et al., Proc. Natl. Acad. Sci. U. S. A. 116, 9214 (2019)] has added another element into the discussion, reporting the creation of bare near-zero charged droplets of oil in neat water that are stable for several days. Key to the creation of the droplets is a rigorous glassware cleaning procedure. Here, we investigate these con-clusions and show that the cleaning procedure of glassware has no influence on the electrophoretic mobility of the droplets and that oil droplets with near-zero charge are unstable. We provide an alternative possible explanation for the observations involving glass surface chemistry.
© 2020 Author(s). All article content, except where otherwise noted, is licensed under a Creative Commons Attribution (CC BY) license (http://creativecommons.org/licenses/by/4.0/).https://doi.org/10.1063/5.0009640., s
Hydrophobicity is key to many interactions and processes in physics, chemistry, and biology.1Sub-micrometer sized or nanoscale hydrophobic oil droplets or particles in water form a very important model system for understanding how hydrophobicity works. Since the late 19th/early 20th century,2–9hydrophobic nanodroplets and air/gas bubbles have been prepared and investigated. Early exper-iments5,7 reported the surprising observation that oil droplets or air bubbles in water move towards a positive electrode when sub-jected to an electrostatic field. This negative electrophoretic mobility is often converted into a zeta (ζ)-potential. The ζ-potential is inter-preted as the electrostatic potential on the slip plane of a particle or droplet,10which is the plane that separates molecules that move with the droplet from molecules that do not.
Figure 1(a) shows a selection of ζ-potential values reported by three different research groups since 1996 who all performed
electrophoretic mobility measurements on hexadecane droplets in water. Marinovaet al.,8Creuxet al.,6and Váchaet al.9all reported values in the range −55 mV < ζ < −71 mV at pH neutral condi-tions and dropping to −81 mV < ζ < −100 mV at pH 9. Recent data were reviewed in Ref. 2 showing a similar result for other hydrophobic liquids as well as gases: A single N2bubble,6air bub-bles,14nitrobenzene,6dodecane,6Teflon,15octadecane,16and hydro-gen17 all show the same behavior, a monotonous decrease in the electrophoretic mobility or ζ-potential as a function of pH. All these published experimental studies agree on the sign and mag-nitude of the electrophoretic mobility/ζ-potential. The source of this mobility, however, is not known and is still hotly debated. The most frequently given explanations focus around ion adsorp-tion of a specific negatively charged ionic species. The hydrox-ide ion3 and the bicarbonate ion18are two commonly mentioned
FIG. 1. (a) ζ-potential values of n-hexadecane nanodroplets in water collected from three different literature studies.6,8,9The gray area represents the region where the electrostatic repulsion is smaller than the thermal energy, leading to unstable dispersions.11(b) Electrophoretic mobility values of n-hexadecane nanodroplets in water from Ref.12, showing data from the Richmond lab (red data) and data from a study reported by Roger and Cabane13(green and blue data), showing the effects of carboxylic acid impurities in the oil phase. The black dotted lines indicate the difference in chemical equilibrium constant between the green and blue curves and the red curve. Note that the data in panel (a) decrease monotonously, whereas the data in panel (b) have the characteristic shape similar to a surface deprotonation reaction, indicating a different interfacial mechanism.
possibilities. However, since small non-polarizable ions are gener-ally not surface active,19,20 this is nowadays questioned. Sum fre-quency scattering studies9,21have to date not found any evidence for the adsorption of hydroxide ions (although the complete surface vibrational water spectrum has not been measured), nor do sur-face tension measurements22,23or theoretical studies19support this hypothesis.
Another type of explanation focuses on water. Since the hydro-gen bond network is asymmetric around a bubble, droplet, or par-ticle, it might be involved in producing a negative electrophoretic mobility via either charge transfer9,24 or polarizability.25 What is agreed upon by all these studies is that emulsions or colloidal dis-persions cannot be kinetically stable unless the droplets or parti-cles experience a strong repulsive interaction11,26explicitly verified theoretically27and experimentally.28The repulsive force needed to prevent two objects from merging arises from the interactions that are inherent to the system, as dictated by the nature of the chem-icals present. For any type of colloidal dispersion, these particle– particle interactions are divided into attractive interactions (van der Waals interactions) and repulsive interactions (electrostatic inter-actions), and these are combined in Derjaguin, Landau, Verwey, and Overbeek (DLVO) theory.11,26In addition, there are also steric repulsion11,29 and depletion interactions,11,29 which contribute to the stability of a colloidal dispersion. For a dispersion composed of pure oil droplets, pure gas bubbles, or solid hydrophobic particles suspended in pure water or an electrolyte solution, the latter two interactions are generally not considered relevant.11This is simply because there are no bulky polymers or micelles present. Dispersive van der Waals interactions are attractive and will reduce the stability. This renders the electrostatic interactions as the only viable candi-date for stabilizing nanoemulsions or other dispersions11 of pure compounds.
Other explanations have been put forward based on the involvement of impurities in the oil phase.30–32A study in 2012 by Roger and Cabane attributed the mobility of oil droplets in water to oil-soluble carboxylate impurities.13Figure 1(b)shows this data: the blue curve shows 99% pure oil, while the green curve shows a set with 99.8% pure oil. Indeed, the shape of the curve resembles that of a deprotonation chemical equilibrium, and it is known that some oils may have carboxylic acid impurities, but these can be detected by a Zisman test33 and removed by passing the oil over an alu-mina column, which was not done here.4Vibrational sum frequency scattering studies in Ref.34found no evidence for the surface pres-ence of alkyl carboxylates of oils at the stated surface concentrations.
Figures 1(a)and 1(b)display distinctly shaped pH dependencies, suggesting distinct mechanisms. Since different hydrophobic mate-rials display the same trend as inFig. 1(a), it is unlikely that a specific impurity would be responsible for that behavior.4
Finally, two recent studies contributed by Carpenteret al.12,35 concluded that nanodroplets of hexadecane can be produced by standard preparation techniques, but by using a proprietary com-pound, NOCHROMIX®, and a “stringent multi-step glassware cleaning procedure,” resulting in the production of “moderately” or “marginally” stable nanoemulsions with near-zero droplet charge. The ζ-potential value from the first study in 201935 is shown as the black data point inFig. 1(a), and the electrophoretic mobility recorded as a function of pH12is shown inFig. 1(b). This conclusion casts doubts on a multitude of studies that report the apparent nega-tive charge as an intrinsic property of hydrophobic droplets in water. Formation of nanoemulsions with near-zero charge is quite sur-prising: It appears to contradict the DLVO derived stability mech-anism [the gray shaded area inFig. 1(a)shows the unstable regime]. Cleanliness has been the topic of a number of debates:4,13,34,36–38 in relation to the used salts for electrolyte interfacial studies,36
concerning the purity of oils when preparing nanoemulsions,4,13,34 or in relation to surface tension measurements37 and in particular the Jones–Ray effect.38,39All of these studies deal with the concern of the purity of chemicals. Impurities, whether in water, oil, or on the surface of glass, are generally chemically different depending on the history of the chemicals and sample treatment. Yet, despite the large diversity of cleaning and storage procedures, different research groups3,5,7–9,21,34,40,41 have consistently reported reproducible elec-trophoretic mobility or ζ-potential values (Fig. 1, Refs.2and3for older data), suggesting that charged surface active impurities aris-ing from improper glassware cleanaris-ing are not the main source of the observation.
In this work, we therefore investigate nanodroplet mobil-ity and stabilmobil-ity paying close attention to the glassware cleaning procedure. We clean glassware with the proprietary compound NOCHROMIX® as suggested by Carpenter et al.12,35 but also vary the prescribed cleaning agent using more commonly used non-proprietary ones and prepared nanoemulsions of pure hex-adecane in pure water. We report electrophoretic mobility and ζ-potential values and show that the cleaning agent of the glass-ware has no significant influence on the electrophoretic mobility. We also deliberately produced near-zero charged oil droplets in water and demonstrate that such nanoemulsions are unstable, dis-playing droplets coalescing within minutes after preparation. We discuss different aspects of electrophoretic mobility measurements as well as their use in relation to understanding the properties of nanodroplets. Finally, based on our data and the data provided in the Richmond laboratory studies of Refs.12and35, we propose an alter-native mechanism for the reduced ζ-potential that can result from prolonged acid treatment of the surface of the used glassware.
Zeta-potential and stability of oil nanodroplets in water. To investigate the conclusions drawn in Refs.12and35, we prepared nanoemulsions according to the following protocol. The glassware used for preparing nanoemulsions was freshly taken out of the man-ufacturer’s packaging and never re-used after the preparation. As a first step, all glassware used to prepare and store the solutions and samples was cleaned according to one of the three different cleaning methods: (1) glassware was soaked in a freshly prepared piranha solution [3:1 H2SO4(95%–97%, Merck) and H2O2(30%, Reactolab SA)] for ∼45 min and subsequently rinsed with copious amounts of ultrapure water prior to use; (2) glassware was soaked in a freshly prepared NOCHROMIX®:H2SO4(GODAX Labora-tories, Inc.) mixture that is mixed based on the provided instruc-tions, followed by thoroughly rinsing with ultrapure water to remove acidic components from the glass surface; and (3) glassware was cleaned with a Deconex® (Borer Chemie AG) solution prepared by 1:20 dilution with ultrapure water, then sonicated for an hour (using a reduced power compared to what is needed to prepare emulsions), and subsequently washed and rinsed at least ten times with MilliQ water. Ultrapure H2O with an electric resistance of 18.2 MΩ cm was obtained from a Milli-Q UF-Plus instrument (Milli-pore, Inc.). For experiments with heavy water, the D2O used was 99.8% D atoms with an electrical resistance of >2 MΩ cm (Armar). We used n-hexadecane (Sigma-Aldrich, analytical standard) with highest commercially available purity purchased in quantities <5 ml and tested the purity of it with a Zisman test.33,42 We also tested if further purification of the hexadecane phase had any effect on emulsion quality, inspired by previous experiments showing the
effect of purity on surface tension experiments.37,38For these tests, hexadecane was purified by running it several times through an acti-vated alumina (Sigma-Aldrich) column, which was preprocessed by heating to 500○C for 2 h. Such processedn-hexadecane gives rise to identical nanoemulsion samples and identical results to the Zisman test with the samples using the commercially available highest purity n-hexadecane.
The dispersions of nanometer-sized oil droplets in H2O [Fig. 1(a)] or mixtures of H2O and D2O (Fig. 2) were prepared with 1 vol. %–2 vol. % of the dispersed phase in the continuous phase. The dispersions were mixed for 2 min with a hand-held homog-enizer (TH, OMNI International) with an angular velocity of 300 rpm or vortexed for 3 min (IKA® Vortex 2) and then placed in an ultrasonic bath (35 kHz, 400 W, Bandelin) until a monodisperse sample was formed (<5 min). Alternatively, the nanodroplets could be formed by sonication alone using the same sonicator but with significantly longer sonication times. For stable samples, the droplet diameter was consistently found to have a mean value in the range of 130 nm–230 nm with a polydispersity index (PDI) < 0.3. The size of each final sample was monitored every few minutes of the sonication process. All samples were stored and measured in sealed cuvettes, and all measurements were performed at 25○C. The pH values of the solutions were measured using a pH-meter (HI 5522 pH/ISE/EC bench meter and HI 1330 pH electrode, Hanna Instruments) cal-ibrated with the appropriate buffer solutions. Conductivity values were obtained using a HI 5522 pH/ISE/EC bench meter and HI 76312 conductivity electrode (Hanna Instruments) calibrated with the appropriate buffer solutions to verify the ionic strength of the solutions.
The size distribution of the droplets was measured with dynamic light scattering (DLS) using a Malvern ZS nanosizer instru-ment. The hydrodynamic diameter was calculated from the inten-sity autocorrelation function using the optical properties of the liq-uids. The electrophoretic mobility measurements were performed using laser Doppler velocimetry and phase analysis light scattering, employing the same instrument (Malvern ZS nanosizer). To per-form the electrophoretic mobility, the nanoemulsions were diluted to 0.02 vol. % by adding ultrapure water. We used two such instru-ments in different laboratories. The electrophoretic mobility (μ) val-ues were converted into ζ-potential (ζ) valval-ues using the following expression: μ = εε0
ηζf (κa), where ε0is the vacuum permittivity, ε is the relative permittivity of water, η is the viscosity of the used liquid, f (κa) is Henry’s function, κ is the inverse Debye length (κ−1 =
√
ε0εkBT/2 ⋅ 103NAe2I, where kBis the Boltzmann constant, T is the temperature, NAis Avogadro’s number,e is the elementary charge, andI is ionic strength), and a is the radius of the droplet. Henry’s function has two solutions that are generally used in the software of the DLS instrument, namely, for κa → ∞, f (κa) → 1, resulting in the well-known Smoluchowski formula, or if κa → 0, f (κa) → 2/3, leading to the well-known Hückel formula. However, in the case of nanoemulsion droplets, one may find κa values in the range outside those two limiting cases, and one has to use a more complicated expression forf (κa). Ohshima proposed the following approximation for this case:43
f (κa) =2 3 ⎡ ⎢ ⎢ ⎢ ⎢ ⎢ ⎣ 1 + 1 2{1 + 2.5 κa(1+2e−κa)} 3 ⎤ ⎥ ⎥ ⎥ ⎥ ⎥ ⎦ , which we use.
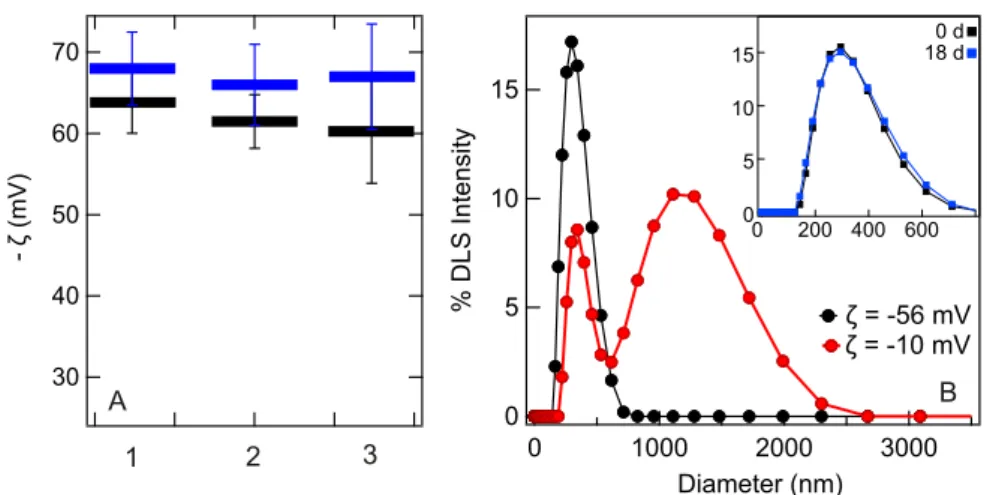
Figure 2(a) shows the converted ζ-potential values for nanoemulsions prepared using the three different glassware clean-ing procedures. Measurements were made in ninefold on the two instruments from the two different laboratories (represented by the black and the blue symbols). It can be seen that the nature of the glassware cleaning agent used to prepare the nanoemulsions has no significant influence on the final ζ-potential value. The size distribu-tion of one of the prepared droplet systems is shown inFig. 2(b)
(black), depicting the dynamic light scattering intensity distribu-tion. Nanoemulsions prepared with such ζ-potential values are gen-erally stable: The inset in Fig. 2(b) shows the DLS size distribu-tion of the same sample right after preparadistribu-tion and 18 days after preparation.
Next, we investigate the effect of having a “near-zero charge,” meaning “a ζ-potential of −10 ± 5 mV, with some samples having measured ζ-potential values within an error of zero”12 on the oil droplets’ stability. We started with a freshly prepared nanoemulsion at pH neutral conditions (ζ = −56 mV). We then reduced the pH of the solution such that the ζ-potential reached a value of −10 mV.
Figure 2(b)shows the intensity weighted size distribution as mea-sured with DLS directly after preparing the nanodroplets, adding HCl solution and determining the ζ-potential (this procedure took <5 min in total). The effect of the reduced magnitude in ζ-potential is clear: the droplets become immediately unstable as quantified by the broadening in the size distribution and appearance of droplets that are up to several micrometers in size.
In Refs.12and35, near-zero charged oil droplets were studied with sum frequency scattering (SFS). The recording time of this SFS experiment is 210 min,12,35and additional time to insert the sample and fine-tune the optical alignment is probably needed as well. As a consequence, we expect that the SFS data in Refs.12and35report on a droplet ensemble that changes in size, number density, and poten-tially also surface structure during the measurement. Previous SFS
studies have shown that SFS spectra as well as SFS patterns change when particles aggregate in a dispersion.44However, the SFS spec-tra are used as key evidence for the impurity hypothesis12,35because of the following observations: In Figs. 335and 4,12a shoulder peak with a center frequency and full width at half maximum (FWHM) of 2688 cm−1and ∼55 cm−1, respectively, is present and concluded to arise from non-interacting O-D oscillators. Nanodroplets with >10
μM of the sodium dodecyl sulfate (SDS) surfactant in the
disper-sion do not show this peak (Fig. S5),35leading to the interpretation that SDS has fully covered the surface and suppressed the free O-D groups (Fig. 535). This conclusion is inspired by previous sum frequency generation (SFG) studies on the planar CCl4/water inter-face.45These SFG spectra of water were found to be sensitive to the addition of nanomolar amounts of SDS.
In our opinion, there are several unsupported elements in this reasoning. First, the changes observed in the planar CCl4/water study occur primarily in the low frequency side of the spectra, involving hydrogen bonded water. The high frequency peak at ∼3670 cm−1 does not change its intensity with added SDS. Sec-ond, although the peak at 2688 cm−1 shares some similarity with a non-bonded O-D mode, the width and frequency are not match-ing well. A 50% H2O:D2O SFG spectrum of the air/water interface has peaks at 2725 cm−1and 2745 cm−1with widths of 10 cm−1and 14 cm−1, respectively (Fig. 346). Was this peak to be found in an SFS spectrum, symmetry dictates that it should be most intense in the SSP polarization combination, not in the PPP polarization21as was measured by Carpenter et al.12,35Other unexplained features relate to surface to volume ratio arguments: 10 μM of impurities will, under the most favorable conditions of complete surface adsorption (with the assumption of a projected surface area of 0.5 nm2per SDS molecule), cover ∼1.5% of the available droplet surface area (150 nm radius, 1 vol. %). There is no reason why this would lead to a full suppression of OD groups on the surface.47 Furthermore, in our
FIG. 2. Cleaning procedure and stability of nanodroplets. (a) ζ-potentials for 0.02 vol. % hexadecane nanoemulsions prepared using glassware cleaned with three different methods. 1–3 refer to glassware cleaning with piranha, NOCHROMIX®, and Deconex®solutions, respectively. The blue and black data are measurements performed with different instruments. The values of electrophoretic mobility averaged between two instruments (and corresponding diameter) are −3.1 × 10⁻⁸m2V−1s−1(200 nm) for
Piranha-cleaning, −3.0 × 10⁻⁸m2V−1s−1(180 nm) for NOCHROMIX®-cleaning, and −3.0 × 10⁻⁸m2V−1s−1(156 nm) for Deconex®-cleaning. (b) Distribution of size
for nanodroplets prepared at pH neutral conditions (black data). Within ∼5 min after reducing theζ-potential to −10 mV, the DLS size distribution changes drastically (red curve), indicating a highly unstable sample. Inset: (a) stable sample right after preparation (black data) and 18 days later (blue data).
previous experiments39we determined the trace amount of organic content in our aqueous glass stored solutions to be on the order of nM—three orders of magnitude lower than suggested. Finally, glass is a non-equilibrium compound that is fabricated by calcina-tion at >500○C.48 As a consequence, organic trace impurities will likely be removed from the glass surface by this process, so they are not likely to be the main source of glass impurity. Therefore, it is difficult to imagine how negatively charged organic surfac-tant type of impurities might be present on the glass in such high concentrations.
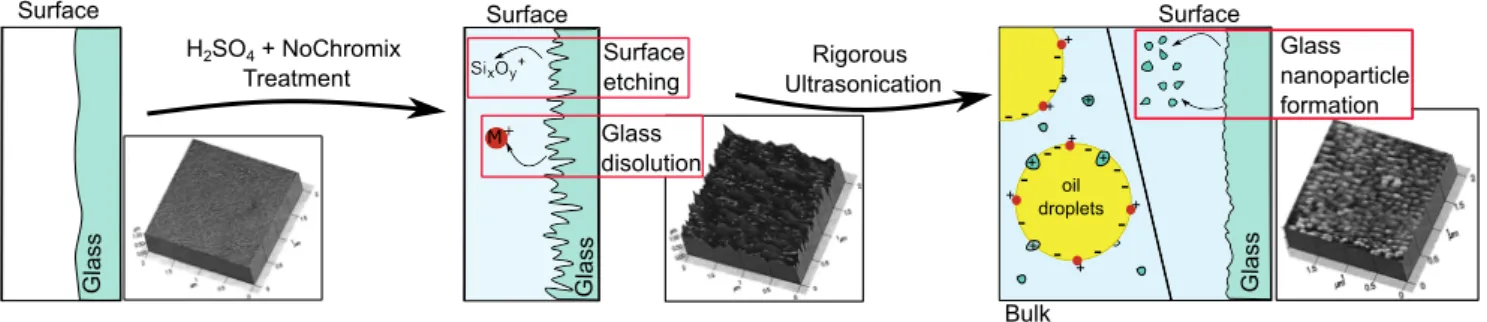
The effect of prolonged acid baths and sonication. For these reasons, we suggest a possible alternative mechanism for the obser-vation that “the creation of low charge nanoemulsions was found to be sensitive to the storage conditions of the aqueous phase and glassware cleaning procedures.”12,35Figure 3provides an illustration of the mechanism.
Besides the use of cleaning agent, another difference that stands out is the duration of the glass cleaning treatment. Carpenter et al.12,35state, “Glassware was first copiously rinsed and then soaked in a preliminary acid bath consisting of concentrated sulfuric acid mixed with NOCHROMIX (Godax Labs, Inc.) for at least 12 h. This glassware was then rinsed using ultrapure water and placed in a second, “isolated,” acid bath that also contained concentrated sul-furic acid and NOCHROMIX. After 24 h in the isolated acid bath, all glassware was rinsed with copious amounts of ultrapure water.” Exposure of glass to pH 0 conditions drastically changes the surface of the glass. This type of glass etching turns a smooth surface into a severely roughened surface with roughness on the order of sev-eral tens to hundreds of nanometers.49Under pH 0 conditions, glass dissolves at a rate of 1 g/m2d–100 g/m2d,51leading to a substantial amount of dissolved material (equivalent to ∼9 mM–0.9 M of the material in a 4 ml vial).Figure 3shows AFM images from Ref.49
of a glass surface before treatment (left panel), after 30 min boil-ing in 50% H2SO4(middle panel), and sonication for 30 min (right panel). Although rinsing influences the protonation equilibrium, it does not revert the surface back to its original state. The kinetics of acid-base chemistry of glass is slow51–53and strongly dependent on the type of glass employed and the history of the sample. Thus, the damaged glass consisting of a roughened surface and poten-tially multiple layers with different amounts of water content will
continue to leach positively charged species as well as silicates54 when placed in an aqueous solution (Fig. 3, middle panel). Upon sonication, nanosized glass particles, polymeric silicates, and posi-tively charged surface species will detach from the surface,52which is seen in the AFM image (right panel) ofFig. 3. These species may par-ticipate in the emulsification process and modify the electrophoretic mobility as well as the SFS spectrum. Furthermore, a striking dif-ference between the pH dependence inFig. 1(b)(red curve)12and the data inFig. 1(a)suggests that a deprotonation reaction is playing a role (with the inflection point of the data highlighted by a verti-cal line). The trend of the deprotonation reaction of the red curve inFig. 1(b)is similar to that of silica nanoparticles in water.55We note that this is only a possible mechanism because details such as the type of glass used, the type of sonicator, the duration of the soni-cation process, and the power used in the sonisoni-cation are all relevant but unknown to us.
Summarizing, we showed that bare oil droplets in neat water (nanoemulsions) are stable only when the electrophoretic mobil-ity is high enough to ensure the absence of coagulation by means of sufficiently large electrostatic repulsion, in agreement with ear-lier experiments28and theory.27The ζ-potential values derived from the mobility measurements are in the range of ∼−50 mV > ζ > −80 mV and are in good agreement with decades of literature reports. The cleaning procedure of the used glassware has no influence on the eventual ζ-potential value. Bringing the ζ-potential mag-nitude down to a value less than the thermal energy results in unstable droplets with large variations in size distribution. Finally, we propose an alternative explanation for the observed phenom-ena by Carpenter et al.12,35 based on the influence of prolonged etching and subsequent ultrasonication on glass chemistry. These results reduce the complexity of the nature of hydrophobicity to the following question: “What is the molecular source of charge on hydrophobic particles, droplets, and bubbles dispersed in water?” To answer this question, more sophisticated measurements are neces-sary than recording the electrophoretic mobility as a function of pH. With the ongoing development of interfacial nonlinear optical tech-niques such as sum frequency scattering of a wide spectral range,56 angle-resolved second harmonic scattering to measure surface potentials,57and molecular modeling, new insights are potentially within reach.
FIG. 3. Surface chemistry of glass during acid treatment. Schematic illustration of glass surface dissolution and etching during prolonged acid treatment and subsequent ultra-sonication. The insets show AFM images taken from Ref.49, which were made of a clean glass surface (left), a glass surface treated with heated 50% H2SO4aqueous
solution, and the same surface after sonication. The species that detach from the glass surface during sonication participate in the emulsification process and alter the oil droplet surface chemistry. Note that the treatment of the glass does not exactly follow the protocol of Carpenter et al.,12,35as the duration is much shorter. This should be negated by the heating, however. Other types of acid treatments can be found in Ref.50, all leading to surface etching.
ACKNOWLEDGMENTS
S.R. acknowledges the Julia Jacobi Foundation and the Swiss National Science Foundation (Grant No. 200021-182606-1). H.I.O. thanks EU MCSA-IF (Grant No. 899088) for financial support. H.B.d.A. was supported by the LabEx ENS-ICFP (Grant No. ANR-10-LABX-0010/ANR-10-IDEX-0001-02 PSL).
DATA AVAILABILITY
The data that support the findings of this study are available from the corresponding author upon reasonable request.
REFERENCES
1P. Ball,Chem. Rev.
108, 74 (2008).
2N. Agmonet al.,Chem. Rev.
116, 7642 (2016).
3J. K. Beattie and A. M. Djerdjev,Angew. Chem., Int. Ed.
43, 3568 (2004).
4
J. K. Beattie and A. Gray-Weale,Angew. Chem., Int. Ed.51, 12941 (2012).
5
J. C. Carruthers,Trans. Faraday Soc.34, 300 (1938).
6
P. Creuxet al.,J. Phys. Chem. B113, 14146 (2009).
7
W. Dickinson,Trans. Faraday Soc.37, 140 (1941).
8
K. G. Marinovaet al.,Langmuir12, 2045 (1996).
9
R. Váchaet al.,J. Am. Chem. Soc.133, 10204 (2011).
10
R. J. Hunter,Zeta Potential in Colloid Science (Academic Press, London, 1981).
11
R. J. Hunter,Introduction to Modern Colloid Science (Oxford University Press, Oxford, 1993).
12A. P. Carpenteret al.,J. Phys. Chem. B
124, 4234 (2020).
13K. Roger and B. Cabane,Angew. Chem.
124, 5723 (2012).
14M. Takahashi,J. Phys. Chem. B
109, 21858 (2005).
15R. Zimmermann, S. Dukhin, and C. Werner,J. Phys. Chem. B
105, 8544 (2001).
16J. Jablo´nski, W. Janusz, and J. Szczypa,J. Dispersion Sci. Technol.
20, 165 (1999).
17
C. Yanget al.,J. Colloid Interface Sci.243, 128 (2001).
18
X. B. Yanet al.,J. Phys. Chem. Lett.9, 96 (2018).
19
P. Jungwirth and D. J. Tobias,Chem. Rev.106, 1259 (2006).
20
P. Jungwirth and B. Winter,Annu. Rev. Phys. Chem.59, 343 (2008).
21
J.-S. Samsonet al.,Chem. Phys. Lett.615, 124 (2014).
22
J. K. Beattieet al.,J. Colloid Interface Sci.422, 54 (2014).
23P. K. Weissenborn and R. J. Pugh,J. Colloid Interface Sci.184, 550 (1996).
24E. Poli, K. H. Jong, and A. Hassanali,Nat. Commun.
11, 901 (2020).
25
D. V. Matyushov,Mol. Phys.112, 2029 (2014).
26
E. J. W. Verwey, J. T. G. Overbeek, and K. Van Nes,Theory of the Stability of Lyophobic Colloids: The Interaction of Sol Particles Having an Electric Double Layer (Elsevier, Amsterdam, 1948).
27D. J. Bonthuiset al.,Langmuir
26, 12614 (2010).
28
R. W. O’Brien, J. K. Beattie, and A. M. Djerdjev,J. Colloid Interface Sci.420, 70 (2014).
29
D. J. McClements,Crit. Rev. Food Sci. Nutr.47, 611 (2007).
30
T. T. Duignanet al.,J. Chem. Phys.149, 194702 (2018).
31E. Scoppolaet al.,Molecules24, 4113 (2019). 32Y. Uematsu, D. J. Bonthuis, and R. R. Netz,Langmuir
36, 3645 (2020).
33
W. C. Bigelow, D. L. Pickett, and W. A. Zisman,J. Colloid Sci.1, 513 (1946).
34
K. C. Jena, R. Scheu, and S. Roke,Angew. Chem., Int. Ed.51, 12938 (2012).
35
A. P. Carpenteret al.,Proc. Natl. Acad. Sci. U. S. A.116, 9214 (2019).
36
Z. Huanget al.,J. Phys. Chem. A117, 13412 (2013).
37K. Lunkenheimer, H. J. Pergande, and H. Krüger,Rev. Sci. Instrum.58, 2313
(1987).
38
H. I. Okuret al.,J. Phys. Chem. Lett.9, 6739 (2018).
39
H. I. Okuret al.,Chem. Phys. Lett.684, 433 (2017).
40
H. B. de Aguiaret al.,J. Am. Chem. Soc.132, 2122 (2010).
41
E. Zdraliet al.,J. Chem. Phys.150, 204704 (2019).
42
J. P. R. Day and C. D. Bain,Phys. Rev. E: Stat., Nonlinear, Soft Matter Phys.76, 041601 (2007).
43H. Oshima,J. Colloid Interface Sci.
168, 269 (1994).
44J. I. Dadap, H. B. de Aguiar, and S. Roke,J. Chem. Phys.
130, 214710 (2009).
45L. F. Scatena and G. L. Richmond,J. Phys. Chem. B
108, 12518 (2004).
46I. V. Stiopkinet al.,Nature
474, 192 (2011).
47E. Tyrodeet al.,J. Phys. Chem. C
111, 11642 (2007).
48J. W. Evans and L. C. De Jonghe,The Production and Processing of Inorganic
Materials (Springer, Cham, 2016).
49
H. K. Janget al.,J. Vac. Sci. Technol., A18, 401 (2000).
50
L. D. Eske and D. W. Galipeau,Colloids Surf., A154, 33 (1999).
51
D. Strachan,Geochim. Cosmochim. Acta219, 111 (2017).
52
M. Löbbuset al.,Langmuir14, 4386 (1998).
53A. Seidelet al.,Solid State Ionics101-103, 713 (1997). 54A. Ledieuet al.,J. Non-Cryst. Solids343, 3 (2004). 55K.-M. Kimet al.,Int. J. Nanomed.9(Suppl. 2), 29 (2014). 56E. Zdraliet al.,J. Phys. Chem. B123, 2414 (2019). 57A. Marchioroet al.,J. Phys. Chem. C