Kastamonu Education Journal
March 2018 Volume:26 Issue:2
kefdergi.kastamonu.edu.tr
The Validity and Reliability Study of Turkish Version of the Sentiments, Attitudes, and Concerns about Inclusive Education Scale
Kaynaştırma Eğitimi ile ilgili Düşünce, Tutum ve Endişe Ölçeğinin Türkçe Formunun Geçerlik ve Güvenirlik Çalışması
Nurcan CANSIZ
a, Mustafa CANSIZ
aaArtvin Çoruh Üniversitesi, Matematik ve Fen Bilimleri Eğitimi Bölümü, Artvin,Türkiye.
Öz
Bu çalışmanın amacı, Loreman, Earle, Sharma ve Forlin’in (2007) geliştirdikleri Sentiments, Attitudes, and Concerns about Inclusive Education (SACIE) ölçeğini Türkçeye uyarlamaktır. Türkçe formun yapı geçerliğini incelemek amacıyla 304 öğretmen adayından toplanan veriye Açımlayıcı Faktör Analizi uygulanmıştır. Sonrasında ölçek, 368 öğretmen adayına uygulanmış ve elde edilen veriye Doğrulayıcı Faktör Analizi yapılmıştır. Açımlayıcı faktör analizi ölçeğin Düşünce, Tutum ve Endişe olarak üç faktörlü yapısını ortaya koymuştur. Doğrulayıcı faktör analizi de toplamda 19 maddeden oluşan üç faktörlü ölçek yapısını desteklemiştir. Diğer taraftan ölçek, öğretmen adaylarının özyeterliklerini ortaya koymada makul bir yordama geçerliği göstermiştir. Ölçeğin Türkçeye uyarlanmasının önemi tartışılmıştır.
Abstract
The purpose of this study is to translate and adapt the Sentiments Attitudes and Concerns about Inclusive Education Scale (SACIE) for use in the Turkish context. For this purpose, translated version of SACIE was administered to 304 and 368 preservice teachers (PTs) to performing exploratory and confirmatory factor analysis respectively. The result of exploratory factor analysis revealed the three-factor structure of SACIE as sentiments, attitudes, and concerns. The confirmatory factor analysis supported three-factor structure of SACIE including 19 items. Moreover, the scale indicated a reasonable predictive validity to the self-efficacies of preservice teachers. The importance of the adaptation of the scale into Turkish was discussed.
Anahtar Kelimeler kaynaştırma eğitimi düşünce tutum endişe öğretmen adayları öz-yeterlik Keywords inclusive education sentiments attitudes concerns preservice teachers self-efficacy
1. Introduction
There is a shift in education systems of many countries in terms of educating students with special needs in regular schools (de Boer, Pij1, & Minnaert, 2011; Muwana & Ostrosky, 2014). This shift from separated classrooms to integra-ted classrooms forms the base of inclusion. Inclusion is a philosophy based on a notion of social justice that advocates equal access to all educational opportunities for all students regardless of the presence of difference (Loreman, Earle, Sharma, & Forlin, 2007). Inclusive education allows students who have disabilities to learn in regular schools with their peers who do not have disabilities and to feel a sense of belonging in these schools (Turnbull, Turnbull, & Wehmeyer, 2007).
Inclusion is defined as the practice of serving students with a full range of abilities and disabilities in the general education classroom with appropriate in-class support (Roach, 1995). A person who differs from the average or normal person in mental characteristics, sensory abilities, communication abilities, behavior and emotional development, or physical characteristics is accepted as disabled (Kirk et al., 2012). The supporters of inclusive education express that all students who have disabilities should be placed in regular classrooms in which they receive support services (Nielsen, 2002). United Nations Educational, Scientific, and Cultural Organization [UNESCO] (2009) policy guidelines on inclu-sive education emphasize education for all children who can be from different gender, ethnic and cultural backgrounds, affected by HIV viruses, and having disabilities and difficulties in learning. Burke and Sutherland (2004) also recom-mended the integration of each student in a school without considering their diverse needs.
The advantage of inclusive education is twofold. First; inclusive education supports disabled students in terms of their cognitive and psychological developments. It enables them to observe and model chronological age-appropriate, non-disabled students’ behaviors and actions and participate in educational and leisure time activities with them. Se-cond; non-disabled students learn how to behave to their disabled peers and they develop positive attitudes toward them. This is important for the fact that realizing many similarities and interests between students with disabilities and without disabilities often results in long-lasting friendships (Nielsen, 2002). It is also important for responsible societies whose members care each other and show respect to diverse needs and abilities. Besides, by accepting disabled students into general classrooms, they will develop a sense of belonging to the school community as other students, teachers, and staff (Eldar, Talmor, & Wolf-Zukerman, 2010).
The success of changes in education system depends on staff who is responsible to implement the change (Boyle, Topping, & Jindal-Snape, 2013). The key members to put inclusive education into practice are teachers whose willing-ness and cooperation is necessary for successful inclusion practices. The attitudes of teachers toward disabled students, their thoughts, and ideas, as well as their concerns about inclusive classrooms, are playing important roles in receiving and welcoming students with disabilities in their classrooms (Cansiz & Cansiz, 2015; Good & Brophy, 2007; Sharma, Forlin, Loreman, & Earle, 2006; Subban & Sharma, 2005). Pearce (2009) discussed that having positive attitudes toward inclusion is more important than having knowledge and abilities to implement inclusion. The literature also confirms that teachers’ attitude is an important factor for inclusive education. For example; Avramidis and Norwich (2002) found that teachers’ attitude toward inclusion is highly related to the success of inclusive education. Avramidis, Bayliss, and Burden (2000) also explored a positive relationship between teachers’ attitude and successful inclusive practices. The-refore, it is important to explore teachers’ attitude toward inclusive education.
Teachers’ behavior in inclusive classrooms can be affected by their self-efficacy. A number of studies repeatedly showed that teachers with high efficacy are more receptive to new and different ideas and more eager to utilize different teaching methods for the benefit of students (e.g., Berman et al., 1977; Ghaith & Yaghi, 1997; Guskey, 1988; Paraskeva, Bouta, & Papagianni, 2008; Soodak & Podell, 1994; Stein & Wang, 1988; Tschannen-Moran & Woolfolk Hoy, 2001). When reform efforts are made in educational policy, implementation of new programs becomes a current issue. Inclusive education also appeared as a result of changes in educational policies. It requires changes in curriculum, teaching met-hods, and teacher behaviors in the classrooms. Therefore, teacher characteristics such as self-efficacy may be a potential factor in successful inclusive education. Several recent studies also supported this idea (e.g., Cansiz & Cansiz, 2016; Jordan, Schwartz, & McGhie-Richmond, 2009; Malinen et al., 2013). Teachers’ self-efficacy has a potential in predic-ting their teaching practices about inclusion which, in turn, may be a potential source for prediction of effectiveness of inclusive education.
Self-efficacy was based on the social cognitive theory which considers not only individuals’ behavior but also the social environment in which the behavior is performed (Bandura, 2001). Self-efficacy beliefs form the foundation of human activity and provide an incentive for people to perform their tasks even if they meet difficulties or challenges
(Bandura, 2001). Individuals’ beliefs about their capacity to produce desired results are known as self-efficacy beliefs. Bandura (2001) stated that it is partly on the basis of efficacy beliefs that people choose what challenges to undertake, how much effort to expend in the endeavor, how long to persevere in the face of obstacles and failures, and whether failures are motivating or demoralizing. Self-efficacy beliefs play a central role in individuals’ actions and they are one of the powerful predictors of behavior (Bandura, 1977). One research area in the field of self-efficacy is related to the te-acher efficacy. Tschannen-Moran and Woolfolk Hoy (2001) defined tete-acher efficacy as a judgment of his or her capabi-lities to bring about desired outcomes of student engagement and learning. Teacher efficacy is related to how much they make effort in the classroom, the outcomes they set for their students and the desire for achieving an effective teaching (Tschannen-Moran & Woolfolk Hoy, 2001).
In light of this, the overarching research purpose of this study is to validate The Sentiments Attitudes and Concer-ns about Inclusive Education (SACIE) scale in the Turkish context. In order to provide coConcer-nstruct-related evidence for validity, the factor structure of the scale was uncovered and verified. Moreover, the relationship between SACIE and Teachers’ Sense of Efficacy Scale (TSES) was explored to ensure the predictive validity of the scale. Self-efficacy may be a good indicator of the predictive validity of SACIE scale because we contend that there should be a close associa-tion between PTs’ self-efficacy and their attitudes, thoughts, and concerns about inclusive educaassocia-tion. For example, we believe that if a teacher has high self-efficacy in teaching, then s/he may have more positive attitudes towards inclusive education and s/he may be less concerned in receiving a student with disabilities to her/his classroom.
2. Method
Research Purpose and Research Questions
This study included translation, adaptation, and validation of an instrument to evaluate preservice teachers’ (PTs) sentiments, attitudes and concerns about inclusive education. The specific research questions included:
1. How reliable and valid is the SACIE scale in Turkish context?
2. Is there a relationship between PTs’ sentiments, attitudes, and concerns about inclusive education and their self-efficacy beliefs?
Sample
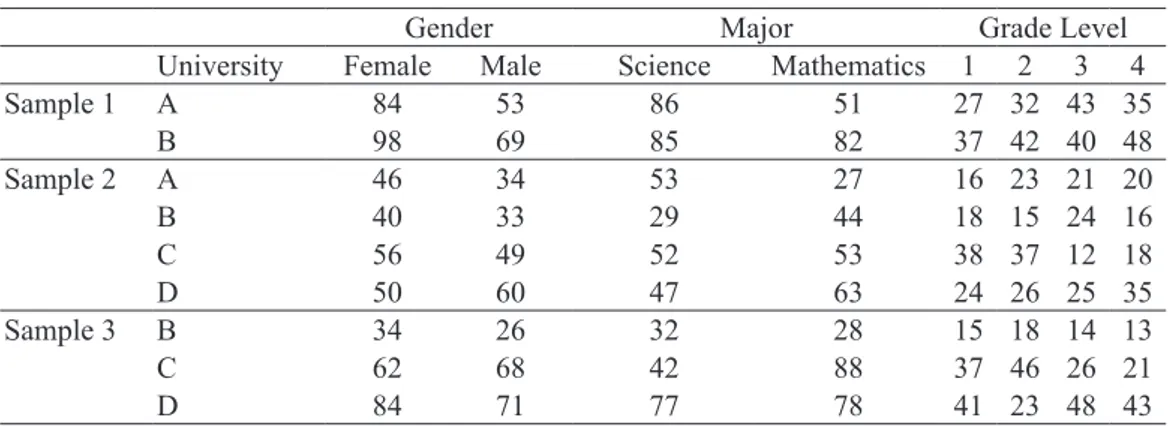
Three different samples of PTs participated in this study. All samples included preservice science and mathematics teachers. The first sample included 304 PTs from two different universities. These data were used to explore factor stru-cture of SACIE scale by exploratory factor analysis. In order to cross-validate the SACIE scale, it was administered to a second sample of 368 PTs from four different universities. These data were used to confirm the factor structure of the SACIE scale through confirmatory factor analysis. Finally, the confirmed scale, as well as Teachers’ Sense of Efficacy Scale (TSES), was administered to 345 PTs from three different universities to examine the relationship between these two constructs. The descriptive statistics for three samples were provided in Table 1.
Table 1. Descriptive statistics of the samples
Gender Major Grade Level
University Female Male Science Mathematics 1 2 3 4
Sample 1 A 84 53 86 51 27 32 43 35 B 98 69 85 82 37 42 40 48 Sample 2 A 46 34 53 27 16 23 21 20 B 40 33 29 44 18 15 24 16 C 56 49 52 53 38 37 12 18 D 50 60 47 63 24 26 25 35 Sample 3 B 34 26 32 28 15 18 14 13 C 62 68 42 88 37 46 26 21 D 84 71 77 78 41 23 48 43 Instrument
The Sentiments Attitudes and Concerns about Inclusive Education Scale (SACIE)
SACIE was originally developed by Loreman et al. (2007). It was used to assess PTs’ sentiments, attitudes, and con-cerns about inclusive education. The questionnaire included 19 items in a 4-point Likert scale response format (from strongly agree to strongly disagree). Loreman et al. underlined that three other valid instruments guided the development
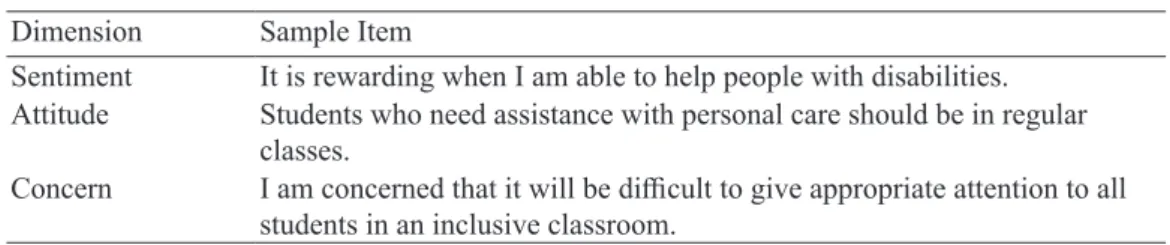
of SACIE: Interactions with People with Disabilities Scale (Forlin et al., 2001; Gething, 1994), the Concerns about Inclusive Education Scale (Sharma & Desai, 2002), and the Attitudes Toward Inclusive Education Scale (Wilczenski, 1992, 1995) as well as conceptual reasoning of the experts. The instrument was first translated into Turkish by two inde-pendent bilingual researchers. Consistency was established among researchers in terms of translation of items. Another independent bilingual professor translated the instrument from Turkish to original language back in order to inspect pos-sible translation problems. No major problem was observed in terms of conceptual and cultural correspondence of the two texts. As a result, the consistency was reached on Turkish items. Table 2 illustrates sample items for each dimension of SACIE scale.
Table 2. Dimensions and sample items of SACIE scale
Dimension Sample Item
Sentiment It is rewarding when I am able to help people with disabilities. Attitude Students who need assistance with personal care should be in regular
classes.
Concern I am concerned that it will be difficult to give appropriate attention to all students in an inclusive classroom.
Teachers’ Sense of Efficacy Scale (TSES)
TSES was developed by Tschannen-Moran and Woolfolk Hoy (2001) and adapted into Turkish by Çapa, Çakıroğlu, and Sarıkaya (2005). The scale consisted of three subscales named as Efficacy for Student Engagement (SE), Efficacy for Instructional Strategies (IS), and Efficacy for Classroom Management (CM) including 24 items in total. The coef-ficient alpha values for the preservice teachers were .82 for SE, .86 for IS, and .84 for CM. For the whole scale, the reliability of efficacy scores was .93. Table 3 illustrates sample items for each of the dimension of TSES.
Table 3. Dimensions and Sample Items of TSES
Dimension Sample Item
Efficacy for Student
Engagement How much can you do to improve the understanding of a student who is failing? Instructional Strategies To what extent can you craft good questions for your students? Classroom
management To what extent can you make your expectation clear about student behavior?
Data Collection and Analysis
The instrument, SACIE, was initially administered in two different universities to perform exploratory factor analysis (EFA). More specifically principal component analysis (PCA) was conducted with the aim of exploring the interrelati-onships among variables and to explore whether the factor structure of the Turkish version is consistent with the original scale. After obtaining supporting evidence from exploratory factor analysis, the adapted version of the scale was admi-nistered to a second sample of PTs in four different universities. These data were analyzed through confirmatory factor analysis (CFA) using LISREL. This enabled to confirm the relationship between variables and factors drawn from the principal component analysis. In the last phase of the data collection procedure, TSES and the adapted version of SACIE were administered to the third set of PTs from three different universities. Multiple regression analysis was conducted to predict the contribution of teachers’ sense of self-efficacies to their sentiments, attitudes, and concerns about inclusive education.
3. Results
Reliability Analysis of the Instruments
In each administration, the reliabilities of the instruments were evaluated to inspect whether the instrument is reliable with our particular samples. The total reliability coefficients (Cronbach Alpha) for SACIE scale were found to be .89, .93, and .91 for the first, second, and third samples, respectively. Besides, the total reliability of TSES was found as .88. These results provided evidence that both SACIE and TSES had good reliability with the samples of the study.
Result for Exploratory Factor Analysis
performing PCA, the assumptions were checked to assess the appropriateness of the data. Bartlett’s Test of Sphericity was statistically significant (p < .001) and Kaiser-Meyer-Oklin value was .79, exceeding the recommended value of .60 (Kaiser, 1974). Moreover, most of the coefficients in correlation matrix were above the critical value of .30. All of these statistics provided evidence for the suitability of the data for conducting PCA.
The result of PCA showed that there were four factors with eigenvalues bigger than 1 explaining reasonable percent of the variance (66.8 % in cumulative). However, the screeplot indicated that there is a clear break between third and fourth factors and first three factors explain 63.4 % of the variance in total. Similarly, parallel analysis using Monte Carlo PCA (Watkins, 2000) suggested extracting three factors. Based on screeplot and parallel analysis, it was decided to retain three factors for further investigation.
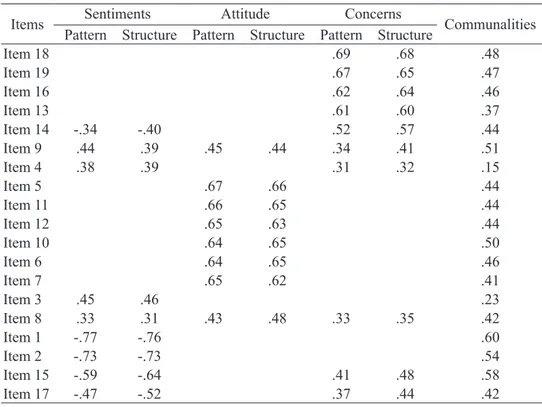
The three-factor solution of SACIE scale explained 63.4 % of the variance in cumulative. The first factor explained 31.5 % of the total variance by itself. The second and the third factors contributed 20.7 % and 11.2 % to the three-factor solution respectively. When the item loadings on each factor were investigated, the three-factor solution was consistent with the original study. This result indicated that three-factor structure of SACIE is well suited with the sample in this study. The loadings for each item of a three-factor solution of SACIE were given in Table 4.
Table 4. Pattern and Structure Matrix for Principal Component Analysis of SACIE
Items Pattern Structure Pattern Structure Pattern StructureSentiments Attitude Concerns Communalities
Item 18 .69 .68 .48 Item 19 .67 .65 .47 Item 16 .62 .64 .46 Item 13 .61 .60 .37 Item 14 -.34 -.40 .52 .57 .44 Item 9 .44 .39 .45 .44 .34 .41 .51 Item 4 .38 .39 .31 .32 .15 Item 5 .67 .66 .44 Item 11 .66 .65 .44 Item 12 .65 .63 .44 Item 10 .64 .65 .50 Item 6 .64 .65 .46 Item 7 .65 .62 .41 Item 3 .45 .46 .23 Item 8 .33 .31 .43 .48 .33 .35 .42 Item 1 -.77 -.76 .60 Item 2 -.73 -.73 .54 Item 15 -.59 -.64 .41 .48 .58 Item 17 -.47 -.52 .37 .44 .42
Result for Confirmatory Factor Analysis
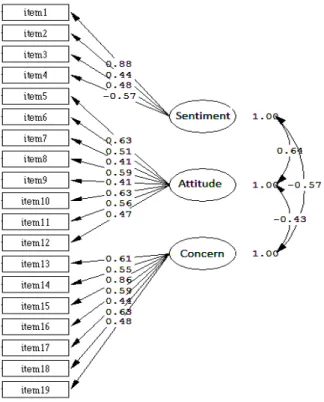
The confirmatory factor analysis was performed with the purpose of validating previously obtained factor structure. The model was tested through LISREL. The hypothesized model is shown in Figure 1 where rectangles indicate items on the scale and circles indicate latent variables. The hypothesized model consisted of three factors. The first factor sen-timent included four items. There were eight items for the attitudes factor and seven items for concerns factor.
Before running the LISREL, a preliminary analysis was conducted to evaluate required assumptions. Since inspecti-on of univariate outlier indicated that Participant 11 (z = 4.08, p < .01) and Participant 40 (z = 4.02, p < .01) had extreme scores, their data were deleted from the analysis. The interpretation of Mahalanobis distance indicated that another par-ticipant’s score was a multivariate outlier, (p < .01), and the data from this participant was deleted from the data as well. This participant’s scores on item 5 and 9 were extremely high while his score on item 10 was extremely low. There was not any missing value in the dataset.
As seen in Figure 1, four items were significantly loaded to Sentiments dimension. Among them, only item 4 was negatively loaded. Careful examination of this item indicated that although it has a positive form, its meaning is ne-gative and this was an expected result. Among these items, item 1 explained the greatest variance (R2 = .77) regarding
reached statistical significance with positive loadings. An inspection of coefficient revealed that item 5 and 10 explained equal and greatest variance (R2 = .40) of this dimension. In terms of Concerns dimension, seven items of SACIE scale
were positively and significantly loaded on this latent variable. The interpretation of coefficient showed that item 15 accounted for the greatest variance of the dimension (R2 = .74).
The model fit in Figure 1 was evaluated based on different statistical parameters as guided by Schumacker and Lomax (2010) and Kline (2011). These are chi-square (χ2), comparative fit index (CFI), normal fit index (NFI), and
root-mean-square error of approximation (RMSEA). A non-statistically significant chi-square value is required for the model fit (Schumacker & Lomax, 2010). It means that the sample covariance matrix and the reproduced model-implied covariance matrix are similar. In other words, it tests the null hypothesis of a good fit. In this study, the chi-square statis-tic was non-significant, indicating a good model fit to the sample variance-covariance matrix (χ2 = 9.76, p = .12). Other
model fit indices also indicate a good model fit. According to Kline (2011), NFI and CFI statistics which are greater than .90 reflects a good model fit. The confirmatory factor analysis with the sample data also met the requirements for these indices satisfactorily (NFI = .93 and CFI = .95). Goodness-of-fit (GFI) and adjusted goodness-of-fit (AGFI) indices are other two indices indicating a good model fit (Schumacker & Lomax, 2010). For an acceptable model fit, they should be around .95 (Schumacker & Lomax, 2010). GFI and AGFI were found to be .89 and .90 respectively, indicating adequate fits. Accordingly, the result of confirmatory factor analysis revealed a good model fit for the translated version of SACIE scale with three factors including 19 items in total.
Figure 1. Three-factor structure model of SACIE scale
In addition to the CFA, bivariate correlation analyses were performed to describe the statistical significance as well as the strength and the direction of the relationship among the three factors of SACIE. Based on the results, it was found that there was a strong positive correlation between sentiments and attitudes factors (r = .64, n = 365, p = .002). These two factors were negatively correlated with concerns factor. While the magnitude of the relationship between sentiments and concerns was strong (r = -.57, n = 365, p = .004); the magnitude of the relationship between attitudes and concerns was found to be medium (r = -.43, n = 365, p = .01). These findings point out that PTs with less concern are likely to have positive sentiments and favorable attitudes toward incorporation of disabled students into general education classrooms.
Result for the Relationship Between PTs’ SACIE Scores and Their Sense of Efficacies
Having obtained evidence for the validity of SACIE scale, multiple regression analysis was used to explore the predictive validity of SACIE on PTs’ self-efficacies. A linear combination of three subscales of self-efficacy, namely self-efficacies for student engagement (SE), instructional strategies (IS) and classroom management (CM), was utilized
to predict PTs’ scores on subscales of SACIE scale. Preliminary analyses of minimum sample size, normality, linearity, multicollinearity, and homoscedasticity showed that there was no violation of required assumptions.
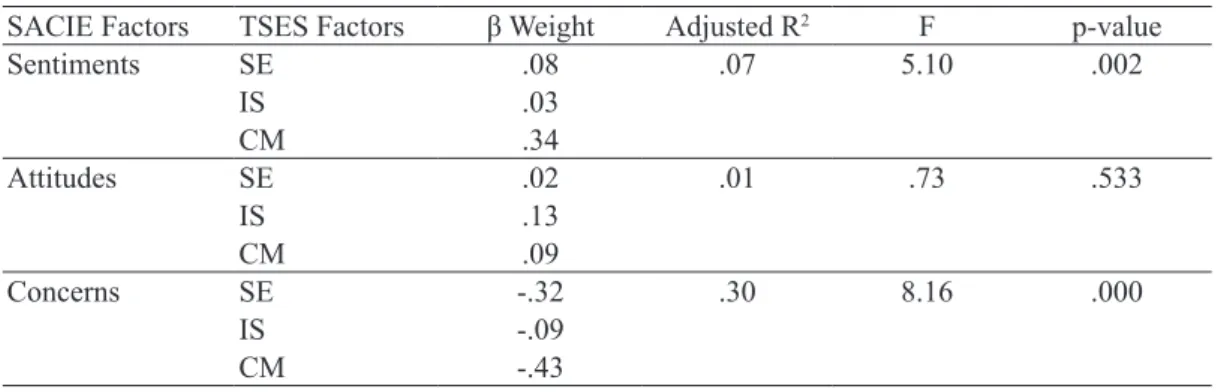
PTs’ self-efficacy scores for CM, among other predictor variables (i.e. self-efficacy for SE and IS), contributed signi-ficantly to their sentiments toward inclusion. PTs’ self-efficacy scores for CM explained 7.1 % of the variability in their sentiment scores of the SACIE (R2 = .071, F (3, 341) = 5.10, p = .002). The size and the direction of the relationships (standardized β = .34) suggest that having high self-efficacy for classroom management may contribute to positive sen-timents toward inclusion. In other words, PTs who believe that they have better classroom management skills have more positive sentiments toward receiving disabled students to their future classrooms.
All three predictor variables –self efficacy for SE, IS, and CM- contributed to the prediction of concerns about inclu-sive education significantly. These variables explained 28.8% of the total variability in PTs’ concern scores (R2 = .288, F (3, 341) = 8.16, p < .001). A close examination of each predictor variables indicated that self-efficacy for CM made the largest unique contribution to explain PTs’ scores on concerns about inclusive education (standardized β = -.43). The direction of standardized β coefficient signed that having high self-efficacy for CM may lessen PTs’ concerns about ha-ving disabled students in general education classrooms. The second largest variance in the concerns factor was uniquely explained by self-efficacy for SE (standardized β = -.32). The sign of standardized β coefficient implied that preservice teachers who have lower self-efficacy for SE are expected to have higher concerns for inclusive education. Although the last predictor variable self-efficacy for IS made the least contribution to the variability in concerns scores, it still made a statistically significant contribution to the model (standardized β = -.09, p = .016). As it was expected, PTs with higher self-efficacy for instructional strategies tended to display lower concerns about accepting students with disabilities to their future classrooms.
For attitudes toward inclusion, three of the predictor variables explained only 1.1 % of total variance (R2 = .011). None of the predictor variables contributed to the model significantly (F (3, 341) = .73, p = .533). Standardized β statistics were .13 for IS; .09 for CM; and .02 for SE. The sign of each β value pointed out that PTs who possess high self-efficacies for instructional strategies, classroom management, and student engagement, have a tendency to display a favorable attitude toward accepting disabled students to their future classrooms.
Overall, the results revealed that PTs’ self-efficacies for classroom management may influence their sentiments about inclusive education. Moreover, their self-efficacies for classroom management, instructional strategies, and student engagement may have an impact on their concerns about inclusive education. On the other hand, PTs’ sense of self-ef-ficacies does not contribute to their attitudes toward inclusive education significantly. Table 5 summarizes the overall results of multiple regression analyses.
Table 5. Multiple Regression Results
SACIE Factors TSES Factors β Weight Adjusted R2 F p-value
Sentiments SE .08 .07 5.10 .002 IS .03 CM .34 Attitudes SE .02 .01 .73 .533 IS .13 CM .09 Concerns SE -.32 .30 8.16 .000 IS -.09 CM -.43
4. Discussion, Conclusion, and Implications
One of the main purposes of this study is to find out validity evidence for the SACIE scale in the Turkish context. For this aim exploratory and confirmatory factor analyses were performed with different samples of PTs. The pilot study enabled to explore the factor structure of the Turkish version of the scale through PCA. The 19 items of original SACIE scale were reduced to three factors. When the item loading patterns were investigated, the same set of factors was found as in the original scale. This result showed that Turkish version of SACIE scale may also measure three important cons-tructs about inclusive education which are sentiments, attitudes, and concerns.
not only utilized PCA to explore components of the scale but also performed CFA to establish the factor structure of the scale. Therefore, further evidence was obtained for validity and reliability of the SACIE scale. Based on CFA result, the Turkish version of the SACIE scale has been validated with three factors including 19 items as suggested by the original scale. Overall, these results showed that the SACIE scale can be used to explore the profiles of PTs in terms of their sentiments, attitudes, and concerns about including disabled students into general education classrooms.
In addition, this study seeks to find out empirical evidence for the predictive validity of the scale by exploring the relationship between PTs’ SACIE response and their sense of self-efficacies. The results showed that there is a relations-hip between preservice teachers’ sense of self-efficacies for classroom management and their sentiments for including disabled students into general education classrooms. Additionally, teachers’ sense of self-efficacies regarding classroom management, instructional strategies, and student engagement contributed to the prediction of PTs’ concerns about inc-lusive education.
The Turkish version of SACIE scale is, no doubt, important for generating profiles of PTs. Moreover, eliciting PTs’ sentiments, attitudes, and concerns about inclusion can provide feedback on the effectiveness of teacher education prog-rams in terms of inclusion. For instance, if the majority of PTs hold negative sentiments and attitudes with high concerns about inclusion, it can be assumed that PTs do not get an adequate amount of knowledge and skills in teaching students with diverse needs in their teacher education programs. Therefore, such a scale is needed in the Turkish context.
This study proposed some insights for future research. The success of inclusion depends on a variety of factors such as teacher-related variables (e.g., teachers’ attitudes, self-efficacies, knowledge, and past experiences), school-related variables (e.g., availability of support and resources), and student-related variables (e.g., type and severity of disability). In particular, teachers’ sense of efficacy is an important factor in determining their behavior in the classroom (Palmer, 2006; Tschannen-Moran & Woolfolk Hoy, 2001). Previous studies pointed out that a majority of teachers express con-cerns about classroom management and instructional skills for teaching students with disabilities (Romi & Leyser, 2006; Shevlin, Winter, & Flynn, 2013). These concerns can be lessened by increasing teachers’ self-efficacies (Emmer & Hickman, 1991; Jordan, Kırcaali-İftar, & Diamond, 1993). Having confidence in classroom management skills, instru-ctional and student engagement strategies may help teachers to get used to heterogeneous classrooms in which students come from diverse abilities. The result of this study has given credence to the previous studies but added the dimension that teachers’ self-efficacies should be considered while making reforms for inclusion. The challenge is to create a ba-lanced teacher education program that increases PTs’ motivation to take part in inclusive education as well as to develop a high sense of self-efficacy. Since teacher education programs play an important role in attaining these objectives, teachers should actively take part in this process. As Kavale and Forness (2000) emphasized, inclusion appears to be not something that simply happens, but rather something that requires careful thought and preparation. Teachers should be prepared for different instructional strategies for fostering disabled students’ engagement in inclusive classrooms. Inclusion does not only mean having those students in general classrooms physically, but also mean having them as mentally, socially, and emotionally.
Besides, teacher education programs, regardless of major area, should offer at least several courses including basic training in special education. For example, there may be courses such as curriculum development for inclusive classro-oms, inquiry approach to teaching and learning in inclusive classroclassro-oms, and practice teaching in inclusive classrooms. These courses should provide preservice teachers with the opportunity for pedagogical practices, as well as direct ex-perience in inclusive classrooms. This is consistent with other studies as well (e.g., Burstein, Sears, Wilcoxen, Cabello, & Spagna, 2004; DeLuke, 2000; Fisher, Frey, & Thousand, 2003; Gulec-Aslan, 2014; Roberts & Mather, 1995). For example, DeLuke (2000) underlined that many teachers have worries about inclusive classrooms because they feel that they are not well-prepared for inclusive classrooms. Preparing PTs equipped with required skills for inclusive education will help them to develop more favorable attitudes toward inclusion which, in turn, help to implement successful inc-lusion. Since attitudes shape in a long time, it is really difficult to modify PTs’ attitudes if they once develop negative attitudes toward inclusion in their teacher education programs. Therefore, needed are more efforts in teacher education programs for training PTs to teach in inclusive classrooms.
Acknowledgement
The preliminary results of this study have been presented in the form of an oral presentation at the annual conference of National Association for Research in Science Teaching (NARST, 2011) Orlando, Florida.
5. References
Avramidis, E., Bayliss, P., & Burden, R. (2000). A Survey into Mainstream Teachers’ Attitudes towards the Inclusion of Children with Special Educational Needs in the Ordinary School in One Local Education Authority. Educational Psychology, 20(2), 191-211.
Avramidis, E., & Norwich, B. (2002). Teachers’ attitudes towards integration/inclusion: A review of the literature. European Jour-nal of Special Needs Education, 17(2), 129-147.
Bandura, A. (1977). Self-efficacy: Toward a unifying theory of behavioral change. Psychological Review, 84(2), 191. Bandura, A. (2001). Social cognitive theory: An agentic perspective. Annual Review of Psychology, 52(1), 1–26.
Berman, P., McLaughlin, M., Bass, G., Pauly, E., & Zellman, G. (1977). Federal programs supporting educational change: Vol. II. Factors affecting implementation and continuation. Santa Monica, CA.
Boyle, C., Topping, K., & Jindal-Snape, D. (2013) Teachers’ attitudes towards inclusion in high schools. Teachers and Teaching: Theory and Practice, 19(5), 527-542.
Burke, K., & Sutherland, C. (2004). Attitudes towards inclusion: Knowledge vs. experience. Education, 125(2), 163–72.
Burstein, N., Sears, S., Wilcoxen, A., Cabello, B., & Spagna, M. (2004). Moving toward inclusive practices. Remedial and Special Education, 25(2), 104-116.
Cansiz, M., & Cansiz, N. (2015). Preservice science teachers’ concerns for educating students with special needs in their future classrooms. The Eurasia Proceedings of Educational & Social Sciences, 2, 36-39.
Cansiz, N., & Cansiz, M. (2016). Teaching science in inclusive classrooms: Preservice science teachers’ knowledge and views about inclusive education. Paper presented in National Association for Research in Science Teaching (NARST).
Çapa, Y., Çakıroğlu, J., & Sarıkaya, H. (2005). Öğretmenlik öz yeterlik ölçeği Türkçe uyarlamasının geçerlik ve güvenirlik çalışması. [Adaptation of teacher self-efficacy scale into Turkish] Eğitim ve Bilim, 30(137), 74–81.
De Boer, A., Pijl, S. J., & Minnaert, A. (2011). Regular primary school teachers’ attitudes towards inclusive education: A review of the literature. International Journal of Inclusive Education, 15(3), 331–353.
DeLuke, S. (2000). A model for merging programs in special education and elementary education: The inclusive education teacher preparation program at the College of Saint Rose. In L. Sherry & F. Spooner (Eds.), Unified teacher preparation programs for general and special educators. Reston, VA: National Council for Exceptional Children.
Eldar, E., Talmor, R., & Wolf-Zukerman, T. (2010). Successes and difficulties in the individual inclusion of children with Autism Spectrum Disorder (ASD) in the eyes of their coordinators. International Journal of Inclusive Education, 14, 97–114.
Emmer, T. E. & Hickman, J. (1991). Teacher efficacy in classroom management and discipline. Educational and Psychological Measurement, 51(3), 755–765.
Fisher, D., Frey, N., & Thousand, J. (2003). What do special educators need to know and be prepared to do for inclusive schooling to work? Teacher Education and Special Education, 26(1), 42-50.
Forlin, C., Jobling, A., & Carroll, A. (2001). Preservice teachers’ discomfort levels toward people with disabilities. The Journal of International Special Needs Education, 4, 32-38.
Gething, L. (1994). The interaction with disabled persons scale. Journal of Social Behavior and Personality, 9(5), 23-42.
Ghaith, G., & Yaghi, H. (1997). Relationships among experience, teacher efficacy, and attitudes toward the implementation of instructional innovation. Teaching and Teacher Education, 13(4), 451-458.
Good, T. L., & Brophy, J. (2007). Looking in classrooms (10th ed.). New York, NY: Harper Collins.
Gulec-Aslan, Y. (2014). Preservice mental retardation education teachers’ perceptions toward autism spectrum disorders field. Kastamonu Education Journal, 22(3), 869-896.
Guskey, T. R. (1988). Teacher efficacy, self-concept, and attitudes toward the implementation of instructional innovation. Teaching and Teacher Education, 4(1), 63-69.
Jordan, A., Kircaali-Iftar, G. & Diamond, C. T. P. (1993). Who has the problem, the student or the teacher? Differences in teacher beliefs about their work with at-risk and integrated exceptional students. International Journal of Disability, Development, and Education, 40, 45–62.
Jordan, A., Schwartz, E., & McGhie-Richmond, D. (2009). Preparing teachers for inclusive classrooms. Teaching and Teacher Education, 25(4), 535–542.
Kaiser, H. (1974). An index of factorial simplicity. Psychometrika, 39, 31-36.
Kavale, K. A., & Forness, S. R. (2000). History, rhetoric, and reality: Analysis of the inclusion debate. Remedial and Special Edu-cation, 21,279– 296
Kirk, S., Gallagher, J., Coleman, M. R., & Anastasiow, N. J. (2012). Educating exceptional children. Belmont: Cengage Learning. Kline, R. B. (2011). Principles and practice of structural equation modeling (3rd ed.). New York: Guilford Press.
Loreman, T., Earle, C., Sharma, U., & Forlin, C. (2007). The development of an instrument for measuring pre-service teachers’ sentiments, attitudes, and concerns about inclusive education. International Journal of Special Education, 22(1), 150–159. Malinen, O.-P., Savolainen, H., Engelbrecht, P., Xu, J., Nel, M., Nel, N., & Tlale, D. (2013). Exploring teacher self-efficacy for
inclusive practices in three diverse countries. Teaching and Teacher Education, 33, 34–44.
Muwana, F. C., & Ostrosky, M. M. (2014). Factors related to pre-service teachers’ attitudes towards inclusion: A case for Zambia. International Journal of Inclusive Education, 18(8), 763–782.
Nielsen, L. B. (2002). Brief reference of student disabilities: ...With strategies for the classroom. Thousand Oaks, California: Corwin Press.
Palmer, D. (2006) Durability of changes in self-efficacy of preservice primary teachers, International Journal of Science Educa-tion, 28(6), 655–671.
Paraskeva, F., Bouta, H., & Papagianni, A. (2008). Individual characteristics and computer self-efficacy in secondary education teachers to integrate technology in educational practice. Computers & Education, 50(3), 1084–1091.
Roach, V. (1995). Supporting inclusion: Beyond the rhetoric. Phi Delta Kappan, 77(4), 295–99.
Roberts, R., & Mather, N. (1995). The return of students with learning disabilities to regular classrooms: A sellout? Learning Di-sabilities Research and Practice: A Publication of the Division for Learning DiDi-sabilities, Council for Exceptional Children, 10(1), 46-58.
Romi, S., Leyser, Y. (2006). Exploring inclusion pre-service training needs: A study of variables associated with attitudes and self-efficacy beliefs. European Journal of Special Needs Education, 21(1), 85-105.
Schumacker, R. E., & Lomax, R. G. (2010). A beginner’s guide to structural equation modeling (3rd ed.). New York: Routledge. Sharma, U., & Desai, I. (2002). Measuring concerns about integrated education in India. Asia & Pacific Journal on Disability,
5(1), 2-14.
Sharma, U., Forlin, C., Loreman, T., & Earle, C. (2006). Pre-service teachers’ attitudes, concerns, and sentiments about inclusive education: An international comparison of the novice pre-service teacher. International Journal of Special Education, 21, 80–93. Shevlin, M., Winter, E., & Flynn, P. (2013). Developing inclusive practice: Teacher perceptions of opportunities and constraints in
the Republic of Ireland. International Journal of Inclusive Education, 17(10), 1119–1133.
Soodak, L. C., & Podell, D. M. (1994). Teachers’ thinking about difficult-to-teach students. Journal of Educational Research, 88(1), 44-51.
Stein, M. K. & Wang, M. C. (1988). Teacher development and school improvement: The process of teacher change. Teaching and teacher education, 4(2), 171-187.
Subban, P., & Sharma, U. (2005). Understanding educator attitudes toward the implementation of inclusive education. Disability Studies Quarterly, 25, 1–19.
Pearce, M. (2009). The inclusive secondary school teacher in Australia. International Journal of Whole Schooling, 5(2), 1-15. Tschannen-Moran, M., & Woolfolk Hoy, A. (2001). Teacher efficacy: Capturing an elusive construct. Teaching and teacher
edu-cation,17, 783–805.
Turnbull, A. P., Turnbull, H. R., & Wehmeyer, M. L. (2007). Exceptional lives: special education in today’s schools (5th ed.). Up-per Saddle River, N.J: Pearson/Merrill/Prentice Hall.
United Nations Educational, Scientific and Cultural Organization (2009). Policy guidelines on inclusion in education. Paris, Fran-ce: UNESCO.
Watkins, M.W. (2000). Monte Carlo PCA for parallel analysis [computer software]. State College, PA: Ed & Psych Associates. Wilczenski, F. L. (1992). Measuring attitudes toward inclusive education. Psychology in the Schools, 29(1), 306-312.
Wilczenski, F. L. (1995). Development of a scale to measure attitudes toward inclusive education. Educational and Psychological Measurement, 55(2), 291-299.