ORIGINAL RESEARCH
How Does Education Affect Political Trust?: An Analysis
of Moderating Factors
Meral Ugur‑Cinar1 · Kursat Cinar2 · Tekin Kose3 Accepted: 4 August 2020 / Published online: 9 August 2020 © Springer Nature B.V. 2020
Abstract
This article aims to understand the correlates of political trust by delving into the multiple interactive effects of education in democratic states throughout the world. It asks whether education raises political trust by increasing the stakes of the citizens in the system and whether education diminishes trust as a result of being abler to evaluate the existence of corruption in a given country. It also taps into how post-materialism as an individual-level factor affects this equation by activating critical judgments toward political institutions. The findings show that, indeed, the effect of education on political trust is very context-dependent. Political trust and education are positively correlated in more meritocratic countries and negatively correlated in the more corrupt ones. Post-material values, com-bined with educational attainment, tend to lower political trust to a certain extent yet this effect is surpassed by the presence or absence of meritocracy or political corruption. We also find that the effect of education on political trust becomes more pronounced as the level of education increases, with university graduates being the most susceptible to the effects of meritocracy and corruption on their trust levels.
Keywords Education · Political trust · Meritocracy · Corruption · Post-materialism
1 Introduction
This article examines the context-specific effects of education on political trust. It does so by looking at how educational attainment is moderated by post-materialism, meritoc-racy, and political corruption in determining trust levels of citizens toward political institu-tions. While there are a multitude of valuable studies in the area of political trust and its correlates, there are still interesting research questions that beg addressing in the educa-tion–political trust nexus. As Mayne and Hakhverdian (2016, p. 1) argue, the role of edu-cation in political trust is not sufficiently analyzed since eduedu-cation is usually included as a * Kursat Cinar
1 Department of Political Science and Public Administration, Bilkent University, Ankara, Turkey 2 Department of Political Science and Public Administration, Middle East Technical University,
Ankara, Turkey
standard demographic control. Thus, cumulative evidence regarding the role of education is very limited and there is a lot to be done in that field (Mayne and Hakhverdian 2016, p. 1 and 24).
The findings of the extant literature on the effects of education on political trust go in different directions and are inconclusive (Hakhverdian and Mayne 2012, p. 739). There are diverging views on this issue. The first body of literature claims that the more people are educated, the more they will trust the political system. The underlying logic is that the more educated are more likely to benefit from political processes, for example presumably having better jobs and better life chances. They are also thought to better comprehend and appreciate the complexities of the democratic processes (Almond and Verba 1963; Stokes
1962, See Dalton 2005, p. 139). Educated citizens are believed to better understand and take part in politics and therefore develop more political trust (For a discussion of relevant literature see Bauer and Fatke 2014, p. 56). In this view, the educated mostly influence politics making use of the sophistication acquired through education while the less cated are alienated from politics lacking means similar to the ones acquired by the edu-cated (Turper and Aarts 2017). This approach emphasizes the instrumental role education plays as education is believed to provide access to more privileged positions (Hooghe et al.
2015, p. 124).
An alternative view is that more education will lead to more critical citizens. It is argued that better-educated citizens are dissatisfied with the current state of politics (Dalton 2004). The reasoning behind this argument is that the better educated question political elites and traditional processes of representative democracy (Dalton 2005, p. 140). Overall, education as an explanatory variable has received scant attention and cumulative findings are sparse in individual level studies of political trust (Mayne and Hakhverdian 2016, p. 176).
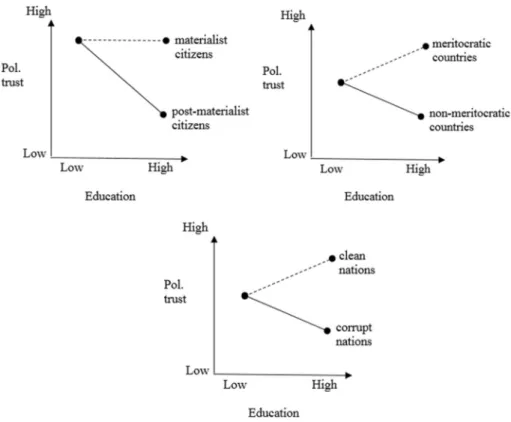
The inconclusiveness of the body of research can be seen as a result of the samples selected (Mayne and Hakhverdian 2016). Depending on the sample (democratic–undemo-cratic, developed–underdeveloped etc.), studies do or do not find a strong significant cor-relation between education and political trust and the direction is either positive or negative (Mayne and Hakhverdian 2016). As this study will show, the direction of the relationship between education and political trust is not uniform across cases but depends on context-specific factors as some studies have also pointed out earlier. For instance, Inglehart (2003, pp. 245–6) argues that while education affects respect for authority negatively in advanced industrial societies, it affects respect for authority positively in low-income societies. The reason for this difference is attributed by the author to the fact that post-material values are more activated in industrial societies compared to low-income societies. Inglehart believes that education serves as a proxy for economic security as those people who would obtain more education are more likely to come from a family that could provide them economic security, thus enabling them to be focused more on post-material values. As those hold-ing post-material values are more likely to approach authority more critically accordhold-ing to Inglehart, citizens of advanced industrial countries who are more educated are also more likely to be critical toward authority. We will further delve into the interaction between education and post-material values below. Hakhverdian and Mayne (2012), on the other hand, show that trust and education are positively correlated in clean countries and neg-atively correlated in corrupt countries. The relationship between education and political trust should thus be approached context based and not in a uniform manner (see also Van Elsas 2015, p. 1158).
The few existing studies on education as an explanatory variable give us important clues about the role of education in determining political trust. Among the most notable are Hakhverdian and Mayne’s studies (Hakhverdian and Mayne 2012; Mayne and Hakhverdian
2016), which establish that “education has both a conditional and a conditioning effect on institutional trust” (Hakhverdian and Mayne 2012). They find that education has context-dependent effects on institutional trust such that the relationship is positive in clean socie-ties and negative in corrupt ones. The reason, they find, is twofold: more educated citizens are better able to identify whether there is corruption or not and they are more easily trou-bled by the existence of corruption. This finding is important as it is one among the few studies that looks at the effects of education on trust. Yet, we want to go beyond the find-ings of that study in some regards. First of all, we want to see what competing mechanisms there are that operate in tandem with the existence or lack of corruption. Specifically, we want to understand how not just the level of corruption but also the level of meritocracy in a country or a person’s post-materialist values have an influence over political trust. In some cases, a very meritocratic yet corrupt country may still garner the support of its edu-cated citizens as they can see that their chances for upward mobility and economic prosper-ity are higher in the system due to their diplomas. In this article, we introduce other aspects to the research by asking not only whether and under what conditions citizens can become more critical of their institutions but also whether they can be so invested in the system due to their education that this investedness may override their propensity of being critical of their political institutions. Alternatively, we also test how post-materialist values relate to educational attainment to influence people’s orientations toward political institutions.
In their study, Mayne and Hakhverdian look at 21 European democracies. Another recent study delving into the relationship between education and institutional trust argues that rational evaluation of trust is same across different levels of education (Van Elsas
2015). This study is based on a single country, the Netherlands, and thus is not able to tap into the effect of variation across cases in terms of issues such as corruption, meritocracy and levels of democracy as they are relatively constant for the case at hand. Our multi-level, cross-country study thus aims at contributing to this body of literature with a larger and more diverse sample of cases. Our sample extends the scope by including democratic countries regardless of their region, economic development, etc. In doing so, we allow for further variation in institutional operations of countries, thereby hoping to even bet-ter capture institutional constraints that countries put on the inbet-teraction between trust and education. Mayne and Hakhverdian themselves have maintained that in order to further understand the context-specific relationship between education and political trust, research-ers should utilize “data from a much broader sample of countries than the small number of high-income consolidated democracies that currently dominates research in this area” (Mayne and Hakhverdian 2016, p. 191). Instead of using a split sample and taking democ-racy as constant, we include the level of electoral democdemoc-racy as a control variable to see how the interaction between education and political trust changes as the level of democ-racy in a country changes. We aim to understand how citizens with the same level of edu-cational attainment will react to polities with divergent levels of democratic quality. This will move education beyond a standard demographic control variable and help us under-stand its conditional effects under different political contexts. Differentiating countries with regard to their democratic quality and its interactive effects with education will also help us contribute to the existing literature, which lumps countries into predetermined, select groups (Western democracies, industrialized countries, new democracies etc.) (Anderson
1998; Mishler and Rose 2001; Zmerli and Newton 2008; Marien 2011; Hakhverdian and Mayne 2012; Hooghe and Marien 2013). These studies are illuminating to understand the determinants of political trust in those selected group of countries yet they fail to capture the contextual and conditional effects of education with other important political variables on political trust throughout the world. Putting countries in a continuum with regard to
their quality of meritocratic government or the level of political corruption while also con-trolling for the effect of the quality of democracy will help us better explain under what circumstances education brings about positive or negative impact on political trust. In the following section, we offer multiple mechanisms through which education interacts with political trust.
2 Theoretical Framework
In this article, we argue that education’s effect on political trust can be moderated differ-ently by some micro- and macro-level variables. The interactive treatment of education as an explanatory variable will better shed light on effects of education on political trust and hence help resolve the contradictions about the relationship between education and politi-cal trust in the existing literature. Before doing so, we first need to clarify what is under-stood by political trust and identify its subcomponents. At a higher level, “trust” is a sum-mary judgment “that the system is responsive and will do that is right even in the absence of constant scrutiny” (Miller and Listhaug 1990, p. 358). Specifically, political trust can be defined as the expectation that political institutions operate in line with the rule of law without continuous inspection (Marien 2011, p. 17). According to Miller and Listhaug (1990, p. 358), political trust reflects “evaluations of whether or not political authorities and institutions are performing in accordance with the normative expectations held by the public, which include that it be fair, equitable, honest, efficient, and responsive to society’s needs.” To this end, political trust integrates the concepts of impartiality, certainty, trans-parency, satisfaction with service delivery, political efficacy and participation (see also, Levi and Stoker 2000; McLaren 2012; Bouckaert and Van de Walle 2013).
As Norris (2003) indicates, objects of political trust can be abstract conceptualizations of political trust as well as specific political institutions. In this article, we focus on three major branches of national state institutions, i.e. the legislative, the executive, and the judi-ciary branches and investigate determinants of public trust vested in these key political institutions. Trust and confidence in major branches of state institutions are consequential for citizens’ compliance with laws, greater policy innovation and positive risk taking, and heightened levels of legitimacy (Levi and Stoker 2000; Kelleher and Wolak 2007; McLaren
2012: Zmerli 2012; Bouckaert and Van de Walle 2013). These institutions and citizens’ rapport with these political institutions lie at the very heart of contemporary democra-cies. Hence, we focus on these three specific institutions to better understand the people’s relationship with core political institutions. Other scholars integrate additional supporting political institutions, such as the civil service, the police, local government into their analy-ses of political trust (see for instance, Mishler and Rose 2001; Anderson and Singer 2008; Hendriks 2009; Marien 2011; McLaren 2012; Hakhverdian and Mayne 2012; Hooghe and Marien 2013). While it can be empirically acceptable to build trust indices combining a volume of multiple trust indicators (assuming high correlation between these trust indica-tors), it can be theoretically wiser to stay focused on specific, core political institutions to better understand how citizens relate themselves to major national political institutions. It is hence our strategy to delve into the three major branches of national state institutions. We believe that although empirical results could have been similar if we had added additional trust indicators for other supportive political institutions, limiting ourselves with major political institutions would offer us a more refined analysis of political trust theoretically.
We test the interactive, conditional effects of education on political trust based on three specific and separate mechanisms. First, we argue that education has an interactive effect with post-materialism. The relationship between education and political values and attitudes has been widely discussed in terms of whether there is a socialization and indoctrination mechanism at work or whether education merely serves as a proxy for more secure socio-economic status (Hooghe, Dassonneville and Marien 2015). As men-tioned above, Inglehart sees the rise of post-material values with education through the lens of socio-economic security, attributing higher education to better socio-economic status during the formative years of an individual (Inglehart 1971, 1977, 1990), whereas Duch and Taylor (1993) and Davis (1996) argue that the relationship between education and post-material values can best be explained by the role of educational institutions in shaping value dominance in individuals.
Overall, the literature shows that education and post-materialism are linked but they do not always overlap. Duch and Taylor (1993), for instance, claim that it is not post-materialism per se but rather democratic values that are increased through education. Moreover, Inglehart shows that it is only in post-industrial countries in which the more educated internalize more post-material values and that the more educated approach authority critically since it is only in these countries that the educated also experience socio-economic security in their formative years. Inglehart sees this as a ground for arguing that it is not education per se, but the presence of post-materialist values that explains declining deference to hierarchical institutions (Inglehart 2003, p. 245).
Post-materialism is believed to lead to “less deference to authority, more assertive styles of action, and higher expectations for the democratic process (Dalton 2005, see also Inglehart 1990, 1997; Dalton 2004). As they grow up in more socio-economically secure conditions, Inglehart (2003, p. 236) believes that those who hold post-material values are less inclined to idealize authority and are more critical and demanding vis-à-vis political institutions. Hence, to capture what we call the “critical effect” of educa-tion, we should take into account the conditional effect of education with post-material-ism on political trust.
We hypothesize that,
H1 Holding the educational attainment level constant, citizens with post-materialist values (in contrast to materialist values) should have lower levels of political trust as the former have a more critical stance toward political institutions.
The second specific conditional effect of education is what we call the “enabling/ diploma effect” of education. Some scholars contend that educated citizens, thanks to their more developed skills, would take part in political processes more predominantly, benefit from these political interactions, and hence would have more vested interests and more trust in political institutions (Milbrath 1966; Richardson et al. 2001; Scheidegger and Stae-rkle 2011; Bauer and Fatke 2014). However, the underlying logic behind these mechanisms is that political institutions are meritocratic and would recruit the most appropriate citizens with the highest possible skills. Without such meritocratic institutional structure, educa-tion’s “enabling effect” would wither away. Thus, we argue that educated citizens will have positive orientations toward political institutions if only they believe that these institutions are meritocratic and recruit them (or similar citizens with high skills) into political pro-cesses. In other words, we maintain that education’s effect on political trust can be moder-ated by a country’s level of meritocracy. Hence, we hypothesize that,
H2 Holding educational attainment level constant, citizens living in more meritocratic countries should be more inclined to trust political institutions.
The third and the last interactive, conditional effect of education is what we call the “evaluative effect” of education. Citizens evaluate their countries’ level of corruption, assess whether political institutions and actors aspire for the overall public good or line their own pockets (or their cronies) in corrupt, nepotistic and clientelistic networks, and thus develop trust judgments accordingly (Mishler and Rose 2001; Seligson 2002; Ander-son and Tverdova 2003; Chang and Chu 2006; Hakhverdian and Mayne 2012). Hakhverd-ian and Mayne (2012) suggest that education has a conditional (as well as a conditioning) effect on political trust in linkage to corruption. To have theoretical and empirical consist-ency, we focus on the conditional effect of education on political trust in linkage to corrup-tion. In other words, we test how education’s impact on political trust can be moderated by the existence or lack of political corruption at the macro-level. We hypothesize that,
H3 Holding educational attainment level constant, citizens living in less corrupt nations should be more trusting in political institutions.
Figure 1 summarizes our conceptual model, in which we offer three alternative path-ways through which education’s effect on political trust can be moderated by micro- and macro-level factors. On the one hand, we argue that whether a person hold materialistic or Fig. 1 Contextual, moderated effects of education on political trust
post-materialistic attitudes towards the political system and its institutions can alter how educational attainment affects political trust. We maintain that it is only those educated citizens with post-materialist values who will hold critical stance toward political institu-tions. On the other hand, we also believe that contextual, macro-level factors may moderate education’s effect on political trust. We contend that education’s impact on political trust is conditional upon the existence or lack of meritocracy and/or political corruption at the country level, in which educated citizens in more meritocratic or cleaner societies will have higher levels of trust toward political institutions. In the following section, we provide the details of our methodology.
3 Methodology
To test the conditional, interactive effects of education on political trust, we mainly uti-lize the Wave 6 of the World Values Survey (2010–2014) for individual-level variables. To ensure maximum coverage of democratic countries, we include data from all countries in the WVS which either have a Polity IV score of 5 or higher (“full democracies” and “democracies” according to the Polity IV) or have a Freedom House status of “free” or “partly free” (in their respective survey year) (Polity IV Project 2019; Freedom House
2019).1 The total number of democratic countries in our analysis is 40 (see “Appendix 1”
for survey years and the number of participants). The selection of our sample ensures a diverse body of democratic nations throughout the world, which transcends regional foci of many scholarly works on political trust. Additionally, we make use of multiple interna-tional databases for our country-level variables such as meritocracy, political corruption (for all of our variables’ descriptions and data sources as well as descriptive statistics, see “Appendices 2 and 3”). All in all, we ensure maximum coverage of democratic countries throughout the world based on the WVS results and supporting databases.2
3.1 The Dependent Variable
Our trust variable, which is the dependent variable of this study, is composed of trust indi-cators on three main branches of the state. Namely, it covers trust indiindi-cators on the leg-islative (parliament), the executive (government), and the judiciary (justice system). The
1 38 countries satisfy both criteria of Polity IV and Freedom House status (Polity IV Project 2019; Free-dom House 2019). The only two countries that have a contradictory status in our Polity IV and Freedom House classification are Nigeria and Singapore, which have “partly free” status in the Freedom House Index whereas they have a Polity score lower than 5 (Nigeria has a Polity score of 4 for their survey year 2011 and Singapore -2 for their survey year 2012). Including or excluding these two countries does not change our substantive findings. Hence, to ensure maximum coverage, we have decided to include these two countries (results without these countries are also available upon request).
2 In our analysis, we exclude authoritarian countries due to their high level of “preference falsification” (Rose 2007; Darden and Grzymala-Busse 2006). Preference falsification refers to the situation in which people deliberately misrepresent their genuine views under perceived social and political pressures (Kuran
1997; Wedeen 1999). Jiang and Yang (2016) show, for instance, that ordinary citizens in authoritarian states are indeed very hesitant to reveal their opinions, especially when discussing important political issues. In a study such as this one, in which public opinion data on governmental and state trust is investigated, there is a high likelihood that people in authoritarian regimes will deliberately conceal their views and make the results spurious. Thus, we refrain from including authoritarian regimes.
corresponding survey question of WVS is framed as follows: “I am going to name a num-ber of organizations. For each one, could you tell me how much confidence you have in them: is it a great deal of confidence, quite a lot of confidence, not very much confidence or none at all?” We consider “Justice System/Courts” (V114), “The Government” (V115) and “Parliament” (V117). We quantify reported confidence levels in an ordered manner such that 1 represents the lowest and 4 corresponds to the highest level of confidence for each institution. Given that three trust measures are ordered and categorical, we run polychoric principal factor analysis (PPFA) on these trust indicators in order to create a robust politi-cal trust variable on state institutions. PPFA analysis indicates a one-factor solution and allows us to construct a continuous index for trust in main state institutions. Factor load-ings for our observed variables (i.e. trust in parliament, government, and the judiciary) are very high, 0.805, 0.821, and 0.694 respectively, indicating a successful creation of a latent variable of political trust. Furthermore, standard Cronbach’s alpha for our latent variable is 0.796, which is well above the conventional boundaries for scale construction. For robust-ness check, we conduct separate PPFA for each country, we find one-factor solution for each country with similarly very high levels of factor loadings. These findings imply that structure of the data is similar across countries. Empirical results of PPFA are provided in “Appendix 4”.
To ensure comparability with the WVS trust measures, we rescale our continuous trust variable such that it ranges between 1 and 4 (4 indicating the highest level of trust). The aggregate-level range of our trust variable runs from 2.98 in Singapore to 1.77 in Peru. The most trusting countries in our sample are Philippines, India, Sweden, Malaysia, and Singapore. The least trusting countries on the other hand are Ukraine, Romania, Tunisia, Slovenia, and Peru. There are noticeable differences within geographic regions, which fur-ther ensures diversity within and across regions.
3.2 Independent Variables
Our major explanatory variable is the level of education. To get the best sense of the origi-nal WVS categorization, we have recoded the WVS categorization into four categories.3
The lowest category refers to those who have no formal diploma at all (10.67% of the entire sample). The second category has those respondents with primary school diplomas (27.72% of the sample). The third category contains those with secondary school diplomas (44.18%). Finally, the highest category consists of those with university-level degrees and higher (17.43%).
To explore the multiple interactive and conditional effects of education on political trust, we take into account three interactive competing mechanisms through which edu-cation has a potential impact on political trust and use them as our supporting explana-tory variables. First, we include the effect of post-materialism into our analysis and check whether educated citizens with post-materialist values will have different trust judgments
3 There are some overlaps with regard to people’s educational attainment and record (when we use degree completion as our main criterion) in the WVS’s original 9-category education (such as category-4 referring to “Incomplete secondary school: technical/vocational type” and category-6 referring to “Incomplete sec-ondary school: university-preparatory type”). We have focused on the completion of each degree (primary, secondary, and tertiary), treated incompletion of degrees with the completion of one lower degree (e.g.: hence treating categories 4 and 6 like that with primary school diplomas) and recoded the education vari-able accordingly so as to get the best possible inferences.
(due to their critical stance toward political institutions) than those with similar levels of education yet with materialist values. We use the WVS question about post-materialism to check this effect.
Second, we investigate the enabling effect of education under the existence of merito-cratic political institutions (or the lack thereof). We contend that highly educated citizens will have higher trust judgments should they believe that their states are meritocratic and that they (or similar citizens with high caliber) will have higher chances of partaking in political institutions (hence the name “enabling effect”). We make use of the V-Dem data-set’s meritocracy variable (v2stcritrecadm), which measures to what extent appointment decisions in the state administration are based on skills and merit, as opposed to personal and political connections (V-Dem Dataset 2017).4
Third, we explore the evaluative effect of education, in which education has a condi-tional conditioning effect on political trust in relation to political corruption. We maintain that educated citizens living in more clean societies will have higher trust judgments about state institutions, as opposed to those residing in corrupt nations. We utilize the V-Dem’s political corruption variable (v2x_corr), which measures the pervasiveness of political cor-ruption in three main branches of the state (which is also in line with our trust variable).5
For the sake of reliability, we check whether our meritocracy and political corruption variables are associated. Their pairwise correlation is − 0.69. However, there are coun-tries with comparatively less meritocratic states yet with low levels of corruption (such as Cyprus) and countries with meritocratic governance with comparatively higher levels of corruption (such as Taiwan). This also confirms that differentiating the enabling and evaluative effects of education on political trust is an appropriate step to better understand the contextual, interactive effects of education. Moreover, we run a multicollinearity test with our full model (with all of our independent variables, only without the interaction terms) and find that there is not a problem of multicollinearity. The variance inflation fac-tors (VIFs) of independent variables range between 1.03 and 8.91 with a mean VIF of 2.33 (3.04 and 8.91 for our meritocracy and political corruption variables). The VIFs do not exceed conventional boundary of 10, indicating that our models are not prone to multicol-linearity. “Appendix 5” presents VIFs and tolerance measures for our variables of interest.
Another issue that we should check is endogeneity. Although both of our political cor-ruption and meritocracy variables are from the V-Dem dataset (i.e. based on expert evalu-ations), it is possible that these variables are endogenous to citizens’ attitudes toward political institutions. When we run endogeneity tests (Hausman tests) in light of similarly scholarly works (cf. Anderson and Tverdova 2003; Hakhverdian and Mayne 2012) for our 4 While the meritocracy variable perfectly captures our theoretical linkage of the enabling effect of educa-tion, the V-Dem dataset offers data on this variable for a more limited number of countries (for instance, 17 countries for our sample). There is not any systematic error in the V-Dem dataset to disregard countries regionally and/or socioeconomically. However, for a robustness check and for the sake of higher reliability, we also used an alternative variable in the same dataset, i.e. equal access index “v2xeg_eqaccess”, which measures how equal access to power is and captures the de facto capabilities of citizens to participate, to serve in positions of political power, to put issues on the agenda, and to influence policymaking. Our sub-stantive results do not change (results are available upon request). Hence, we stick to our meritocracy vari-able for the sake of validity since this varivari-able better captures our theoretical claim.
5 Leading studies in the field such as Hakhverdian and Mayne (2012) utilize Transparency International’s Corruption Perception Index (CPI) to measure the extent of corruption. We believe that V-Dem’s political corruption variable better captures the extent of corruption in the major state institutions as it directly meas-ures corruption in the legislative, executive, and judicial branches and goes beyond the perceptive aspects of the CPI. Hence, we believe that it is a more valid measure for our purposes.
corruption and meritocracy variables, we find signs of endogeneity for both (less so for the meritocracy variable). Hence, we should underline once again that our findings are correla-tive in nature and that we do not claim any causality in our statistical results. As we focus on multiple correlative pathways through which education may alter levels of political trust in the world, delving into the causal relationships between political corruption, meritocracy and political trust is out of the scope of this research.
Lastly, for the sake of comparability, we standardize our post-materialism, meritocracy and political corruption measures such that they all range between 0 and 1. This will help us juxtapose the substantive effects of each interactive mechanism.
3.3 Control Variables
Previous studies indicate a collection of individual-level factors besides level of educa-tion that predict political trust (Dalton 2005; Freitag and Bühlmann 2009; McLaren 2012; Hakhverdian and Mayne 2012; Zmerli 2012; Bauer and Fatke 2014; Van der Meer and Hakhverdian 2016). These include demographic and socioeconomic variables such as gen-der, age, and religiosity. It is open to debate whether age is a determining factor due to its life cycle or generational effect. For example, while Richardson et al. (2001) argue that older people are more likely to trust due to having more experience with political authori-ties (Bauer and Fatke 2014), Inglehart (1977, 1990, 2003) argues that the effect of age is a generational matter with those raised under more socio-economically secure decades being more likely to be more post-materialist and therefore trust less in government institutions. Nevertheless, there is a consensus over the issue that age needs to be controlled for in the examination of trust.
Moreover, we control for attitudinal and behavioral factors that are found to be posi-tively associated with political trust, including interpersonal trust (Dalton 2004; Zmerli and Newton 2008; Hakhverdian and Mayne 2012; Zmerli 2012) and political factors such as ideological disposition along the left–right political spectrum and the incumbency effect (Miller and Listhaug 1999; Anderson and Tverdova 2003; Norris 2003; Zmerli 2012; Van der Meer and Hakhverdian 2016).
At the country-level, control variables include level of economic development as cap-tured by log GDP per capita, unemployment rate, and Gallagher index for disproportional-ity (cf. Lijphart 1999; Mishler and Rose 2001; Norris 2003; Dalton 2004; Freitag and Büh-lmann 2009; Hakhverdian and Mayne 2012; McLaren 2012; Zmerli 2012; Van der Meer and Hakhverdian 2016; Tormos 2019). To further capture the effects of changes in the quality of democratic governance, we also utilize the polyarchy variable from the V-Dem dataset. This variable measures the achievement of ideal electoral democracy conditions in the corresponding country. It ranges from 0 to 1, in which higher values indicate more democratic conditions. We intentionally use a minimalistic index of democracy to prevent any multicollinearity with our other explanatory and control variables. Using a democ-racy score will help us explain the changes in political trust with regard to changes in the educational attainment in tandem with changing democratic conditions. This will show us whether citizens with the same level of education will have higher or lower trust in more democratic nations. Controlling for the level of democratic quality is also aimed to be a contribution to the literature, which usually studies countries as either single-case anal-ysis or in regional analanal-ysis with no treatment of changing democratic conditions among countries.
3.4 Data Analysis
We contend that education has conditional, interactive effects with micro- as well as macro-level variables, which cumulatively affect people’s attitudes and trust orientations toward political institutions. The existence of potentially influential control variables both at the individual and country levels also calls for a multilevel framework. Individuals nested within national contexts can be influenced by these country-level correlates (Sni-jders and Bosker 1999; Steenbergen and Jones 2002). Multilevel treatment and analysis of political trust is gaining attention and popularity in recent years (Zmerli 2012; Hakhverd-ian and Mayne 2012). Variance components analysis for the empty model shows that while individual-level factors account for the most of the variance in political trust (85.02% to be exact), country-level factors still account for an important portion, which should not be neglected (14.98% based on intra-class correlations). The LR test result (with a Chi square of 8936.46) for the multilevel model also shows that the data at hand is nested in nature and ignoring contextual variance at the country level would lead us to miss out important explanations for political trust. Hence, our two-level, multi-level framework includes both micro- and macro-level variables to better understand the correlates of political trust.
In our general multilevel models, individual-level factors compose the level-1 model, while measures at the country level are included in the level-2 model. We also have inter-action terms for the education variable and our moderating variables (post-materialism, meritocracy and political corruption) so as to capture the conditional effects of education on political trust.6 In addition to models with all of the moderating variables (in their level
terms), we also run separate models with each of the interaction terms in separate models so as to best delineate the particular effects of each of our moderating variables on educa-tion (and on political trust). Since we use standardized variables for post-materialism, mer-itocracy, and political corruption, we would also be able to compare the substantive effects of critical, enabling, and evaluative components of education on political trust.
Below, we illustrate the equation for the general model of political trust for individual i in country j. Each αkj term represents the impact of a particular variable on a person’s trust vested in political institutions such that,
The intercept of this equation, α0j, illustrates the average political trust in country j and is modeled as a function of country-level factors in the level-2 equation. Each β term rep-resents the effect of a particular country level variable on a person’s level of political trust, and β00 is the average intercept across countries. Hence,
Political trustij=𝛼0j+𝛼1jEducationij+𝛼2jGenderij+𝛼3jAgeij+𝛼4jAge - squaredij
+𝛼5jReligiosityij+𝛼6jInterpersonal trustij+𝛼7jIdeological self - placementij +𝛼8jSupport incumbentij+𝛼9jPost - Materialism indexij
+𝛼10jEducationij*Post - Materialism indexij+𝛼11jEducationij*Meritocracyj +𝛼12jEducationij*Political corruptionj+ eij.
6 Since the education variable is an individual-level variable and our meritocracy and corruption variables are at the country-level, their separate interactions yield another individual-level variable (for each indi-vidual i in country j). Hence, these interaction terms are also added to the level-1 equation.
4 Empirical Findings
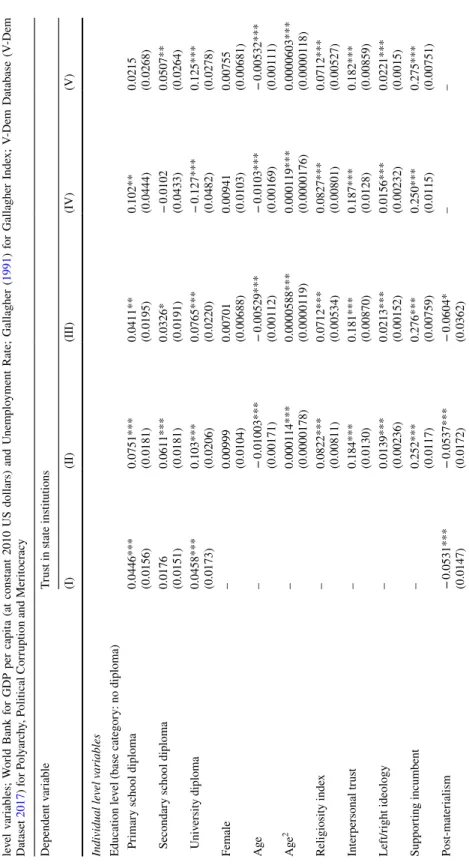
We begin our empirical analyses with exploring education’s base effect with no interac-tions at all. This would be similar to treating education as a demographic control variable used in some scholarly research on political trust. According to the Model I in Table 1, education has a positive and significant relationship with political trust. To be more spe-cific, ceteris paribus, the most educated are more inclined to vest higher levels of trust in political institutions than the least educated (by 0.0458 units to be exact). This is a valuable finding yet it does not tell us about how and through what mechanisms education can (and does) affect people’s orientations toward political institutions. We will look at these mecha-nisms in further tests in our successive models.
Model II illustrates the empirical model with the inclusion of our control variables at the individual and country levels. Keeping the least educated as our reference category, it is clear that higher levels of education are correlated with increased levels of political trust even after controlling for potentially important variables at both levels.
Models III, IV, and V reveal how education interacts with our moderating variables (post-materialism, meritocracy, and political corruption respectively) and how these inter-actions may alter people’s perceptions toward political institutions. Based on Model III, we test our first hypothesis, which indicates the “critical effect” of education. Empirical results show us that given an educational attainment level, every unit increase in post-materialism will lower average political trust by around 0.05 units. Given that our standardized post-materialism index ranges between 0 and 1, this means that when two hypothetical people with the same level of education happen to have post-materialist values versus fully mate-rialist orientations, the former on average would have lower political trust than the latter by 0.05 units. Substantively, given that our trust variable ranges between 1 and 4, such dif-ference between materialist and post-materialist citizens is not that salient. Hence, we find statistical support for our first hypothesis, but less support substantively.
The second conditional effect of education is about its “enabling effect” with meritoc-racy. Based on Model IV in Table 1, we test whether education’s impact on political trust is moderated by meritocracy at the country level (Hypothesis 2). Empirical results show us that given an educational attainment level, people living in countries with more merito-cratic political institutions would on average have higher levels of political trust than those living in less meritocratic countries. Statistical tests further reveal that it is the secondary school graduates and especially the university-degree holders, who show strong and sta-tistically significant interaction effects between education and meritocracy. For university graduates (as compared to people with no diploma), meritocracy’s interaction with educa-tion tend to increase people’s political trust by 1.429 units (0.687 + 0.742 units). This is both a statistically and substantively important finding, which underlines the conditional effect of education with meritocracy. This means that citizens (especially those with higher educational attainment) living in more meritocratic states (such as Australia, Spain, Uru-guay) would on average have more faith in political institutions than in less meritocratic states (such as Armenia, Peru, Romania) since they believe that educational attainment will
𝛼0j= 𝛽00+𝛽01Economic developmentj+𝛽02Unemploymentj + 𝛽03Gallagher index of disproportionalityj+𝛽04Polyarchyj + 𝛽
Table
1
Multi-le
vel models of political tr
us
t, education, pos
t-mater
ialism, mer
itocr
acy and cor
rup tion. Sour ces : W or ld V alues Sur ve y (w av e 6, 2010–2014) f or all individual lev el v ar iables; W or ld Bank f or GDP per capit a (at cons
tant 2010 US dollars) and U
nem plo yment R ate; Gallagher ( 1991 ) f or Gallagher Inde x; V -Dem Dat abase (V -Dem Dat ase t 2017 ) f or P ol yar ch y, P olitical Cor rup
tion and Mer
itocr acy Dependent v ar iable Tr us t in s tate ins titutions (I) (II) (III) (IV) (V) Individual lev el v ar iables Education le
vel (base categor
y: no diploma) Pr imar y sc hool diploma 0.0446*** (0.0156) 0.0751*** (0.0181) 0.0411** (0.0195) 0.102** (0.0444) 0.0215 (0.0268) Secondar y sc hool diploma 0.0176 (0.0151) 0.0611*** (0.0181) 0.0326* (0.0191) − 0.0102 (0.0433) 0.0507** (0.0264) U niv ersity diploma 0.0458*** (0.0173) 0.103*** (0.0206) 0.0765*** (0.0220) − 0.127*** (0.0482) 0.125*** (0.0278) Female – 0.00999 (0.0104) 0.00701 (0.00688) 0.00941 (0.0103) 0.00755 (0.00681) Age – − 0.01003*** (0.00171) − 0.00529*** (0.00112) − 0.0103*** (0.00169) − 0.00532*** (0.00111) Age 2 – 0.000114*** (0.0000178) 0.0000588*** (0.0000119) 0.000119*** (0.0000176) 0.0000603*** (0.0000118) Religiosity inde x – 0.0822*** (0.00811) 0.0712*** (0.00534) 0.0827*** (0.00801) 0.0712*** (0.00527) Inter personal tr us t – 0.184*** (0.0130) 0.181*** (0.00870) 0.187*** (0.0128) 0.182*** (0.00859) Lef t/r ight ideology – 0.0139*** (0.00236) 0.0213*** (0.00152) 0.0156*** (0.00232) 0.0221*** (0.0015) Suppor ting incumbent – 0.252*** (0.0117) 0.276*** (0.00759) 0.250*** (0.0115) 0.275*** (0.00751) Pos t-mater ialism − 0.0531*** (0.0147) − 0.0537*** (0.0172) − 0.0604* (0.0362) – –
Table 1 (continued) Dependent v ar iable Tr us t in s tate ins titutions (I) (II) (III) (IV) (V) Pr imar y sc hool*pos t-mater ialism – – 0.00807 (0.0423) – – Secondar y sc hool*pos t-mater ialism – – 0.0299 (0.0403) – – Univ ersity*pos t-mater ialism – – 0.0183 (0.0442) – – Pr imar y sc hool*mer itocr acy – – – − 0.1003 (0.129) – Secondar y sc hool*mer itocr acy – – – 0.230* (0.127) – Univ ersity*mer itocr acy – – – 0.687*** (0.135) – Pr imar y sc hool*political cor rup tion – – – – 0.0556 (0.0494) Secondar y sc hool*political cor rup tion – – – – − 0.0143 (0.0482) Univ ersity*political cor rup tion – – – – − 0.135*** (0.0535) Countr y lev el v ar iables Economic de
velopment (ln GDP per capit
a) – − 0.0911 (0.0581) 0.0646 (0.0481) 0.152*** (0.0542) − 0.00194 (0.0511) Gallagher inde x – − 0.00973 (0.01099) − 0.0108 (0.0111) − 0.0297* (0.0168) − 0.00998 (0.00684) Unem plo yment – − 0.0214*** (0.00479) − 0.0118 (0.00812) − 0.0238*** (0.00743) − 0.0218** (0.0108) Po ly ar ch y – − 2.0904*** (0.262) − 0.476 (0.341) − 1.273*** (0.334) − 1.239*** (0.423)
Table 1 (continued) Dependent v ar iable Tr us t in s tate ins titutions (I) (II) (III) (IV) (V) Mer itocr acy 0.540 (0.380) 0.0913 (0.352) – 0.742 (0.517) – Political cor rup tion − 0.311 (0.320) − 1.865*** (0.363) – – − 0.854*** (0.293) Cons tant 2.345*** 5.269*** 1.846*** 1.638*** 3.530*** Number of obser vations 25,833 17,955 41,710 18,507 42,630 Number of countr ies 20 17 36 17 36 LR tes t (v s. linear model) 4580.32*** 728.16*** 4278.98*** 1992.04*** 3493.13*** W ald χ 2 27.54*** 1079.22*** 2445.46*** 1113.51*** 2557.33*** St andar d er rors in par ent
heses. All model es
timations ar e conducted in S tat a 14. See “ Appendix 2 ” f or dat a sour ces. Due t o missing obser vations in cer tain v ar iables, some countr ies ar e no
t included in some model es
timations. W
e ha
ve also es
timated models wit
h time contr ols f or t he sur ve y y ear . The es timation r esults ar e v er
y similar and coef
-ficients of time contr
ols ar e no t significant *** p < 0.01, ** p < 0.05, *p < 0.10
empower them and thus enable them to take part in political processes. Based on our find-ings, meritocracy has a strong moderating effect on education, which influences people’s orientations toward political institutions. In short, we strongly confirm Hypothesis 2.
The third and final conditional effect of education is about its “evaluative effect” with political corruption. Based on Model V in Table 1, we test whether education’s effect on political trust is moderated by political corruption at the macro level. Empirical results indicate that given an educational attainment level, citizens living in less corrupt societies would on average have higher levels of political trust than those living in more corrupt societies (recall that our political corruption variable ranges between 0 and 1, 1 indicating the highest level of corruption). Specifically, empirical tests show us that it is especially the university graduates (as compared to the reference category) who would statistically and substantively higher levels of political trust in less corrupt nations (0.989 units to be exact; i.e. 0.854 + 0.135 units). This means that on average, educated citizens (as compared to the least educated) living in more clean states (such as Sweden, New Zealand, Germany, and Netherlands) would react more positively to the absence of corruption and tend to vest more trust in political institutions. Conversely, more educated citizens residing in coun-tries with comparatively high levels of political corruption (such as Nigeria, Ukraine, Kyr-gyzstan, and Pakistan) would be more inclined to be distrustful to political institutions than the less educated. Just in the case of meritocracy’s moderating effect on education (and on political trust), it is again striking to see that the “evaluative effect” of education in linkage to political corruption is stronger in more educated citizens. It is especially the most edu-cated citizens, who are influenced by the context-specific, moderating effects of corruption in the education–political trust nexus.
5 Discussion of Empirical Findings
Before we further delve into the multiple interactive pathways through which education affects political trust, it would be appropriate to discuss the substantive findings of our research based on other independent variables. Our empirical models show that some of our control variables have consistently strong impact on political trust. Accordingly, age has a U-shaped quadratic relationship with political trust, in which mid-aged citizens have lower trust in political institutions than the youngsters and the elderly. Furthermore, reli-giously devout citizens, those who have higher interpersonal trust, people on the right hand of the ideological spectrum, voters who support the incumbent political parties are expected to have a higher tendency to have more faith in political institutions. At the coun-try level, unemployment lowers political trust. Moreover, disproportional political institu-tions tend to decrease political trust (while this effect is consistently negative, it is only significant in Model IV).
When used as a control variable, polyarchy variable diminishes trust in political institu-tions. This shows that, ceteris paribus, citizens in more democratic nations are less trusting of political institutions. In Model II, every increase in our polyarchy variable will decrease average political trust by 2.09 units. Given our polyarchy variable ranges between 0 and 1 (1 referring to the most democratic state), this means that people on average would approx-imately have 2 units less trust in political institutions in a perfectly democratic country than in a perfectly authoritarian country. To give a more illustrative example, a citizen with the same level of education would on average have 1 unit less political trust in a more
democratic country with a polyarchy score of 0.90 (Germany, Australia) than in a less democratic country with a polyarchy score of 0.40 (Singapore, Thailand).
Turning back to the conditional effects of education on political trust, we have found that it has indeed critical, enabling, and evaluative aspects that are linked to its moderation by post-materialist values, meritocratic government, and political corruption. Education’s interaction with post-materialism reveals that holding educational attainment constant, it is those citizens with more post-materialist values who have diminished levels of trust toward political institutions.
A comparison of substantive findings based on the standardized scores of post-materi-alism, meritocracy, and political corruption tell us that the enabling and evaluative effects of education are much stronger than the critical effect of education (though the latter has still some statistical significance). In other words, education’s interaction with meritocracy and political corruption is found out to be much more salient than its moderation by post-materialist values. Specifically, we find that the conditional effects of education with meri-tocracy and political corruption are particularly important and have huge impact on peo-ple’s trust judgments about state institutions. Given any educational attainment level, when education’s interactive effects are activated with the knowledge of a meritocratic state or of a corrupt one, this would have major substantive effects on citizens’ faith in political institutions.
6 Conclusion
This study has delved into the issue of how education affects political trust. In doing so, it has been guided by the main arguments raised in the relevant literature. One of the main questions was whether education increases political trust among citizens by enabling them with new capacities and making them feel more invested in the system or whether, to the contrary, education leads to more critical citizens, thus diminishing the level of trust. In light of our findings, the answer to this question is, to quote Tilly and Goodin (2006): “It depends.” It depends on the level of corruption in a country as well as on how merito-cratic the country is. Post-material values are also important in order to activate the critical effects of education given both meritocracy and corruption are held constant in the coun-tries under investigation. The study shows however that meritocracy and corruption as ele-ments of the macro-level political system supersede the effect of post-materialism as an individual trait.
Our findings support Hakhverdian and Mayne’s (2012) observations on the effects of corruption on the link between education and political trust. Yet, our study also illuminates some points that were left untouched in that study. For instance, based on Hakhverdian and Mayne (2012), one could speculate that the real difference between the split samples might have been another variable that would be doing the real work there. Such variables would include the level of democracy or the level of meritocracy or post-materialism within the subsamples. Yet, our study has shown that the level of electoral democracy does not bolster the political trust of educated people. On the contrary, democracy has a negative impact on the link between education and political trust. Also rather than splitting the sample from a threshold and using perception of corruption as a variable, we have chosen continuous variables and less subjective measures of corruption. Hence, our findings have shown that the negative impact of education on political trust in the presence of corruption holds even when more rigorous measures are made and the sample is extended.
It should be noted that this study has its own limitations, which may be addressed by further research. The empirical analysis of the current study only analyzes correlations for variables of interest. Further studies should focus on providing empirical evidence for causal pathways between education, post-materialist values, meritocracy, political corrup-tion and political trust. Specifically, relacorrup-tionships between meritocratic government, cor-ruption and political trust and how this relationship varies with different levels of education can be further explored in future research based on methods such as experiments, focus groups and in-depth interviews. Moreover, this study utilizes cross-sectional surveys and it does not account for panel dimensions of political trust and explanatory variables. Empiri-cal analysis of the above mentioned relationships by panel data frameworks can be further conducted by future research.
Another point worth mentioning is the nature of our sample. While the diversity of our sample ensures rich and fruitful research outcomes on the correlates of political trust, it is surely not without any drawbacks. Earlier research suggests that analyses based on value orientations throughout the globe can raise issues of comparability (Aleman and Woods
2016). These include empirical works, like ours, utilizing global datasets such as the WVS. When we probe our dataset in light of this illuminating line of research, we find that our political trust indicators and the resultant latent political trust measure are far from being perfect (we present our findings in “Appendix 6”). Measurement invariance analyses reveal that our whole sample has a root mean square error of approximation (RMSEA) of 0.107. While our factor analyses for individual countries reveal high factor loadings for all of our observed trust variables and a one-factor solution for all countries (see “Appendix 4”) and although some researchers argue that it would be misleading to apply universal cutoff points for measure of goodness-of-fit in structural equation models without the knowledge of the nature and the size of samples (Chen et al. 2008), our RMSEA figure hints that there are certain issues of comparability for our political trust indicators (cf. MacCallum et al. 1996; Chen et al. 2008; Acock 2013; Aleman and Woods 2016). When we categorize our sample based on three criteria (democracy status, economic development level, and cultural groups across the globe-based on Welzel (2013) (see “Appendix 6”), we observe that certain subsamples have comparatively higher degree of comparability and goodness of fit, including partly-free countries (Freedom House democracy status), low-income and lower-middle income countries (World Bank economic development classification), and certain sub-groups of countries based on the Welzel’s 10 cultural groups (Reformed West-ern, New WestWest-ern, and Sub-Saharan African nations have the best fit). While we admit that our diverse sample and our measures in light of this sample are far from being perfect, we believe that utilizing such a global-scale, rich sample and conducting analyses based on this sample outweigh the drawbacks it brings about. As Mayne and Hakhverdian (2016) suggest, while researchers should offer in-depth, country-level research, the research on political trust still begs for more diverse analyses, which transcend the small, well-studied group of fully democratic countries. Our endeavor in this research should be taken in this light as it aims to enrich the existing literature on political trust.
Lastly, future research needs to shed more light on the relationship between democracy and political trust. Our finding that, ceteris paribus, citizens in more democratic countries hold more critical stance toward political institutions can be interpreted in two possible ways. First, as some scholars suggest, more democratic contexts create an increasingly sophisticated citizenry. While thinking that political institutions are essential for well-func-tioning of the state apparatuses, citizens in highly democratic countries also see them as a “necessary evil” and approach them with distrust (Warren 1999; Rosanvallon 2008; Della Porta 2010; Ignazi 2014). These scholars see distrusting citizens not as alarming but a part
and parcel of healthy democracies. Alternatively, this finding may also suggest that citi-zens are more expressive about their ideas under more democratic settings. This means that people in more democratic contexts can more openly express their trust judgments than in less democratic ones (Rose 2007; Darden and Grzymala-Busse 2006). This may also bring about the divergence in trust judgments in linkage with changing democratic quality. All in all, how citizens’ trust judgments toward political institutions are shaped based on differ-ent political and socioeconomic contexts offers an exciting future line of research. There are multiple pathways through which important political, social, and economic indicators can alter the level of political trust in democratic societies. Our research aims to contribute to our understanding about the correlates of political trust, which is a key element for the stability and legitimacy of political institutions.
Appendix 1: List of countries included in the study
Survey year Number of
participants Argentina 2013 1030 Armenia 2011 1100 Australia 2012 1477 Brazil 2014 1486 Chile 2011 1000 Colombia 2012 1512 Cyprus 2011 1000 Ecuador 2013 1202 Estonia 2011 1533 Georgia 2014 1202 Germany 2013 2046 Ghana 2012 1552 India 2012 5659 Japan 2010 2443 Kyrgyzstan 2011 1500 Lebanon 2013 1200 Malaysia 2012 1300 Mexico 2012 2000 Netherlands 2012 1902 New Zealand 2011 841 Nigeria 2011 1759 Pakistan 2012 1200 Peru 2012 1210 Philippines 2012 1200 Poland 2012 966 Romania 2012 1503 Singapore 2012 1972 Slovenia 2011 1069 South Africa 2013 3531
Survey year Number of participants South Korea 2010 1200 Spain 2011 1189 Sweden 2011 1206 Taiwan 2012 1238 Thailand 2013 1200
Trinidad and Tobago 2011 999
Tunisia 2013 1205
Turkey 2011 1605
Ukraine 2011 1500
United States 2011 2232
Uruguay 2011 1000
Sources: World Values Survey, Wave 6 (2010–2014). Countries selection is based on Freedom House “Freedom in the World” reports and Polity IV index (Polity IV Project 2019; Freedom House 2019)
Appendix 2: Variable descriptions for empirical analyses
Trust in state institutions This continuous variable is based on trust measures on judiciary/ courts, government and parliament (WVS survey items V114, V115, and V117 respectively in Wave 6). Polychoric principal factor analysis is employed to create a continuous trust variable, ranging between 1 and 4, 4 representing the highest
Education WVS asks respondents their highest level of education attained. We have created a 4-level, discrete variable. 1 = No diploma; 2 = Primary school diploma; 3 = Secondary school diploma 4 = University-level or higher level diploma
Female Respondent’s gender (V240 in Wave 6). This variable is originally coded 1 for male and 2 for female. It is recoded such that 1 refers to female and 0 refers to male
Age Respondent’s age (V242 in Wave 6)
Religiosity index We have used three variables in WVS to create religiosity variable. Related questions and variables in WVS are “How important is religion in your life?” (V9 in Wave 6), “How often do you attend religious services?” (V145 in Wave 6), and “Independently of whether you attend religious services or not, would you say you are religious person?” (V147 in Wave 6). We rescaled these vari-ables so that higher values represent higher religiosity. We then performed PCA to create religiosity index, scaled between 1 and 4, 4 representing the highest level of religiosity
Interpersonal trust WVS asks respondents whether they think most people can be trusted or whether one needs to be very careful when dealing with people (V24 in Wave 6). Variable is coded as 1 for “most people can be trusted” and 2 for “need to be very careful”. We recoded variable so that 0 represents non-trusting citizens and 1 trusting ones
Left–right ideological self-placement WVS asks respondents where they would place themselves in ideo-logical spectrum, 1 being the most extreme leftist disposition and 10 being the most extreme right-wing disposition (V95 in Wave 6)
Supporting incumbent Based on WVS survey question asking which party respondents would vote for if there were a national election tomorrow (V228 in Wave 6), we have created an incumbency dummy variable. If the respondent’s answer includes the party (or parties) in power, then the dummy gets value of 1, else
Post-materialism index This index is based on the WVS variable Y002 (in Wave 6). It is originally scaled between 1 and 3. We have rescaled this variable to range between 0 and 1. 0 representing a materialist person and 1 representing a post-materialist
Logarithm of GDP Per capita Logarithm of GDP per capita (at constant 2010 US dollars). (World Development Indicators)
Gallagher index Measures relative disproportionality between votes and seats received by political parties. This index ranges from 0 to 100. The larger the index the larger the disproportionality. (Gallagher 1991) Unemployment Rate (%) Unemployment rate at country level (% of total labor force). (World
Development Indicators)
Polyarchy This variable is derived from electoral democracy index of V-Dem. It measures the achievement of ideal electoral democracy condi-tions in the corresponding country. It ranges from 0 to 1. The higher values indicate more democratic conditions. (V-Dem Database)
Political corruption This index ranges from 0 to 1. The higher values indicate higher corruption levels. (V-Dem Database v2x_corr variable) Meritocracy Measures the extent of meritocracy and skills in decisions for state
administration appointments. It originally ranges from 0 to 4. We have rescaled this variable to range between 0 and 1. Higher values indicate higher levels of meritocracy. (V-Dem Database v2stcritrecadm variable)
Sources: World Values Survey (wave 6, 2010–2014) for all individual level variables; World Bank for GDP per capita (at constant 2010 US dollars) and Unemployment Rate; Gallagher (1991) for Gallagher Index; V-Dem Database (V-Dem Dataset 2017) for Polyarchy, Political Corruption and Meritocracy
Appendix 3: Descriptive statistics of variables
Mean Maximum Minimum SD N
Individual level variables
Trust in state institutions 2.33 4 1 0.77 56,510
Education 2.68 4 1 0.88 60,072
Female 0.52 1 0 0.50 60,342
Age 43.26 99 16 17.02 60,285
Religiosity index 3.01 4 1 0.83 56,615
Interpersonal trust 0.24 1 0 0.43 58,945
Left–right ideological self-Placement 5.73 10 1 2.32 50,537
Supporting incumbent 0.31 1 0 0.46 60,388
Post-materialism index 0.39 1 0 0.31 57,988
Country level variables
Logarithm of GDP per capita 9.24 10.88 6.83 1.17 40
Mean Maximum Minimum SD N
Unemployment rate (%) 7.64 24.6 0.7 5.04 40
Polyarchy 0.72 0.93 0.34 0.18 40
Political corruption 0.38 0.90 0.006 0.30 40
Meritocracy 0.30 0.72 0.091 0.19 20
Sources: World Values Survey (wave 6, 2010–2014) for all individual level variables; World Bank for GDP per capita (at constant 2010 US dollars) and Unemployment Rate; Gallagher (1991) for Gallagher Index; V-Dem Database (V-Dem Dataset 2017) for Polyarchy, Political Corruption and Meritocracy
Appendix 4: Eigenvalues and factor loadings from polychoric principal
factor analysis
N Eigenvalues Factor loadings
Factor 1 Factor 2 Factor 3 Trust in
parliament Trust in govern-ment Trust in jus-tice system All countries 56,510 1.804 − 0.095 − 0.159 0.805 0.821 0.694 Argentina 973 1.725 − 0.059 − 0.183 0.835 0.758 0.673 Armenia 1008 2.032 − 0.053 − 0.116 0.890 0.892 0.666 Australia 1424 1.724 − 0.064 − 0.167 0.811 0.837 0.604 Brazil 1441 1.618 − 0.071 − 0.196 0.700 0.808 0.689 Chile 964 1.783 − 0.090 − 0.169 0.824 0.753 0.731 Colombia 1466 1.859 − 0.089 − 0.157 0.728 0.837 0.792 Cyprus 966 1.627 − 0.102 − 0.176 0.778 0.778 0.644 Ecuador 1199 1.402 − 0.126 − 0.191 0.722 0.699 0.626 Estonia 1533 1.838 − 0.045 − 0.148 0.845 0.871 0.603 Georgia 1062 2.096 − 0.032 − 0.114 0.887 0.915 0.686 Germany 1928 2.003 − 0.013 − 0.065 0.947 0.946 0.458 Ghana 1552 1.420 − 0.108 − 0.200 0.654 0.744 0.661 India 3483 1.676 − 0.129 − 0.163 0.733 0.773 0.734 Japan 2003 1.949 − 0.024 − 0.094 0.917 0.920 0.510 Kyrgyzstan 1483 1.893 − 0.113 − 0.143 0.770 0.818 0.794 Lebanon 917 1.124 − 0.144 − 0.194 0.573 0.624 0.636 Malaysia 1298 1.953 − 0.088 − 0.141 0.732 0.848 0.835 Mexico 1961 1.710 − 0.137 − 0.153 0.754 0.767 0.743 Netherlands 1748 2.095 − 0.034 − 0.090 0.920 0.923 0.628 New Zealand 731 1.954 − 0.059 − 0.129 0.876 0.872 0.653 Nigeria 1759 1.760 − 0.090 − 0.169 0.776 0.821 0.695 Pakistan 1139 1.119 − 0.049 − 0.238 0.642 0.706 0.456 Peru 1182 1.901 − 0.121 − 0.138 0.802 0.806 0.778 Philippines 1196 1.603 − 0.128 − 0.171 0.696 0.760 0.735 Poland 845 1.859 − 0.022 − 0.157 0.829 0.882 0.627 Romania 1377 1.911 − 0.023 − 0.126 0.878 0.901 0.571 Singapore 1971 2.195 − 0.048 − 0.119 0.856 0.908 0.797
N Eigenvalues Factor loadings Factor 1 Factor 2 Factor 3 Trust in
parliament Trust in govern-ment Trust in jus-tice system Slovenia 1002 1.977 − 0.046 − 0.119 0.886 0.894 0.626 South Africa 3331 1.926 − 0.085 − 0.152 0.769 0.849 0.782 South Korea 1193 1.876 − 0.026 − 0.172 0.755 0.873 0.736 Spain 1115 1.554 − 0.082 − 0.197 0.789 0.717 0.645 Sweden 1148 1.679 − 0.078 − 0.174 0.817 0.792 0.618 Taiwan 1112 1.914 − 0.097 − 0.148 0.793 0.837 0.763 Thailand 1087 1.668 − 0.081 − 0.172 0.809 0.800 0.610
Trinidad and Tobago 870 1.916 − 0.057 − 0.133 0.867 0.873 0.633
Tunisia 1055 1.588 − 0.025 0.181 0.804 0.839 0.486
Turkey 1519 1.828 − 0.093 − 0.155 0.824 0.816 0.693
Ukraine 1500 2.134 − 0.039 − 0.117 0.879 0.912 0.728
United States 2152 1.884 − 0.025 − 0.160 0.818 0.881 0.661
Uruguay 897 1.760 − 0.079 − 0.160 0.824 0.822 0.635
Source: World Values Survey, Wave 6 (2010–2014)
Appendix 5: Variance inflation factors (VIF) for variables
VIF Tolerance
(1/VIF) Individual level variables
Education level 1.21 0.82
Female 1.03 0.97
Age 1.16 0.86
Religiosity index 1.60 0.62
Interpersonal trust 1.11 0.90
Left–right ideological self-placement 1.09 0.91
Supporting incumbent 1.05 0.95
Post-materialism index 1.03 0.97
Country level variables
Logarithm of GDP per capita 4.41 0.23
Gallagher index 1.89 0.53
Unemployment rate 1.38 0.73
Polyarchy 3.67 0.27
Political corruption 8.91 0.11
Meritocracy 3.04 0.33
Sources: World Values Survey (wave 6, 2010–2014) for all individual level variables; World Bank for GDP per capita (at constant 2010 US dollars) and Unemployment Rate; Gallagher (1991) for Gallagher Index; V-Dem Database (V-Dem Dataset 2017) for Polyarchy, Political Corruption and Meritocracy. Vari-ance inflation factors are derived from linear multiple regression model of “Trust in State Institutions” on explanatory variables
Appendix 6: Measurement invariance analysis
χ2 DF χ2/DF CFI (ΔCFI) TLI RMSEA SRMR CD AIC BIC
All countries Configu-rational invari-ance 53,593.4*** 120 446.6 1.000 1.000 0.000 0.000 0.795 366,500.6 369,719.8 Metric invari-ance 2025.2*** 117 17.3 0.964 (− 0.036) 0.963 0.107 0.146 0.769 368,291.9 370,464.8 Scalar invari-ance 19,403.7*** 234 82.9 0.642 (− 0.322) 0.816 0.241 0.278 0.795 385,436.4 386,563.1 Free countries (Argentina, Australia, Brazil, Chile, Taiwan, Cyprus, Estonia, Germany, Ghana, India, Japan,
South Korea, Netherlands, New Zealand, Peru, Poland, Romania, Slovenia, South Africa, Spain, Sweden, Trini-dad and Tobago, United States, Uruguay)
Configu-rational invari-ance 32,819.5*** 72 455.8 1.000 1.000 0.000 0.000 0.807 221,520.3 223,347.6 Metric invari-ance 1378.0*** 69 19.9 0.960 (− 0.04) 0.958 0.114 0.150 0.770 222,760.3 224,003.9 Scalar invari-ance 10,817.8*** 138 78.4 0.674 (− 0.286) 0.830 0.231 0.258 0.788 232,062.0 232,721.9 Partly free countries (Armenia, Colombia, Ecuador, Georgia, Kyrgyzstan, Lebanon, Malaysia, Mexico, Nigeria,
Pakistan, Philippines, Singapore, Thailand, Tunisia, Turkey, Ukraine) Configu-rational invari-ance 20,773.9*** 48 432.8 1.000 1.000 0.000 0.000 0.780 144,980.3 146,129.7 Metric invari-ance 529.9*** 45 11.8 0.977 (− 0.023) 0.975 0.089 0.105 0.770 145,420.3 146,210.5 Scalar invari-ance 7600.3*** 90 84.4 0.638 (− 0.339) 0.807 0.249 0.262 0.803 152,400.6 152,831.6 Welzel Latin America (Argentina, Brazil, Chile, Colombia, Ecuador, Mexico, Peru, Trinidad and Tobago,
Uru-guay) Configu-rational invari-ance 9152.3*** 27 338.9 1.000 1.000 0.000 0.000 0.789 75,670.5 76,261.9 Metric invari-ance 257.1*** 24 10.7 0.974 (− 0.026) 0.971 0.089 0.086 0.774 75,879.6 76,295.8 Scalar invari-ance 1517.8*** 48 31.6 0.839 (− 0.135) 0.909 0.159 0.108 0.781 77,092.3 77,333.3