ON-LINE NEW EVENT DETECTION AND
TRACKING IN A MULTI-RESOURCE
ENVIRONMENT
a thesis
submitted to the department of computer engineering
and the institute of engineering and science
of b˙ilkent university
in partial fulfillment of the requirements
for the degree of
master of science
By
Hakan Kurt
September, 2001
I certify that I have read this thesis and that in my opinion it is fully adequate, in scope and in quality, as a thesis for the degree of Master of Science.
Prof. Dr. H. Altay G¨uvenir (Advisor)
I certify that I have read this thesis and that in my opinion it is fully adequate, in scope and in quality, as a thesis for the degree of Master of Science.
Prof.Dr. Fazlı Can
I certify that I have read this thesis and that in my opinion it is fully adequate, in scope and in quality, as a thesis for the degree of Master of Science.
Assist. Prof. Dr. Attila G¨ursoy
Approved for the Institute of Engineering and Science:
Prof. Dr. Mehmet B.Baray Director of the Institute
ABSTRACT
ON-LINE NEW EVENT DETECTION AND
TRACKING IN A MULTI-RESOURCE ENVIRONMENT
Hakan Kurt
M.S. in Computer Engineering Supervisor: Prof. Dr. H. Altay G¨uvenir
September, 2001
As the amount of electronically available information resources increase, the need for information also increases. Today, it is almost impossible for a person to keep track all the information resources and find new events as soon as possible. In this thesis, we present an on-line new event detection and tracking system, which automatically detects new events from multiple news resources and immediately start tracking events as they evolve. Since we implemented the on-line version of event detection approach, the novelty decision about a news story is done be-fore processing the next one. We also present a new threshold, called support threshold, used in detection process to decrease the number of new event alarms, that are caused by informative and one-time-only news. The support threshold can be used to tune the weights of news resources. We implemented the tracking phase as an unsupervised learning process, that is, detected events are automati-cally tracked by training the system using the first news story of an event. Since events evolve over time, an unsupervised adaptation is used to retrain the track-ing system in order to increase the tracktrack-ing system performance. Adaptation is achieved by adding predicted documents to the training process. From the corpus observations, we conclude that one news story can be associated to more than one event. For this reason, the tracking system can relate a news story to more than one event. The on-line new event detection and tracking system has been tested on the Reuters news feed, available on the Internet. The Reuters news feed, that we used, comprises four independent news resources. The news stories are in Turkish.
Keywords: Event detection, event tracking, information retrieval.
¨
OZET
C
¸ OK KANALLI KAYNAK ORTAMINDA C
¸ EVR˙IM˙IC
¸ ˙I
YEN˙I OLAY BEL˙IRLEME VE TAK˙IB˙I
Hakan Kurt
Bilgisayar M¨uhendisli˘gi, Y¨uksek Lisans Tez Y¨oneticisi: Prof. Dr. H. Altay G¨uvenir
Eyl¨ul, 2001
Elektronik ortamdaki bilgi miktarı arttık¸ca bilgiye olan ihtiya¸c da artmak-tadır. Bug¨un, bir ki¸sinin b¨ut¨un bigi kaynaklarını takip etmesi ve yeni olaylari olabildi˘gince kısa zamanda bulması hemen hemen imkansızdır. Bu tezde, bir-den fazla haber kayna˘gından otomatik olarak yeni olayları belirleyen ve olaylar geli¸stik¸ce onları anında takibe ba¸slayan, ¸cevrimi¸ci yeni olay belirleme ve takip sis-temi sunuyoruz. Olay belirleme yakla¸sımının ¸cevrimi¸ci versiyonunu uyguladı˘gımız i¸cin, haber metni hakkındaki yenilik kararı bir sonraki haber i¸sleme alınmadan yapılmaktadır. Ayrıca, destek e¸si˘gi olarak adlandırdı˘gımız, belirleme i¸sleminde, bilgi verici ve bir seferlik haberler tarafından sebep olunan yeni olay alarmlarının sayısını azaltmak maksadıyla kullanılan yeni bir e¸si˘gi de tanıtıyoruz. Destek e¸si˘gi, haber kaynaklarının a˘gırlı˘gını ayarlamak i¸cin de kullanılabilir. Takip etme safhasını, denetlemesiz ¨o˘grenme metodu ¸seklinde uyguladık, yani belirlenen olay-lar bir olayın ilk haberini kullanarak otomatik oolay-larak takip edilir. Olayolay-lar zaman ge¸ctikce geli¸sti˘gi i¸cin, takip etme sisteminin performansını arttırmak maksadıyla, bir denetlemesiz adaptasyon y¨ontemi takip sistemini tekrar e˘gitmek i¸cin kullanılır. Adaptasyon tahmin edilen dok¨umanların e˘gitim i¸slemine eklenmesiyle sa˘glanır. Toplanan haberlerin incelenmesinden, bir haber metninin birden fazla olaydan bahsedebilece˘gi sonucuna vardık. Bu sebeple, takip sistemi bir haber metnini
birden fazla olayla ili¸skilendirecek ¸sekilde uygulandı. C¸ evrimi¸ci yeni olay
belir-leme ve takip sistemi, ˙Internet’te mevcut olan, Reuters haber kayna˘gında teste-dildi. Kullandı˘gımız Reuters haber kayna˘gı d¨ort ba˘gımsız haber kayna˘gını i¸cerir ve haberleri T¨urk¸ce’dir.
Anahtar s¨ozc¨ukler : Olay belirleme, olay takibi, bilgi eri¸simi.
v
T¨
urk Silahlı Kuvvetleri’ne,
E¸sim Nazan’a
Acknowledgement
I am very grateful to my supervisor, Prof. Dr. H. Altay G¨uvenir for his invaluable support, guidance and motivation.
I also would like to thank my thesis committee members Prof. Dr. Fazlı Can and Assist. Prof. Dr. Attila G¨ursoy for their valuable comments to improve this thesis.
I would like to thank to my friends T¨urker Yılmaz, G¨ultekin Arabacı, Sez-gin Abalı, ˙Ilker Yoncacı and Erdo˘gan Bıkmaz for their valuable help during the preparation phase of this thesis.
I would like to thank to my sister, Ruhan Kurt, and my parents, Makbule and Mehmet Kurt, for their moral support.
Finally, I would like to thank to my wife, Nazan Kurt, for her moral support, patience and love during the first year of our marriage.
Contents
1 Introduction 1
1.1 Event Analysis . . . 2
1.2 News Analysis . . . 3
1.3 Event Detection Methods . . . 4
1.4 Event Tracking . . . 5
1.5 Overview of the Thesis . . . 5
2 Related Work 8 2.1 On-line New Event Detection Approaches . . . 9
2.1.1 The CMU Approach . . . 9
2.1.2 The UMass Approach . . . 12
2.1.3 Dragon Approach . . . 14
2.1.4 UPenn Approach . . . 15
2.1.5 BBN Technologies’ Approach . . . 16
2.1.6 Summary of New Event Detection Approaches . . . 18
CONTENTS viii
2.2 Event Tracking Approaches . . . 19
2.2.1 CMU Approach . . . 19
2.2.2 UMass Approach . . . 22
2.2.3 Dragon Approach . . . 23
2.2.4 UPenn Approach . . . 23
2.2.5 BBN Technologies’ Approach . . . 23
2.2.6 Combining Multiple Learning Strategies . . . 24
2.2.7 Summary of Event Tracking Approaches . . . 26
3 On-line New Event Detection and Tracking 27 3.1 On-line New Event Detection . . . 27
3.1.1 Preprocessing . . . 28 3.1.2 Document Representation . . . 28 3.1.3 Document Comparison . . . 30 3.1.4 Time Window . . . 30 3.1.5 Novelty Decision . . . 31 3.1.6 Support Threshold . . . 32 3.2 Event Tracking . . . 33
3.2.1 K-Nearest Neighbor Classification . . . 34
3.2.2 Event Tracking Method . . . 35
CONTENTS ix
4 Experimental Design and Results 38
4.1 Evaluation Methodology . . . 38
4.1.1 Effectiveness Measures . . . 39
4.1.2 Performance Measures . . . 39
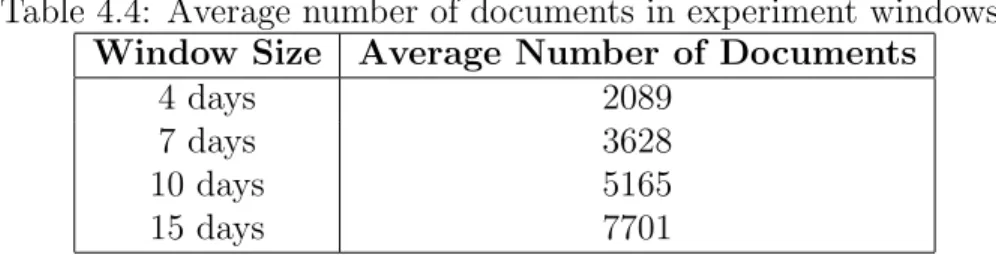
4.2 Experimental Results . . . 40
4.2.1 Time Windowing Parameter Selection . . . 41
4.2.2 11-pass Test Results . . . 41
4.2.3 Event Tracking Results . . . 44
4.2.4 The Effect of Support Threshold . . . 46
5 Conclusion and Future Work 49
List of Figures
2.1 Single-pass clustering algorithm . . . 11
2.2 On-line new event detection algorithm of UMass [6, 14, 15]. . . 12
2.3 On-line new event detection algorithm of BBN Technologies . . . 17
2.4 Summary of New Event Detection Approaches . . . 18
2.5 Best Overall Result Generator (BORG) algorithm . . . 25
2.6 Summary of Event Tracking Approaches . . . 26
3.1 On-line new event detection and tracking algorithm. . . 37
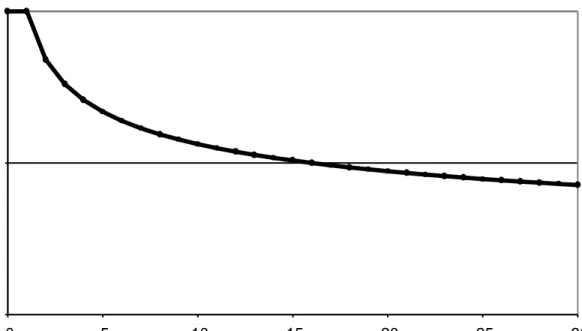
4.1 Value of time penalty function for α = 0.25. . . . 42
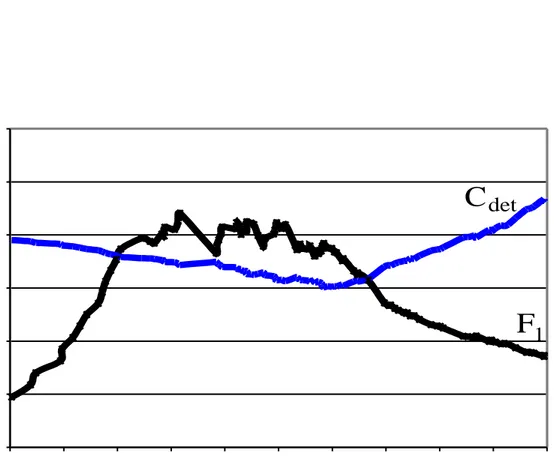
4.2 On-line detection F1 and Cdet curves for micro-averaged values of 15 day window size. . . 43
A.1 Distribution of documents in the corpus. . . 55
A.2 Average number of documents per day, according to the weeks of the corpus. . . 56
A.3 Distribution of events across the corpus. . . 57
List of Tables
1.1 Comparison of our approach with previous work. . . 6
4.1 Contingency table for on-line detection . . . 39
4.2 Contingency table for tracking . . . 39
4.3 Performance measures for on-line detection and tracking. . . 40
4.4 Average number of documents in experiment windows. . . 41
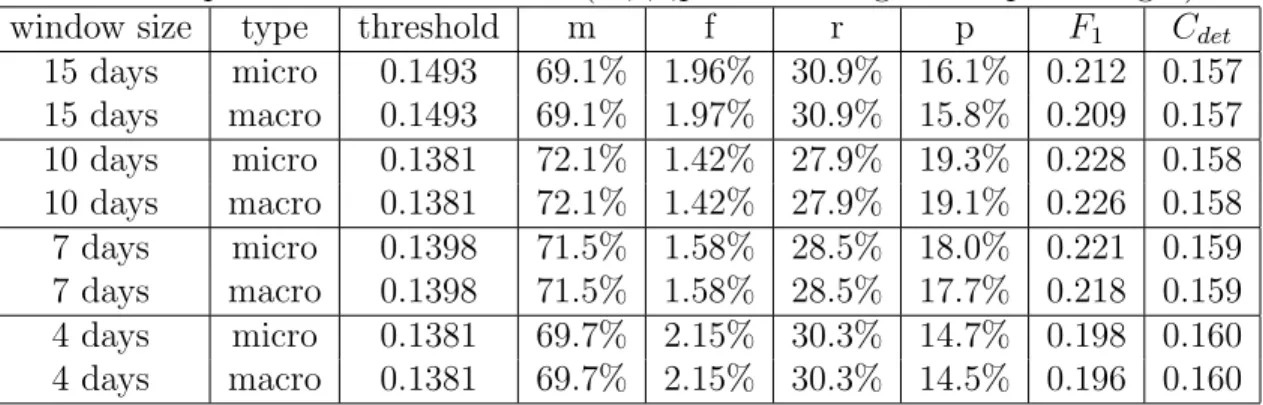
4.5 Optimum threshold values(m,f,r,p values are given in percentages). 44 4.6 Macro averaged tracking results for 0.15 detection threshold with 15 days window size(m,f,r,p values are given in percentages). . . . 45
4.7 Optimum decision thresholds for tracking system. . . 45
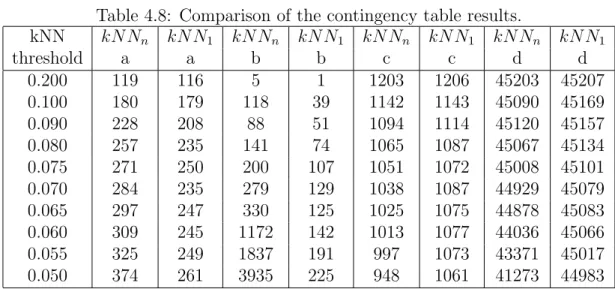
4.8 Comparison of the contingency table results. . . 46
4.9 Support threshold evaluation methods. . . 47
4.10 Number of new event alarms for the methods 1-10. . . 47
4.11 The analysis of the number of new event alarms for the methods 11-13. . . 48
A.1 Selected events from the corpus. . . 56 xi
LIST OF TABLES xii
List of Symbols and Abbreviations
SYMBOLS
fik : Term frequency of word i in document k.
M : Number of words in the corpus.
N : Number of documents in training corpus
Nt : Number of training documents for event tracking
sim(k, q) : Similarity between document k and document (cluster) q.
wik : Weight of word i in document k.
ABBREVIATIONS
ASR : Automatic Speech Recognition
BORG : Best Overall Result Generator
CMU : Carnegie Mellon University
DARPA : Defence Advanced Research Project Agency
DET : Decision Error Trade-off
dtree : Decision-Tree Induction
IDF : Inverse Document Frequency
IR : Information Retrieval
kNN : k-Nearest Neighbor
NIST : National Institute of Standards and Technology
RF : Relevance Feedback
TDT : Topic Detection and Tracking
TF : Term Frequency
TIDES : Translingual Information Detection, Extraction, and Summarization
UMass : University of Massachusetts, Amherst
Chapter 1
Introduction
The rapidly-growing amount of electronically available information threatens to overwhelm human attention, raising new challenges for information retrieval tech-nology. Traditional query-based retrieval is useful when one knows more precisely the nature of the events or facts one is seeking, and less useful when one wants specific information but can only formulate a larger category-query sharing few if any terms with the potentially most useful texts. In short, information retrieval based on immediate-content-focused queries is often insufficient for obtaining a variety of relevant stories and tracking the gradual evolution of events through time [26].
It would be desirable for an intelligent system to automatically detect signifi-cant events from large volume of news stories with a desired level of abstraction, alert the new events as they happen, and track events as they evolve.
In this thesis, we discuss and evaluate solutions to on-line new event detec-tion from chronologically-ordered streams of news stories coming, from multiple resources, and track events over time.
CHAPTER 1. INTRODUCTION 2
1.1
Event Analysis
Event means some unique thing that happens at some point in time. The notion of an event differs from a broader category of events both in spatial/temporal localization and in specificity [3]. Specific time and place information differs event from the broader category “topic”. For example, Kocaeli earthquake in
1999 is an event but not a topic, while the term earthquakes refers to a topic but
not an event.
From a journalist’s perspective, a news story about an event will typically specify :
• When the event occurred?
• Who was involved?
• Where it took place?
• How it happened?
• The impact, significance, or consequence of the event on the intended
au-dience.
However, as an event evolves, many of these properties are either not initially known, or be assumed to be known by the audience and therefore are not refer-enced within the text of documents relating to the same event. As a result, the lack of certain event properties and the appearance of new lexical features within documents relating to the same event should be expected as the event evolves [14, 15].
Several patterns emerged from observations of temporal event distributions [3, 26, 28] and also several properties of events derived:
• Events might be unexpected or expected.
CHAPTER 1. INTRODUCTION 3
• News stories discussing the same event tend to be temporally proximate.
• A time gap between bursts of topically similar stories is often an indication
of different events.
• A significant vocabulary shift and rapid changes in term frequency
distri-bution are typical of stories reporting a new event.
• Events are typically reported in a relatively brief time window (e.g. 1-4
weeks) and contain fewer reports than broader topics.
1.2
News Analysis
A detailed investigation of news is also required, since events are told in news stories.
News can be defined as a new information about a subject of some public
interest that is shared with some portion of the public [19].
News is the unusual. It is also something fresh, something that people have not heard before and, crucially, is of interest to readers. That means not just matters which affect the public or have an impact on public life, but also what is
of interest to the public [16].
For most consumers, most of the time, news is what is happening locally. Like any business person, the news provider serves his or her basic market first [12]. All the news providers in the world give priority to the events in their country, unless a very important event happens in another part of the world. Also, news providers give information about the local events such as local crimes, theaters, concerts etc., since, people want to learn what is happening around them.
From the definitions given above, it can be concluded that news stories which give information about an event are only the subset of news. This means that we need to find a system, which can select only the news stories that belongs to an event. Since events are often associated with news bursts, waiting for other news
CHAPTER 1. INTRODUCTION 4
stories which support the event can be a solution to the problem. Thus, only the events that are supported by more than one news stories are known by the user, and the others are hidden.
Some properties of news stories make the detection and tracking process dif-ficult:
• A news story might be about one or more events. We have observed many
news stories, in the corpus, which give information about more than one event. As a result, we conclude that one news story may give information about one or more than one event.
• When a new event happens, all of the news stories give information about
that event only (answers to when, where, how and who type of questions). After a while, the amount of new information about the event decreases. Subsequently, news stories about the event usually turn to the discussions about the event with a broader perspective, that is topic related. For exam-ple, after a skyjack event, the news stories usually turn to the discussions about the security considerations of the airports, skyjack events in the past etc.
1.3
Event Detection Methods
New event detection is an unsupervised learning task, sub-divided into two forms. One is retrospective detection, which entails the discovery of previously uniden-tified events in a chronologically-ordered accumulation of stories. The other is
on-line detection, where the goal is to identify the onset of new events from live
news feeds in real-time. Both forms of detection intentionally lack advance knowl-edge of novel events, but may have access to unlabelled historical news stories for use as contrast sets [26].
The new event detection system has two on-line models of operation:
CHAPTER 1. INTRODUCTION 5
and the system indicates whether the current document contains or does not con-tain discussion of a new event before looking at the next document. In delayed mode, classification decisions deferred for a prespecified time interval. For exam-ple, the system could collect news throughout the day and provide the user with new events at the end of the day [14].
The detection system developed for this thesis works in immediate mode but the new event alarms are deferred until a userdefined support threshold is ex-ceeded.
1.4
Event Tracking
Event tracking is defined to be the task of associating incoming stories with events known to the system. In the tracking task, a target event is given, and each successive story must be classified as to whether or not it discusses the target event [3]. The objective of event tracking is to correctly classify all of the subsequent stories.
We have the same objective, but a different approach is applied. According to the previous studies, a news story can be related to only one event, since there are only small number of counter examples in their corpus. However, we found that this assumption is too strong for our corpus. As a result of this fact, we implemented our tracking system with a weaker assumption: the first news story of an event cannot be related to the existing events in the past, but the other news stories can be related to more than one event.
1.5
Overview of the Thesis
In this thesis, solutions to the on-line new event detection and tracking problem for multi-resource news feed case is introduced. Our approach to the on-line new event detection and tracking problem is different from the other approaches that
CHAPTER 1. INTRODUCTION 6
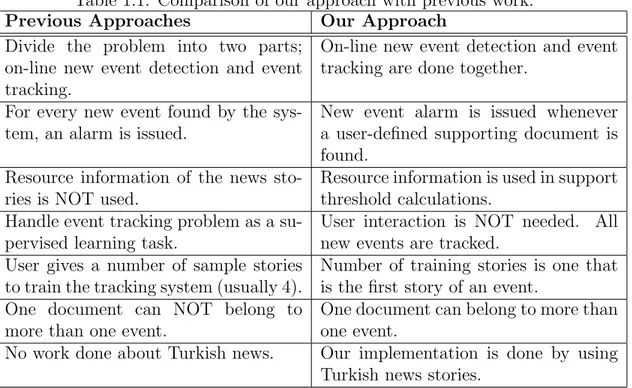
we found in the literature. The differences are shown in Table 1.1. Table 1.1: Comparison of our approach with previous work.
Previous Approaches Our Approach
Divide the problem into two parts; on-line new event detection and event tracking.
On-line new event detection and event tracking are done together.
For every new event found by the sys-tem, an alarm is issued.
New event alarm is issued whenever a user-defined supporting document is found.
Resource information of the news sto-ries is NOT used.
Resource information is used in support threshold calculations.
Handle event tracking problem as a su-pervised learning task.
User interaction is NOT needed. All new events are tracked.
User gives a number of sample stories to train the tracking system (usually 4).
Number of training stories is one that is the first story of an event.
One document can NOT belong to more than one event.
One document can belong to more than one event.
No work done about Turkish news. Our implementation is done by using
Turkish news stories.
We define the on-line new event detection and tracking problem as:
On-line new event detection and tracking is to find the first document that talks about an event which is not previously reported, warn the user about the new event after a given amount of supporting document are observed from one or multiple resources, and track each event without user interac-tion.
In order to test our approach, we created a corpus which spans the period from January 2,2001 to March 31,2001 with 46,530 Turkish news stories from the Reuters newswire. Corpus consists of four different news resources of Reuters, which are Anadolu News Agency, D¨unya News Agency, ˙Istanbul Stock Exchange
Company News and Reuters News itself. Anadolu News Agency news stories
con-tain political, sports, economical, cultural, local and other types of events. D¨unya News Agency news stories usually contain economical and political events, and long comments about economical and political events. ˙Istanbul Stock Exchange
CHAPTER 1. INTRODUCTION 7
Company News contains only short stock market news stories. Reuters News contains economical news stories in general. From 46,530 news, we selected 15 events which form 1322 (2.8% of the corpus) stories to test our approach.
In the next chapter, information about previous work about on-line new event detection and tracking is given. In Chapter 3, our solutions for on-line new event detection part of the problem with detailed information about the document representation, similarity and threshold calculations are presented. Than, we present our event tracking approach. At the end of the Chapter 3, a complete algorithm of our system is given. Chapter 4 presents the evaluation methodology, effectiveness measures, and results of our experiments respectively. Conclusions of the thesis and plans for future work are discussed in Chapter 5.
Chapter 2
Related Work
The main motivation of this thesis is affected from the studies and results of a research called Topic Detection and Tracking (TDT). TDT is a Defence Advanced Research Project Agency (DARPA)-sponsored initiative to investigate the state of the art in finding and following new events in a stream of broadcast news stories.
The basic idea for TDT originated in 1996. A pilot study laid the essential groundwork in 1997, producing a small corpus and establishing feasibility. Dur-ing 1998 and 1999, TDT research blossomed, with new and more challengDur-ing tasks, many more participating sites, and considerably larger multilingual cor-pora (adding automatic speech recognition (ASR) data in 1998 and Chinese data in 1999) [21].
TDT research is continuing under the new DARPA program known as TIDES (Translingual Information Detection, Extraction, and Summarization) with 28 organizations and universities [13].
For research purposes, TIDES is placing primary emphasis on English, Chi-nese, and Arabic – three important, challenging, and very different languages. Some other groups work on Korean, Japanese, or Spanish.
The approaches described below are taken from the articles and reports of this project group.
CHAPTER 2. RELATED WORK 9
2.1
On-line New Event Detection Approaches
In this section, we will give the approaches to solve the on-line new event detec-tion problem. Only the approaches about immediate mode are given, since our
implementation is on immediate mode of on-line event detection1.
2.1.1
The CMU Approach
The CMU (Carnegie Mellon University) approach uses conventional vector space model to represent the documents and traditional clustering techniques in infor-mation retrieval to represent the events [17].
Each document is represented using a vector of weighted terms which can be either words or phrases. In choosing a term weighting system, low weights should be assigned to high-frequency words that occur in many documents of a collection, and high weights to terms that are important in particular documents but unimportant in the remainder of the collection. A well-known term
weight-ing system followweight-ing that prescription assigns weight wik to term Ti in document
Dk in proportion to the frequency of occurrence of the term in Dk, and in
in-verse proportion to the number of documents to which the term is assigned [17]. Such a weighting system is known as a TFxIDF (Term Frequency times Inverse Document Frequency) weighting system. To allow a meaningful final retrieval similarity, it is convenient to use a length normalization factor as part of the term weighting formula. Under these considerations, for term weighting, “ltc” (logarithm of the term frequency) version of the TF-IDF schema [1, 7] is used as:
wik =
(1 + log2(fik)) ∗ log2(nNi)
qPM
j=1[(1 + log2(fik)) ∗ log2(nNj)]2
(2.1)
where wik is the weight of word i in document k and fik be the frequency of the
word i in document k, N the number of documents in the training corpus, ni the
number of times word i occurs in the training corpus, and M corresponds to the
1Small amount of deferral period before a decision is considered as in immediate mode. This amount is taken as less than 10 news stories for TDT implementations.
CHAPTER 2. RELATED WORK 10
number of words in the corpus. If the word does not appear in the training corpus
(ni = 0 or nj = 0), a default value 1 is used instead of these values.
For story and cluster representation, CMU uses the conventional vector space model. A story is presented as a vector whose dimensions are the stemmed unique terms in the corpus, and whose elements are the term (word or phrase) weights in the story. A cluster is represented using a prototype vector (or centroid) which is the normalized sum of story vectors in the cluster. The similarity of two stories
k and q is defined as the cosine value of the corresponding story vectors:
sim(k, q) = PM j=1wjk∗ wjq q (PM j=1w2jk) ∗ ( PM j=1w2jq) (2.2)
where sim(k, q) is the cosine similarity value, wjk is the weight of word j in
docu-ment k, wjq is the weight of word j in document q,M corresponds to the number
of words in the corpus, PMj=1w2
jk is the sum of squares of the word weights in
document k, andPM
j=1wjq2 is the sum of squares of the word weights in document
q. Similarly, the similarity of two cluster is defined as the cosine value of the
corresponding prototype vectors (i.e., cluster representatives, or centroids). As a clustering algorithm, incremental (single-pass) clustering algorithm with a time window is used (see Figure 2.1 for detailed information about the algorithm).
As it is described in Figure 2.1, the single-pass clustering algorithm is straight-forward. It sequentially processes the input documents, one at a time, and grows clusters incrementally. A new document is absorbed by the most similar cluster in the past if the similarity between the document and the cluster is above a
pre-selected clustering threshold (tc); otherwise, the document is treated as the seed
of a new cluster. By adjusting the threshold, one can obtain clusters at different levels of granularity.
CMU applied two types of time penalty functions to the similarity values between the current document x and cluster c. The purpose of the first function is to get the similarity values of the documents in the time window by weighting the similarity scores uniformly:
sim(x, c)0 =
sim(x, c) if c has any member-document in the time window
CHAPTER 2. RELATED WORK 11
1. The documents are processed sequentially.
2. The representation for the first document becomes the cluster representative of the first cluster.
3. Each subsequent document is matched against all cluster representatives existing at its processing time.
4. A given document is assigned to one cluster (or more if overlap is allowed) according to some similarity measure.
5. When a document is assigned to a cluster, the representative for that cluster is recomputed.
6. If a document fails a certain similarity test, it becomes the cluster repre-sentative of a new cluster.
Figure 2.1: Single-pass clustering algorithm where sim(x, c) is the cosine similarity.
The other one is a linear decaying weight function. The purpose of this func-tion is to decrease the influence of the clusters as the number of documents between a cluster c and the document x increase:
sim(x, c)0 =
(1 − i
m) ∗ sim(x, c) if c has any member-document in the time window
0 otherwise
where i is the number of documents between the current document x and the most recent member-document in cluster c, and m is the number of documents prior to x in time window.
Novelty decision is made by thresholding the maximum similarity score be-tween the document and any cluster in the time window [3, 26, 28]. The confidence score for the novelty decision is defined as:
score(i) = 1 − arg max
c {sim(i, c)
0} (2.3)
where i is the current document and sim(i, c)0 is the similarity value between
CHAPTER 2. RELATED WORK 12
2.1.2
The UMass Approach
The new-event detection algorithm in the UMass (University of Massachusetts, Amherst) was implemented by combining the ranked-retrieval mechanisms of In-query [9], a feature extraction and selection process based on relevance feedback [2], and the routing architecture of InRoute [8].
Events and documents are represented by queries. A modified version of the single-pass clustering algorithm (given in Figure 2.1) is used for new event detec-tion. This algorithm processes each new document on the stream sequentially, as shown in Figure 2.2.
1. Use feature extraction and selection techniques to build a query represen-tation to define the document’s content.
2. Determine the query’s initial threshold by evaluating the new document with the query.
3. Compare the new document against previous queries in memory.
4. If the document does not trigger any previous query by exceeding its thresh-old, flag the document as containing a new event.
5. If the document triggers an existing query, flag the document as not con-taining a new event.
6. (Optional) Add the document to the agglomeration list of queries it trig-gered.
7. (Optional) Rebuild existing queries using the document. 8. Add new query to memory.
Figure 2.2: On-line new event detection algorithm of UMass [6, 14, 15].
The document representation used in the system is a set of belief values cor-responding to each feature specified in a query. Belief values are produced by
CHAPTER 2. RELATED WORK 13
Inquery’s belief function, which is composed of TF-IDF. For any instance of doc-ument d and collection c :
di = belief (qi, d, c) = 0.4 + 0.6 ∗ tf ∗ idf (2.4) where tf = t t + 0.5 + 1.5 ∗ dl avg dl (2.5) idf = log( |c|+0.5 df ) log(|c| + 1) (2.6)
and t is the number of times feature qi occurs in the document, df (document
fre-quency) is the number of documents in which the feature appears in the auxiliary corpus, dl is the document’s length, avg dl is the average document length in the auxiliary corpus, and |c| is the number of documents in the auxiliary corpus.
An automatic process creates a classifier from single or multiple documents. The classifier formulation process has three main steps: feature selection, weight assignment, and threshold estimation. The selected features and weights are used to construct a classifier using Inquery’s query syntax.
The feature selection begins with collecting statistics from the words appear-ing in the trainappear-ing documents. The words that do not play a role in the catego-rization of a news document are called stopwords. Stopwords are removed from the documents, than the remaining words are sorted by the following measure:
r R −
nr
NR > 0 (2.7)
where R is the number of relevant documents and NR is the number of non-relevant documents in the training sample. The values r and nr are the number of documents in the corresponding relevant and non-relevant training sample containing the word. The top n words are used for weight assignment as:
qi,k = c1∗ tfrel− c2∗ tfnonrel (2.8)
where tfrel is average tf score (Equation 2.5) for the word in relevant documents,
CHAPTER 2. RELATED WORK 14
constants c1 and c2 are determined empirically, and it is found that setting c1 =
c2 = 0.5 works well.
A similarity value is calculated when comparing a document d to a query q using the #WSUM operator of Inquery:
sim(qi, dj) = PN i=1qi,k.dj,k PN i=1qi,k (2.9)
If a classifier is created at time i, that is, when the last relevant training document arrives, then the resulting classifier’s threshold for a document arriving at a later time j is computed as:
threshold(qi, dj) = 0.4 + θ ∗ (sim(qi, di)) − 0.4) + β ∗ (datej − datei) (2.10)
where sim(qi, di) is the similarity value between the classifier and the document
from which it was formulated (Equation 2.9), and 0.4 is an Inquery constant. The
value of (datej− datei) is the number of days between the arrival of document dj
and the formulation of the classifier qi. The values for θ and β control the new
event classification decisions.
When deciding whether a new event has arrived, decision scores are used as:
decision(qi, dj) = sim(qi, dj) − threshold(qi, dj) (2.11)
Decision scores greater than 0 imply that documents di and dj are similar in
content, and thus document dj does not discuss a new event [3, 6, 14, 15].
2.1.3
Dragon Approach
Dragon used the k-means algorithm to solve to on-line detection problem, by executing only the first pass of the algorithm [3]. Following this procedure, the first story in the corpus defines an initial cluster. The remaining stories in the corpus are processed sequentially; for each one, the “distance” to each of the existing clusters is computed. A story is inserted into the closest cluster unless this distance is greater than a threshold, in which case a new cluster is created.
CHAPTER 2. RELATED WORK 15
The decision to create a new cluster is equivalent to declaring the appearance of a new event.
Dragon used a new measure to compute the distances between a given story and existing clusters by smoothing the cluster distribution with a background distribution, and then preventing the cluster from being “dragged” by the story distribution. Two improvements were also made: a story-background distance was subtracted from the story-cluster distance (to compensate for the fact that small clusters tend to look a lot like background after smoothing), and a decay term was introduced to cause clusters to have a limited duration in time. This term is just a decay parameter times the distance between the number of the story represented by the distribution of the story count for a word and the number midway between the first and last stories in the cluster.
By adjusting the decay parameter and the overall threshold the on-line detec-tion system can be tuned.
2.1.4
UPenn Approach
UPenn (University of Pennsylvania) used the idf-weighted cosine coefficient [18]. It is a document similarity metric where documents are represented as vectors of an n-dimensional space, where n is the number of unique terms in the database. For their implementation, they weighted only the topic vector (vector which rep-resents the event) by idf and left the story vector under test unchanged. The resulting calculation for the similarity measure becomes:
sim(k, q) = PM j=1tfjk∗ tfjq ∗ idf (w) q (PM j=1tfjk2) ∗ ( PM j=1tfjq2) (2.12)
where sim(k, q) is the cosine similarity value between documents k and q, tfjk
is the term frequency of word j in document k, tfjq is the term frequency of
word j in document q, PM
j=1tfjk2 is the sum of squares of the term frequencies
in document k, and PM
j=1tfjq2 is the sum of squares of the term frequencies in
CHAPTER 2. RELATED WORK 16
Of the feature selection methods, they selected not the best but a simpler method between the approaches that they implemented: For each story, word counts (tf) are sorted, than n most frequent ones are kept. They set the number of selected features to 50.
As a system parameter, a deferral period is defined to be the number of files (each containing multiple stories) the system is allowed to process before it associates an event with the stories contained in the files.
The UPenn approach uses the single-linkage (nearest neighbor) clustering method to represent each event. This method begins with all stories in their own singleton clusters. Two clusters are merged if the similarity between any story of the first cluster and any story of the second cluster exceeds a threshold. To implement the clustering, the UPenn approach takes the stories of each deferral period and created an inverted index. Then each story, in turn, is com-pared with all preceding stories (including those from previous deferral periods). When the similarity metric for two stories exceeds a threshold their clusters are merged. The clusters of earlier deferral periods cannot merge since they have already been reported. If a story cannot be merged with an existing cluster, it becomes a new cluster which means a new event.
2.1.5
BBN Technologies’ Approach
The BBN approach uses an incremental k-means algorithm for clustering stories. For comparing stories, it utilizes a probabilistic document similarity metric and a traditional vector-space metric.
Although it is similar, the clustering algorithm they used is not precisely a k-means algorithm, because the number of clusters k is not given beforehand. This algorithm involves an iteration through the data that the system is permitted to modify and making appropriate changes during each iteration (see Figure 2.3).
CHAPTER 2. RELATED WORK 17
1. Use the incremental clustering algorithm (see Figure 2.1 for details) to pro-cess stories up to the end of the current modifiable window.
2. Compare each story in the modifiable window with the old clusters to de-termine whether each story should be merged with that cluster or used as a seed for a new cluster.
3. Modify all the clusters at once according to the new assignments. 4. Iterate steps (2)-(3) until the clustering does not change.
5. Look at the next few stories and go to (1).
Figure 2.3: On-line new event detection algorithm of BBN Technologies spotting metric which is derived from Bayes’ Rule:
p(C|S) ≈ p(C) ·Y n p0(s n|C) p(sn) (2.13) where p(C|S) is the probability that the given story belongs to the cluster C,
p(C) is the a priori probability that any new story will be relevant to cluster C, p(sn) is the occurrence probability of a story word sn, and p0(sn|C) is the
smoothed probability that a word in a story on the topic represented by cluster
C would be sn. Smoothing is done because of the zero probability of unobserved
words for the topic as:
p0(sn|C) = α · p(sn|C) + (1 − α) · p(sn) (2.14)
The BBN approach models p(sn|C) with a two-state mixture model, where
one state is a distribution of the words in all of the stories in the group, and the other state is a distribution from the whole corpus.
There are two types of metrics that are useful for the clustering algorithm: se-lection metric, which is the maximum probability value of the BBN topic spotting metric and thresholding metric, which is the binary decision metric to combine the story with a cluster. A score normalization method is used to produce im-proved scores [20].
CHAPTER 2. RELATED WORK 18
2.1.6
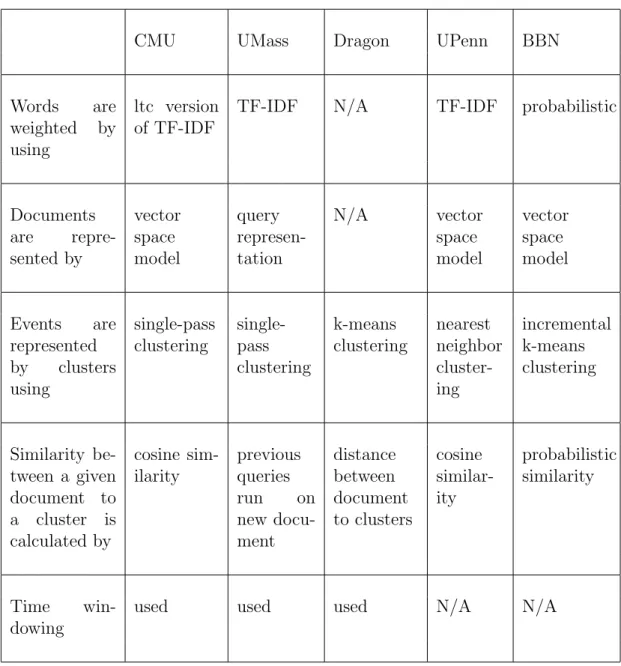
Summary of New Event Detection Approaches
Summary of the new event detection approaches are shown in Figure 2.4, where N/A means no information available.
CMU UMass Dragon UPenn BBN
Words are
weighted by
using
ltc version of TF-IDF
TF-IDF N/A TF-IDF probabilistic
Documents are repre-sented by vector space model query represen-tation N/A vector space model vector space model Events are represented by clusters using single-pass clustering single-pass clustering k-means clustering nearest neighbor cluster-ing incremental k-means clustering Similarity be-tween a given document to a cluster is calculated by cosine sim-ilarity previous queries run on new docu-ment distance between document to clusters cosine similar-ity probabilistic similarity Time win-dowing
used used used N/A N/A
CHAPTER 2. RELATED WORK 19
2.2
Event Tracking Approaches
Event tracking, according to the TDT, can be considered as a text categorization problem subject to the following constraints [25]:
• Each event of interest is defined by a set of positive instances (documents)
that are manually identified before tracking starts; no other knowledge is available.
• As soon as a new document arrives, a binary (YES/NO) decision must
made by the tracking system with respect to each defined event.
• Any document preceding the document being evaluated may be used as
training data. However, only the previously-identified positive instances are labelled; the rest of the documents are not, although some of these unlabelled documents may actually be positive instances.
• When training on an event, relevance judgements for other events are
as-sumed to be unknown.
As a result, event tracking for TDT is a supervised learning task. A target
event is given by Nt number of training documents, and each successive story
must be classified as to whether or not it discusses the target event. The tracking task is to correctly classify all of the incoming stories [3].
The official event tracking evaluation of TDT restricted the number (Nt) of
positive training examples per event to be 1,2,4,8 an 16, respectively [26].
2.2.1
CMU Approach
Researchers in CMU developed three methods for tracking events: a k-Nearest
Neighbor (kNN) classifier, a Decision-Tree Induction (dtree) classifier and Rocchio
CHAPTER 2. RELATED WORK 20
2.2.1.1 K-Nearest Neighbor Classification (kNN)
This method adapted conventional M-way classification kNN to the 2-way clas-sification problem of event tracking by constructing a 2-way kNN for each event. The system converts an input story into a vector as it arrives and compares it to the training stories, and select the k nearest neighbors based on the cosine similar-ity between the input story and the training stories. The documents, given by the user to track an event, are used as the positive training stories, and the other sto-ries in the corpus are used as negative training documents. The confidence score for a YES prediction on the input story is computed by summing the similarity scores for the positive and negative stories respectively in the k-neighborhood, and taking the difference between the two sums:
s1(x, k, D) = X y∈Pk cos(x, y) − X z∈Qk cos(x, z) (2.15)
where x is the test document; y (z) is a positive (negative) training document;
D is the training set of documents; k is the number of nearest neighbors of x in D, which the system uses to compute the score; Pk (Qk) is the set of positive
(negative) instances among the k nearest neighbors of x in D.
Binary decisions are obtained by thresholding locally on the confidence scores generated by each event-specific classifier.
Also, two modified version of kNN are used. In the first modified version, they take kp(≤ k) nearest positive examples and kn(≤ k) nearest negative examples from the k-neighborhood, and average the similarity scores of the two subsets respectively. The confidence score for the YES prediction on the input story is defined to be: s2(x, kp, kn, D) = 1 |Ukp| X y∈Ukp cos(x, y) − 1 |Vkn| X z∈Vkn cos(x, z) (2.16)
where Ukp consists of the kp nearest neighbors of x among the positive documents
in the training set; and Vkn consists of the kn nearest neighbors of x among the
negative documents in the training set. By introducing the parameters kp and
kn in addition to k, and by suitably choosing the parameter values, behavior of
CHAPTER 2. RELATED WORK 21
The second version is almost the same as Equation 2.15 except using the score averages instead of score sums as:
s3(x, k, D) = 1 |Pk| X y∈Pk cos(x, y) − 1 |Qk| X z∈Qk cos(x, z) (2.17)
where x is the test document; y(z) is a positive (negative) training document;
D is the training set of documents; k is the number of nearest neighbors of x in D, which the system uses to compute the score; Pk (Qk) is the set of positive
(negative) instances among the k nearest neighbors of x in D. This modification prevents negative examples to dominate.
2.2.1.2 Decision Trees
In the CMU approach, decision trees are constructed by selecting the feature with maximal information gain as the root node, and dividing the training data according to the values of this feature; then for each branch finding the feature which maximizes information gain over the training instances for that branch, and so on recursively. One potential disadvantage of decision trees is that, unlike kNN, they cannot generate a continuously varying tradeoff between miss and false alarms, or recall and precision. The parameters are tuned by cross-validation [26].
2.2.1.3 Rocchio
Rocchio is a classic information retrieval method for query expansion using rele-vance judgements on documents. It has been applied to text categorization in a modified form: c(D, γ) = 1 |R| X y∈R y + γ 1 |Sn| X z∈Sn z (2.18)
where c(D, γ) is the prototype or the centroid of a category and Rocchio’s rep-resentation of the event. D is a training set, R ∈ D consists of the training documents relevant to the query,γ is the weight of the component, summation
Sn ∈ D − R consists of the n most-similar (as measured by cosine similarity)
CHAPTER 2. RELATED WORK 22
This formula allows to selectively use the negative examples that lie in the neighborhood of the positive centroid. A test document can be scored by com-puting the cosine similarity between the test document x and the prototype of the event c(D, γ):
r(x, c(D, γ)) = cos(x, c(D, γ)) (2.19) A binary decision is obtained by thresholding on this score.
2.2.2
UMass Approach
The same text representation for event detection is also applied in event tracking. A classifier is formulated automatically from the lexical features of the training set of documents using the operators from Inquery’s query language. An event discussed in a set of relevant training documents is represented with a classifier comprising a query syntax and threshold. A separate threshold is estimated for each classifier, and documents on the stream that have similarity exceeding the threshold are classified as positive instances of an event, that is, the contents of the document are assumed to discuss the same event as the relevant document(s) with which the classifier was formulated.
Similarity scores from Equation 2.9 are needed to be normalized to produce good decision scores for tracking. They found that the most effective way was to normalize similarity scores using a standard normal transformation. The general form of the transformation is
decision score(qi, dj) =
sim(qi, dj) − µ
σ (2.20)
where sim(qi, dj) is the similarity between classifier qi and document dj. µ is the
mean, and σ is the standard deviation of a distribution of similarity values using Equation 2.9.
To increase the ability of the tracking system, they implemented the adaptive version of their tracking system. The adaptive version is needed since the discus-sion of an event changes over time. This idea is a form of unsupervised learning. An adaptive version of the tracking system can rebuild the query after it “tracks”
CHAPTER 2. RELATED WORK 23
a news story on a given event. Experiments show that adaptive tracking works
well if the number of training documents are high (Nt≥ 4) [3, 5, 14].
2.2.3
Dragon Approach
Dragon Systems uses statistical approaches in their tracking implementation.
Event models were build from the words in the Nttraining stories, after stopwords
were removed with some appropriate smoothing. In order to provide a more accurate smoothing for the event model, the mixture of the background topic models that best approximates the unsmoothed event model taken as the backoff distribution. Therefore, there is a different backoff model for every event and
every value of Nt.
A score for each story against its set of background models , as well as against the event model is computed, and the score difference between the best back-ground model and the event model is reported. A threshold is applied to this difference to determine whether a story is about the event or not. This threshold can be adjusted to tune the tracker’s output characteristics [3].
2.2.4
UPenn Approach
The UPenn approach uses the same weighting, comparison and future selection methods which are described in section 2.1.4 for event tacking. Results indicate that very simple feature selection with no normalization of topic scores performed best.
2.2.5
BBN Technologies’ Approach
The BBN approach uses the same approach that they used in event detection (see Section 2.1.5 for details). In addition to the topic spotting metric, they calculated two additional metrics called information retrieval (IR) metric and
CHAPTER 2. RELATED WORK 24
relevance feedback (RF) metric.
The IR metric looks at the problem in exactly the positive way. Given a query Q, the probability that any new story S is relevant to the query is calculated. In this case, it is assumed that the query was generated by a model estimated from the story.
p(SisR|Q) ≈ p(SisR) ·Y
n
p(qn|S) (2.21)
Again, the BBN approach uses a two-state model, where one state is a unigram distribution estimated from the story S, and the other is the unigram distribution from the hole corpus.
The RF measure is similar to the IR measure. Instead of using all of the words in the relevant stories, only those words that are common to at least two of the irrelevant stories are used.
Besides that, they also implemented causal unsupervised adaptation for their training documents, since more relevant stories usually lead to better models. Their unsupervised adaptation algorithm looks for a test story with very high score, adds it as a relevant story and re-train the system before working on the next test story.
In order to achieve optimum system performance and comparable scores, a statistical hypothesis test method is used to normalize scores.
Since different systems focus on different features of the stories, it seems rea-sonable to combine the probability scores from any tracking system. A linear combination of the log scores from the above three systems and the time decay method are used to increase system performance [10, 20].
2.2.6
Combining Multiple Learning Strategies
This approach hypothesize that, by combining the output scores of classifiers whose errors tend to be uncorrelated, the resulting system will have much less cross-collection and cross-event performance variance than those of the individual
CHAPTER 2. RELATED WORK 25
classifiers. This system is called as Best Overall Result Generator (BORG) [24]. BORG limits its empirical validation to Rocchio (see Section 2.2.1.3), the two variants of kNN (see Section 2.2.1.1) and BBN topic spotting language modelling (see Section 2.2.5) with a more careful analysis on the behavior of these classifiers and the conditions under which it combines them.
Decision Error Trade-off curve [11] of the classifiers is used as the primary means of analyzing the error patterns each produces. Given a validation set, following procedure shown in Figure 2.5 is used to generate a BORG system.
1. Run each classifier with different parameter settings, resulting in a set of system generated scores and a DET curve per run.
2. Select the runs whose DET curves are either globally optimal, or signifi-cantly better than other runs in a local region.
3. Combine the system output of selected runs by first normalizing the scores of each system and then compute the sum of the scores of multiple runs per test document. The normalization formula is
x0 = x − µ
s.d. (2.22)
where x is the original score, µ is the mean of the scores for the run, and
s.d. is their standard deviation. This results in a set of scores of BORG;
re-normalize these scores in the same way.
4. Find the optimal threshold for BORG on the validation set. Figure 2.5: Best Overall Result Generator (BORG) algorithm
CHAPTER 2. RELATED WORK 26
2.2.7
Summary of Event Tracking Approaches
Summary of the event tracking approaches, are shown in Figure 2.6.
Approach Summary
CMU Training documents are used as positive, other documents are used
as negative training documents. Three methods are used to make a decision about the given document.
• kNN classifier
• Decision trees induction • Rocchio
UMass Training documents are represented by a query and a threshold.
Similarity to the given document is found by running the query on it. If the similarity exceeds the threshold, we conclude that the given document is about given event.
Dragon Event models are produced by using training documents. Distance
between event models and given model is calculated with a statis-tical method. A threshold is applied to obtain the binary decision.
UPenn UPenn uses the similarity values, found in detection process.
Bi-nary decision is obtained by thresholding these values.
BBN BBN uses the same probabilistic method. Two additional metrics:
IR metric and RF metric are also calculated. Binary decision is obtained by combining these three metrics.
BORG Combines the output scores of four classifiers:
• Rocchio
• Two variants of kNN classifier • BBN topic spotting model
Chapter 3
On-line New Event Detection
and Tracking
A solution to on-line new event detection and tracking problem is presented in this chapter. On-line new event detection phase of the implementation is discussed first, since, the novelty decision about a new document is done first. After the event detection section, our solution to event tracking problem is given. The complete algorithm is given in the last section.
3.1
On-line New Event Detection
Our approach for on-line new event detection is based on the difference between an event and a news. Since every news item does not necessarily give information about an event, we need not to be informed about all the events found by the system. As a result, our detection system suggests that new event detections should be alarmed after a user-defined amount of supporting documents found.
CHAPTER 3. ON-LINE NEW EVENT DETECTION AND TRACKING 28
3.1.1
Preprocessing
Preprocessing is the first step in our implementation as in any other text catego-rization implementations. In this step, we transform the documents, which are typically strings of characters, into a representation convenient for detection algo-rithm. This process is done by deeper investigation of the documents. Frequent words that carry no information, called stopwords, (i.e. pronouns, prepositions, conjunctions etc.) are needed to be removed. Also removing suffixes from the word roots, called word stemming, are needed to increase the system perfor-mance [1]. As a result, preprocessing phase includes:
• Removing tags (i.e., time, resource info, etc.).
• Removing stopwords.
• Performing word stemming.
• Performing simple corrections.
In our implementation, deep lexical analysis of the words was not done, instead, a simple list of words that contains the word stems was prepared, and the words that start with any of the word in this list by its word stem were replaced. Also, the corpus that we study has a lot of incorrectly written words. In order to reduce the effect of these words, a one-to-one matching list of important names is used to correct them.
3.1.2
Document Representation
We implemented a commonly used document representation technique so called vector space model. In the vector space model, documents (stories) are repre-sented using a vector of weighted terms. There are several ways of determining the weight of a word in a document, but most of the approaches are based on two empirical observations regarding text:
CHAPTER 3. ON-LINE NEW EVENT DETECTION AND TRACKING 29
• The more times a word occurs in a document, the more relevant it is to the
topic of the document.
• The more times the word occurs throughout all documents in the collection,
the more poorly it discriminates between documents.
According to the criteria listed above, terms in a document vector are sta-tistically weighted using the term frequency (TF) and the Inverse Document Frequency (IDF). As a weighting schema, we selected tfc (term frequency
com-ponent) weighting, which take into account both the frequency of the word in a
document and the frequency of the word throughout all documents in the col-lection. Furthermore, it takes into account that documents may be of different lengths. Tfc weights are calculated using the Equation below:
wik =
fik∗ log(nNi)
qPM
j=1[fjk∗ log(nNj)]2
(3.1)
where wik is the weight of word i in document k and fik is the frequency of the
word i in document k, N is the number of documents in the collection, ni is the
total number of times word i that occurs in the hole collection, and M corresponds to the number of words in the auxiliary corpus. If the word does not appear in
the auxiliary corpus (ni = 0 or nj = 0), a default value 1 is used instead of these
values.
In order to use static IDF values, we used the incremental IDF. Since new stories arrive continuously, the new vocabulary from incoming documents should be inserted into the IDF calculations [28]. The incremental version of the IDF is defined to be:
IDF(t,p) = log(
Np
n(t,p)
) (3.2)
where p is the current time, t is a word, Np is the number of accumulated
doc-uments up to the current point in time, and n(t,p) is the number of documents
CHAPTER 3. ON-LINE NEW EVENT DETECTION AND TRACKING 30
As a result, the word weighting formula becomes:
wik = fik∗ log(nN(t,i)p ) r PM j=1[fjk ∗ log(nN(t,j)p )]2 (3.3)
3.1.3
Document Comparison
We did not grow any cluster, to represent events, in the implementation. Keeping individual documents without clustering makes the novelty test more difficult for the current story to pass, because this story must be sufficiently different from
all of the past stories, a stronger condition compared to being different from an average of past stories [26]. As a result, the current story with all the existing
stories in the time window is computed.
A similarity value is calculated while comparing two documents. The similar-ity of two documents is defined as the cosine value of the corresponding document vectors: sim(k, q) = PM j=1wjk∗ wjq q (PM j=1w2jk) ∗ ( PM j=1w2jq) (3.4)
where sim(k, q) is the cosine similarity value between documents k and q, wjk is
the weight of word j in document k, wjq is the weight of word j in document q,
PM
j=1w2jk is the sum of squares of the word weights in document k, and
PM j=1w2jq
is the sum of squares of the word weights in document q.
Since we are using tfc weighting schema (Equation 3.3), the sum of squares of the word weights for a document is equal to 1, and the denominator of the similarity equation becomes 1. So, we can simplify Equation 3.4 as:
sim(k, q) = M X j=1 wjk ∗ wjq (3.5)
3.1.4
Time Window
We also added the time penalty functionality to document similarity calculations [3, 26, 28]. We used day-based windowing with an exponential smoothing. Given
CHAPTER 3. ON-LINE NEW EVENT DETECTION AND TRACKING 31
the current document k in day datek in the input stream, we impose a time
window of m days prior to day d, and define the modified similarity between k
and any document q in the time window in day dateq:
sim(k, q)0 =
sim(k, q) if (datek− dateq) < 1
(datek− dateq)−α∗ sim(k, q) if (datek− dateq) ≥ 1
If a document’s date does not fall into the time window, the similarity between
that document and the current document is not computed. That is sim(k, q)0 is
assumed to be 0.
In order to apply the time penalty function, a two-phased method is used. In the first phase, we keep the k most similar documents in the time window without applying the smoothing function. This method allows us to find the
k most similar documents in the time window. In the second phase, we apply
the smoothing function to them. This process prevents the domination of the recent documents even if they are not similar to the older ones and increases the importance of the recent ones within the neighbors.
3.1.5
Novelty Decision
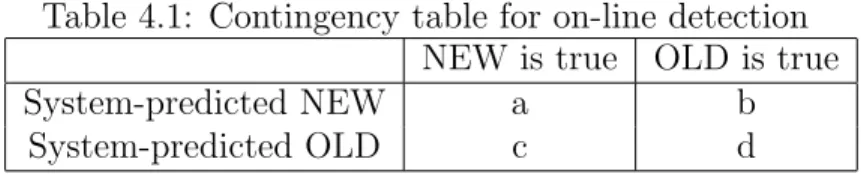
An additional threshold called novelty threshold (tn) was used [26]. If the maximal
similarity score between the current document and any document in the past are below the novelty threshold, then this document is labelled as “NEW”, meaning that it is the first story of a new event; otherwise a flag of “OLD” is issued. By tuning the novelty threshold, one can adjust the sensitivity to novelty in on-line detection. We formulate this approach with a decision score:
decision(di) = arg maxc {sim(i, c)0} − threshold (3.6)
where diis the current document, arg maxc{sim(i, c)0} is the maximum similarity
value between document i and any document in the time window, and threshold is the user-defined novelty threshold.
CHAPTER 3. ON-LINE NEW EVENT DETECTION AND TRACKING 32
discuss a new event. On the contrary, negative decision score is the indication of the new event.
In addition to the binary (New or Old) prediction, a confidence score is also computed for each incoming document, indicating how new this document is as measured by the system [26, 28]. This score is defined to be:
score(i) = 1 − arg max
c {sim(i, c)
0} (3.7)
where i is the current document and max{sim(i, c)0} is the maximum similarity
value between document i and any cluster in the time window.
3.1.6
Support Threshold
One of the main drawback of the previous on-line new event detection imple-mentations is that they focus on the first story detection and did not focus on the number of alarms. We observed from the experiments that the number of
new event alarms are so high that user of the system must look at the new event
alarms many times in a day.
In order to decrease the number of new event alarms, we added a new
user-defined threshold called support threshold (ts). By the help of this threshold, the
number of new event alarms can be decremented enormously.
Our approach is originated from the difference of the event and news (see Section 1.1 and 1.2 for details). As it is described in related section, news can be informative. We have observed many news stories that are talking about local events, local activities, results of the sportive activities etc. These type of one-time-only informative news stories should be eliminated and hidden from the user.
Our hypothesis is simple:
If a new event is worth for alarming, it should be supported by up-coming news in a short time.
CHAPTER 3. ON-LINE NEW EVENT DETECTION AND TRACKING 33
Since we assume a multi-resource environment, supporting news stories come rapidly. Because, all the news agencies rapidly react to new and important events. The more important the event is, the faster the reaction of the agencies will be.
Also, the user can define the support threshold easily. It is defined as the number of news stories needed from each resource before an alarm is issued. First, it is expressed by words. Then it is formulated by defining a weight for each resource, a test condition and an overall threshold. The resulting representation of the support threshold is also easy and understandable. User can change this definition easily.
Support threshold is checked when a new document is inserted into an event. An example of a support threshold can be defined as: “wait one supporting news story from any news resource including itself” This definition can be formulated as:
src1+ src2+ src3+ src4 > 1
where srciis the number of documents, in a given event, which belongs to resource
number i. We call the left-hand-side of the equation as support value. First, support value of an event is calculated. Then, the threshold is checked according to the condition. If the solution of the equation is true, then new event alarm for the event is issued. If the solution of the equation is false, nothing is done.
As a result, we make new event decision immediately, however we delay new
event alarm until a support threshold is exceeded. This approach decreases the
number of new event alarms dramatically, even if the support threshold is kept very small such as “wait one supporting news from any news resource including itself”.
3.2
Event Tracking
We implemented event tracking as an unsupervised learning task. The tracking process starts immediately after detection of a new event. Therefore, our tracking
CHAPTER 3. ON-LINE NEW EVENT DETECTION AND TRACKING 34
first document of an event. It is clear that as the number of training documents increases, the system performance also increases. Furthermore, events evolve over time. So it is always natural to add more training documents to a given event. This process is called as unsupervised adaptation [10], and we applied it by adding each tracked event to the training documents. We also propose that a news story can talk about more than one event, so it can belong to more then one event. In this chapter, we give our solutions to the event tracking problem according to considerations given above.
Our event tracking approach uses the similarity scores obtained from the new event detection calculations by keeping the k most similar documents and their similarity scores to the given document. If the decision for the given story in event detection phase is “old”, these k similarity information is used in the k-Nearest Neighbor (kNN) classification method to find the related events of the given document.
3.2.1
K-Nearest Neighbor Classification
Since it is found as a robust approach to text categorization, ranking among the top-performing classifiers in cross-method evaluations on benchmark collections, the kNN classification method is used for event tracking [23, 25, 27].
The kNN algorithm is quite simple [27]: given a test document, the system finds the k nearest neighbors among the training documents, and uses the cate-gories of the k neighbors to weight the category candidates. The similarity score of each neighbor document to the test document is used as the weight of the categories of the neighbor document. If several of the k nearest neighbors share a category, then the per-neighbor weights of that category are added together, and the resulting weighted sum is used as the likelihood score of that category with respect to the test document. By sorting the scores of candidate categories, a ranked list is obtained for the test document. By thresholding on these scores, binary category assignments are obtained.