Preparing fMRI Data for Postprocessing:
Conversion Modalities, Preprocessing
Pipeline, and Parametric and
Nonparametric Approaches
HUSSAIN A. JABER 1,5, HADEEL K. ALJOBOURI 2, İLYAS ÇANKAYA1,
ORHAN M. KOÇAK3, AND OKTAY ALGIN4,5,6
1Electrical and Electronics Engineering Department, Graduate School of Natural Science, Ankara Yıldırım Beyazıt University, 06010 Ankara, Turkey 2Biomedical Engineering Department, College of Engineering, Al-Nahrain University, Baghdad 10072, Iraq
3Psychiatry Department, School of Medicine, Kırıkkale University, 71450 Kırıkkale, Turkey 4Department of Radiology, City Hospital, 06800 Ankara, Turkey
5National MR Research Center (UMRAM), Bilkent University, 06800 Ankara, Turkey 6Department of Radiology, Ankara Yıldırım Beyazıt University, 06560 Ankara, Turkey
Corresponding author: Hussain A. Jaber ([email protected])
ABSTRACT The complexity of raw functional magnetic resonance imaging (fMRI) data with artifacts leads to significant challenges in multioperations with these data. FMRI data analysis is extensively used in neuroimaging fields, but the tools for processing fMRI data are lacking. A novel APP DESIGNER conversion, preprocessing, and postprocessing of fMRI (CPREPP fMRI) tool is proposed and developed in this work. This toolbox is intended for pipeline fMRI data analysis, including full analysis of fMRI data, starting from DICOM conversion, then checking the quality of data at each step, and ending in postprocessing analysis. The CPREPP fMRI tool includes 12 conversions of scientific processes that reflect all conversion possibilities among them. In addition, specific preprocessing order steps are proposed on the basis of data acquisition mode (interleaved and sequential modes). A severe and crucial comparison between statistical parametric and nonparametric mapping approaches of second-level analysis is presented in the same tool. The CPREPP fMRI tool can provide reports to exclude subjects with the extreme movement of the head during the scan, and a range of fMRI images are generated to verify the normalization effect easily. Real fMRI data are used in this work to prepare fMRI data tests. The experiment stimuli are chewing and biting, and the data are acquired from the National Magnetic Resonance Research (UMRAM) Center in Ankara, Turkey. A free dataset is used to compare the methods for postprocessing fMRI tests.
INDEX TERMS Analyze data (img/hdr), DICOM, fMRI, NIFTI, parametric and nonparametric approaches.
I. INTRODUCTION
Functional magnetic resonance imaging (fMRI) blood oxy-gen level-dependent (BOLD) signals are less than numerous noise sources in the recording stage. Therefore, the pre-processing of fMRI data is decisive and essential prior to postprocessing analysis. During a scanning session, fMRI directly measures changes in the BOLD signal and reflects neural activities. The acquired data (raw data, DICOM) con-tain imperfections and artifacts given subject movement, The associate editor coordinating the review of this article and approving it for publication was Mohammad Zia Ur Rahman.
spontaneous neural activities, and intrinsic electron thermal noises. Therefore, a certain degree of preprocessing analy-sis includes conversion data, and denoising steps must be performed before analyzing the fMRI. The preprocessing of fMRI data is implemented step by step, and the preprocessing pipeline is formed [1]. No consensus exists on the steps that must be performed in the preprocessing stage or on selecting parameters in those steps. Preprocessing poses numerous effects on BOLD fMRI data, and many studies have been conducted on this issue [2]. Stephen C Strother, for example, analyzed common preprocessing steps for BOLD fMRI and their possible influences [3]. In 2010, Yan Chao-Gan and
Zang Yu-Feng developed a MATLAB toolbox called DPARSF, which depends on using SPM [4], [5] and REST tool [6] for resting-state fMRI (rs-fMRI) data. These researchers performed classical preprocessing steps; reports could be generated to exclude subjects with the extreme movement of the head during the scan, and numerous fMRI images were created to verify the normalization effect easily [7]. Jonathan D Power et al. determined that subject motion without proper preprocessing can cause false cor-relations, but methodology correlations are established in fMRI networks [8]. The signal changes induced by motion increase observed resting-state functional connectivity [9]. Changwei W. Wu et al. conducted an empirical study on the effect of slice timing, smoothing, and normalization on seed-based rs-fMRI correlation analysis [10]. Ronald Saldky et al. evaluated the influence of the slice-timing effect on simu-lated data for different fMRI paradigms and measurement parameters and emphasized the significance of slice-timing correction methods [11]. Michael N Hallquist et al. found that exchanging nuisance regression and filtering in the prepro-cessing pipeline will produce different results [12]. William R. Shirer et al. aimed to identify the data-preprocessing pipeline that optimizes rs-fMRI data across multiple outcome measures, such as signal-to-noise ratio, test–retest reliabil-ity, and group discriminability [13]. Eklund et al. analyzed some rs-fMRI data of healthy controls through task-related statistical methods and found inflated false positive rates for cluster-wise inference using three processing packages [14]. Guillaume Flandin and Karl J. Friston emphasized the advan-tages of parametric analyses in their technical report [15]. Yunxiang Ge et al. introduced an evaluation study for a specific preprocessing pipeline of rs-fMRI data analysis; this evaluation study showed that fMRI data acquired using a scanner and a different protocol significantly affect statistical analysis [16]. Open-source tools, such as SPM, are available. These tools are based on the definition of step-by-step param-eters that also depend on the subject. These proceedings lead to increasing confusion for a user, with the possibility of increasing mistakes.
Therefore, an easy-to-use tool for a data analysis ‘‘pipeline’’ of fMRI will be necessary. A user-friendly tool-box called the APP DESIGNER conversion, preprocessing, and postprocessing of fMRI (CPREPP fMRI) tool is proposed and utilized in the current work. The CPREPP fMRI tool is a new toolbox that includes a complete analysis of fMRI data, starting from DICOM conversion, then checking the quality of data at each step, and ending in postprocessing analysis. The CPREPP fMRI tool provides the multiple conversion operations of all fMRI data formats (.dicm, .nii, .img, .hdr, and .mat format), which include 12 mathematical conversion processes that reflect all conversion possibilities among them. Specific preprocessing order steps are proposed on the basis of data acquisition mode (interleaved and sequential mode). These steps are preceded by two processes, namely, removing dummy scans and reorientation of fMRI images. These pro-cesses must be implemented after the fMRI data conversion
process. A serious and crucial comparison analysis between statistical parametric and nonparametric mapping approaches of the second-level analysis of fMRI data is presented in one tool. The CPREPP fMRI tool can provide reports to exclude subjects with the extreme movement of the head during the scan, and a range of fMRI images is generated to verify the normalization effect easily. The APP DESIGNER (CPREPP fMRI) tool is designed under the MATLAB plat-form and 64-bit Windows environment to serve the majority of the users. APP Designer is a substantial evolution envi-ronment that supplies layout planning, views of code, a fully incorporated version of MATLAB editor, and a vast extent of interactive components. Three tests, namely, smoothed variance pseudo t-test, t-test without smoothing through a permutation distribution with a single threshold test, and t-test using random field theory (RFT), are performed. Quantitative and qualitative comparisons of the corresponding parametric outcomes are performed.
The remainder of this paper is organized as follows: 1) The crucial issues in the methodology of fMRI analysis are presented in Section 2. 2) The specifics of preparing pipeline steps of fMRI data for postprocessing are discussed in Section 3. 3) The fMRI data used in this work are described in Section 4. 4) The architectural layout of the APP DESIGNER (CPREPP fMRI) tool and the design process are introduced in Section 5. Moreover, the contents and results of the proposed APP DESIGNER (CPREPP fMRI) tool with a multicomparison among different approaches of fMRI anal-ysis are demonstrated. 5) Finally, Section 6 provides the discussion and the conclusions drawn from this work.
II. METHODOLOGY AND TYPICAL FMRI WORKFLOW
Several approaches to statistical analysis of MRI data can be used, and parametric statistical methods, such as Z-, t-, and F-values, have been extensively utilized [17]–[20]. Parametric statistical methods are traditionally applied in fMRI to detect brain regions that are active with a definite degree of statistical significance. These parametric methods depend on various assumptions and possess two main disad-vantages. First, the observed data are assumed to be indepen-dent and Gaussian distributed; presumptions that are typically false are considered for fMRI data analysis. Second, the distribution of a statistical test can be deduced from the theory only for elementary linear detecting statistics [21]–[23]. Typi-cal experiments include a few numbers of subjects in addition to scans, which result in statistic images with noises and low degrees of freedom that is incompletely estimated by contin-uous random fields. The limitations described above can be overcome with nonparametric statistical approaches [24] and are utilized to test the significance of statistical images of acti-vation studies. Official presumptions are exchanged through a cost-accounting method. Only minimal suppositions are required for validity. The nonparametric permutation method presents a flexible and easy-to-use methodology for detecting the active area of fMRI data [25], [26]. The nonparamet-ric method that uses a locally pooled (smoothed) variance
estimation can perform the comparable statistical parametric mapping method. Thus, these nonparametric methods can be used to confirm the validity of minimally computationally expensive parametric methods.
In the current work, multipreprocessing steps have been performed before starting the statistical analysis. Reorientation is the first step of preprocessing fMRI data after discarding the first few scans (approximately 10 volumes). The second step is the realignment process, in which the first fMRI image is realigned through rigid-body transfor-mations, and then slice-timing correction is applied. The other steps, which are the coregistration to T1 images, struc-tural image segmentation process, normalization process to the standard Montreal Neurological Institute (MNI) space, and spatial smoothing process, are followed consequently. Finally, whitening transformation is applied to the smoothed fMRI data. The fMRI data undergo multipreprocessing steps as mentioned above. Afterward, statistical analysis is con-ducted in these data, and the results of test values are saved.
tvoxel denotes the values of the original test. Several steps
are implemented to apply nonparametric analysis to each permutation. These steps are presented as follows:
1) The random permutation test is applied to the whitened fMRI time points.
2) A new time series of fMRI is generated through reverse whitening transformation, that is, through the simula-tion model of AR for every voxel of fMRI time points. 3) The smoothing process is applied to all volumes
pro-duced by the inverse whitening transform.
4) Whitening transformation is applied to the smoothed fMRI data.
5) Statistical analysis is performed, and the maximum test value is determined and saved.
6) The corrected P value at each voxel is calculated as the maximum test value, t maxi, which is equal to or more
than the value of the original test at the voxel, tvoxel,
divided by the value of permutations, Np.
Pcvoxel= PNp
i=1(t maxi≥ tvoxel)
Np (1)
Studies of fMRI are extensively conducted by researchers and clinicians alike because they can provide unique insights into brain functions. Nevertheless, many technical aspects must be considered and treated to improve fMRI analysis and achieve an accurate interpretation of the statistical analysis results of fMRI data. These technical aspects include typical model design details of artifacts of fMRI images, the definition of the complicated protocol, numerous processing and analysis approaches, and fundamental methodological imperfections. Several reviews, such as articles and books, have already discussed the essential fMRI design concepts [27]–[30]. The experimental designs used are resting state and task-based. The acquired data (raw data, DICOM) contain imperfections and artifacts due to subject movement, spontaneous neural activities, and intrinsic electron thermal noises. Therefore,
a certain degree of preprocessing analysis includes conver-sion data, and denoising steps must be performed before analyzing the fMRI. The preprocessing of fMRI data is imple-mented step by step, and the preprocessing pipeline is formed. No consensus currently exists on the steps that must be performed in the preprocessing stage or on selecting param-eters in those steps. Preprocessing poses numerous effects on BOLD fMRI data, and many studies have been per-formed on this issue [1], [2]. Stephen C Strother, for exam-ple, analyzed common preprocessing steps for BOLD fMRI and their possible influences [3]. Yan Chao-Gan and Zang Yu-Feng developed a MATLAB toolbox called DPARSF, which depends on using SPM [5], [7] and REST tool for rs-fMRI data [6].
Clinicians and researchers are required to understand the primary fMRI study application fields, such as the char-acteristics of fundamental hemodynamics and the design of the optimal experiment, to conduct the most acceptable study regardless of whether this fMRI study is based on tasks or resting state. Determining the most suitable acqui-sition techniques and identifying the essential artifacts con-cerned are necessary.
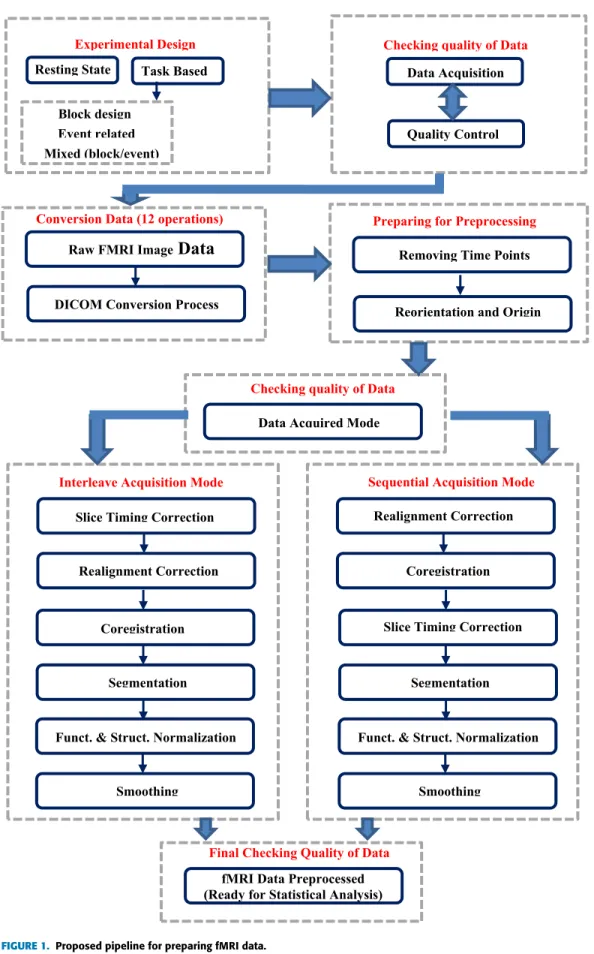
The acquired data are then subjected to several steps for quality control and preprocessing steps as mentioned before. These steps are called the quality control of acquisition, starting from the conversion of format data to the last level in the preprocessing steps. The methods of intended analysis for fMRI must be performed whether for resting state or task-based, and then statistical conclusions are obtained. The flowchart of the fMRI workflow is designed and illustrated in Fig. 1. The diagram shows and describes all pipeline steps to prepare fMRI data. Real fMRI data are first collected from the UMRAM Center. The acquired data are subjected to several steps for quality control and preprocessing steps. Statistical inferences are performed and discussed in the fol-lowing sections.
III. PREPARING PIPELINE STEPS OF FMRI DATA FOR POSTPROCESSING
This section describes the pipeline steps of the procedures applied to fMRI data before their statistical analysis. The fMRI data are first converted from raw data for-mat (DICOM) to much simpler forfor-mats, such as NIfTI (.nii or .nii.gz) or ANALYZES (.img/.hdr), which can be utilized by the analysis software. Suggested pipeline steps of preprocessing are then applied for preparing fMRI data to be ready for statistical analysis. On the basis of our experience and review of considerable literature on preparing fMRI data for statistical analysis, the crucial summaries and suggestions of fMRI preparing pipeline steps are proposed in this work as illustrated in Fig. 1.
The main contribution of this work is that multiple con-version processes for all fMRI data formats are proposed and tested successfully in the National Magnetic Resonance Research Center (UMRAM) in Ankara, Turkey. Therefore, no literature review on any software packages contain all
TABLE 1. Details of real fMRI data acquisition.
conversion processes, such as the present work. A total of 12 conversion processes of fMRI data format are per-formed in this work. Multiple conversion processes are pro-posed and presented in the first part of preparing fMRI data. After converting fMRI data to simpler NIfTI or ANALYZES format, two steps must be performed before the preprocessing stage, that is, removing dummy scan during stabilization of the signal and reorientation and tracing the origin of the fMRI data. Multipreprocessing steps are finally applied to the fMRI data, as depicted in Fig. 1. The order and choice of preprocessing steps are based on the mode of fMRI data acquired. Therefore, if fMRI data are obtained by an inter-leaved mode, then the order of pipeline steps of preprocessing is presented as follows:
• Slice time correction
• Realignment
• Coregistration of mean EPI image with anatomical
ones (T13D)
• Segmentation of the structural image
• Normalization of functional and structural images
• Smoothing
If fMRI data are acquired by sequential mode, then the steps will be in the following order:
• Realignment
• Coregistration of mean EPI image with anatomical
ones (T13D) • Slice time correction
• Segmentation of the structural image
• Normalization of functional and structural images
• Smoothing
IV. FMRI DATASET
Real and free fMRI data are used in this work. Original fMRI data are classified into three groups, namely, night, healthy control, and all-day groups. The night group con-sists of 10 subjects, and the healthy control group also has 10 subjects. The all-day group comprises 11 subjects. The experimental tests are chewing and biting. Table 1 sum-marizes the details of real fMRI data acquisition. The data are acquired using an MRI scanner-type Siemens/3T in the National Magnetic Resonance Research Center (UMRAM)
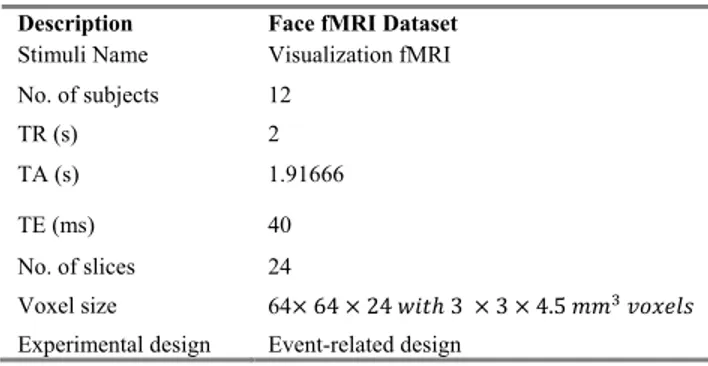
TABLE 2.Details of free-face fMRI data acquisition.
in Ankara, Turkey. The free-face fMRI dataset used in this work is called multisubject event-related fMRI repetition priming for comparison among the methods for fMRI tests. The open-face fMRI dataset is available on the SPM website; the data are gained from the effects of face repetition in explicit and implicit memory tests. Table 2 lists the details of real fMRI data acquisition. The data of each subject are analyzed to generate the variation images between baseline and face watching. Consequently, each image represents an image of contrast for every subject.
V. ARCHITECTURE AND RESULTS USING THE APP DESIGNER (CPREPP FMRI) TOOL
The APP DESIGNER CPREPP fMRI tool consists of the following three main parts: (1) conversion modalities and preprocessing analysis of fMRI data (Fig. 2), (2) statistical parametric mapping analysis (Fig. 3), and (3) nonparametric mapping analysis (Fig. 4). The CPREPP fMRI tool is a user-friendly program, and pop-up tips report to users tasks when they click the buttons. This tool is evolved in a MATLAB environment and designed depending on the new MATLAB technology called APP Designer. The APP Designer is a pro-ductive evolving environment that supplies design and code views, a well-incorporated version of MATLAB editor, and numerous interactive elements. The CPREPP fMRI toolbox is designed to present a severe and crucial comparison analysis in one tool. This comparison is performed in the CPREPP fMRI toolbox between the statistical parametric and nonpara-metric mapping of second-level analysis of fMRI data. This toolbox provides multiple conversion operations of all fMRI data formats (.dicm, .nii, .img, .hdr, and .mat formats) and specific preprocessing order steps proposed based on the data acquisition mode (interleaved and sequential modes).
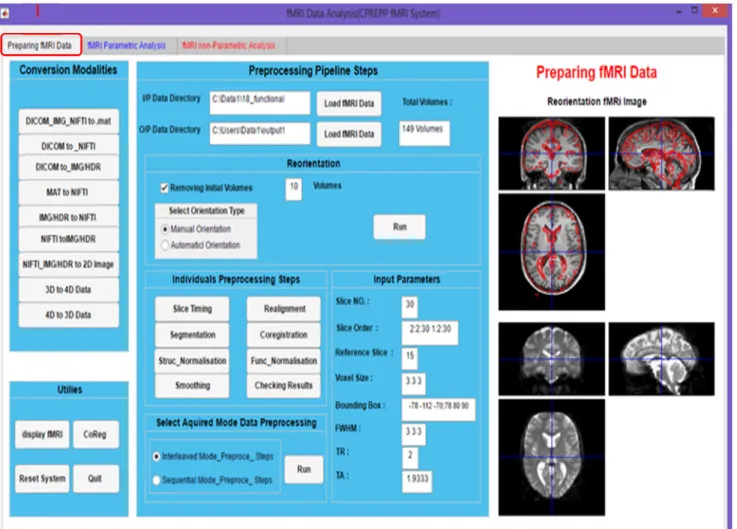
The first part of the current tool is the conversion and preprocessing of fMRI analysis. This part consists of three components: namely, conversion modalities; preparing fMRI data for preprocessing pipeline steps, which include removing dummy scans and reorientation and tracing the origin of fMRI data; and applying multipreprocessing steps on fMRI data.
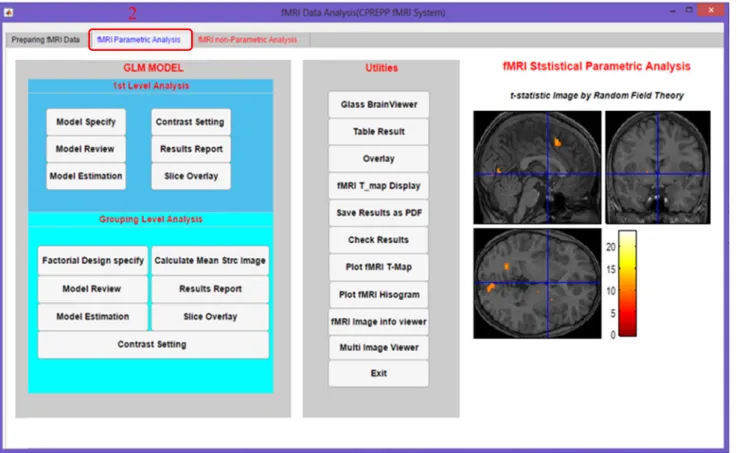
The second part of the current tool is fMRI statisti-cal parametric mapping analysis, which is divided into
FIGURE 2. Main window of preparing fMRI data analysis.
two components of grouping level analysis. Each level is divided into three steps, namely, (1) setup procedure of a design matrix, (2) computation design matrix, and (3) results and inference of analysis.
The same structure of steps and sequence are applied through statistical nonparametric mapping analysis in con-sideration of the differences between the two approaches. Although both methods exist in the proposed toolbox, our conclusion in this work uses and reuses the statistical non-parametric mapping analysis, especially in the multisubject analysis based on the results that will be presented in the following subsections.
The results of this work are discussed below. A. CONVERSION MODALITIES
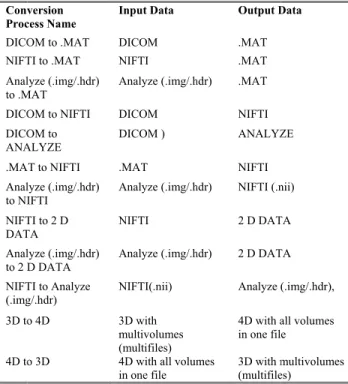
The first section of the CPREPP fMRI tool provides the mul-tiple conversion operations of all fMRI data formats (.dicm, .nii, .img, .hdr, and .mat format), as displayed in Table 3. This section includes nine push buttons to perform 12 mathemati-cal conversion processes that reflect all conversion possibili-ties among them, as exhibited in Fig. 5.
For example, when a user clicks the ‘‘DICOM_IMG_NIFTI to .mat Conversion’’ button, the .mat conversion image
conversion window appears. From the pop-up menu, the user can select one of the three types of fMRI data (.dcm, .nii, and .img/hdr). After appropriate selections, the dataset is loaded, and the header of this file is read and converted into the .mat format.
Another example is that clicks on the ‘‘NIFTI_ img/hdr to 2D Image Conversion’’ button enable users to convert fMRI data formats (NIFTI and Analyze) into a 2D image format. This conversion is different from the abovementioned conversion processes because the output results appear as a 2D format file.
B. PIPELINE PREPROCESSING STEPS
The CPREPP fMRI tool provides comprehensive pipeline preprocessing steps. This tool starts by loading fMRI data and then determines the output directory that all output results will be saved automatically in it. Individual preprocessing is performed, and the checking result button is provided to check the achievement of each step. Another way to perform preprocessing of fMRI data is provided with the current tool, which includes interleaved and sequential mode preprocess-ing steps.
FIGURE 3. Main window of fMRI statistical parametric analysis.
FIGURE 4. Main window of fMRI statistical nonparametric analysis.
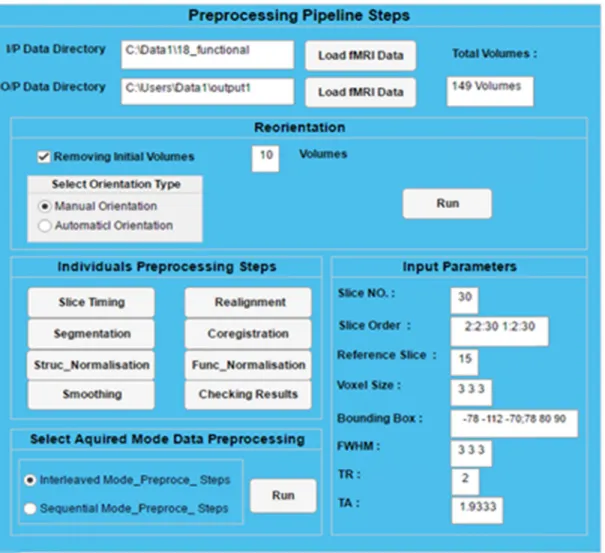
1) REMOVING INITIAL SCAN AND REORIENTATION
Discarding the first few scans is recommended and proposed as the first step in the preprocessing order steps to avoid
T1 effects on the initial scans of fMRI time series. The number of dummy scans (at least 10 scans) and checkbox must be determined, as illustrated in Fig. 6. After removing
FIGURE 5. Conversion modalities of fMRI data.
TABLE 3. List of 12 conversion processes of fMRI data formats.
the initial scan (under instability period of MRI machine), the reorientation step must be performed. Manual and auto-matic reorientations are provided in the current tool. The first manual reorientation is achieved by applying displacements (x, y, and z) and rotations (pitch, roll, and yaw) to functional
TABLE 4.Description of input and output data for each preprocessing step.
and structural scans approximately aligned to each other by adjusting displacements and rotations manually and to a canonical MNI template. Automatic reorientation is also provided in this tool. However, if the images are considerably far from the canonical image, the automated procedure can probably fail.
2) SLICE TIMING CORRECTION
The slice time function corrects differences in slice acquisi-tion times. This routine is intended to correct for the staggered order of slice acquisition that is used during echo-planar scanning. The correction is necessary to make the data on each slice correspond to the same point in time. This step is vital for rapid event-related paradigms; otherwise, it can be safely bypassed. In this step, fMRI data are fed to this function as input data, and repetition time (TR), acquisition time (TA), and the order of slices and reference slices are required, as depicted in Fig. 6. The output images after this step are started with a letter.
FIGURE 6. Pipeline of preprocessing steps of fMRI data.
3) REALIGNMENT
This preprocessing step consists of detecting and possibly correcting the motion of the subject during the scanning session. This routine realigns a time series of images acquired from the same subject using a least squares approach and a six-parameter (rigid body) spatial transformation. The head-ers are reformed for each input image, and fMRI data are fed to this function as input data. Furthermore, the output images consist of one mean image, realigned images, and a text file with a set of realignment parameters for each session.
4) COREGISTRATION
Coregistration is used to align functional images (mean EPI) with the anatomical (structural) MRI images (T1 3D) of the same subject. This process is based on using different cost functions, which are called mutual information. The deforma-tion of EPI images is disregarded. The input data in this step are mean EPI (reference image) and structural image (source image), and only the header of the structural image is changed to reflect the new realignment with the mean EPI.
5) SEGMENTATION
Segmentation can be used to separate gray matter (GM), white matter (WM), and cerebral spinal fluid (CSF) in anatomical scans. A coregister anatomical image is fed to this function as input data, and the output images consist of GM, WM, CSF, bias-corrected, and deformation images. All instructions for spatial normalization are put in a .mat file, and all output images are generated in a structural folder.
6) NORMALIZATION (FUNCTIONAL AND STRUCTURAL) The normalization function is used to put scans into the standardized MNI templates, which are based on averages of many MRI scans of healthy young adults, AC–PC aligned, and scaled to one another. Similar to the realignment function, the normalization function determines the transformation and reduces the variation through two scans by reducing the aggregate square intensity variations. In addition to rotation and translation, the transformation of a rigid body is allowed in the coregistration and realignment. Normalization utilizes shears and zooms; this condition means a complete affine
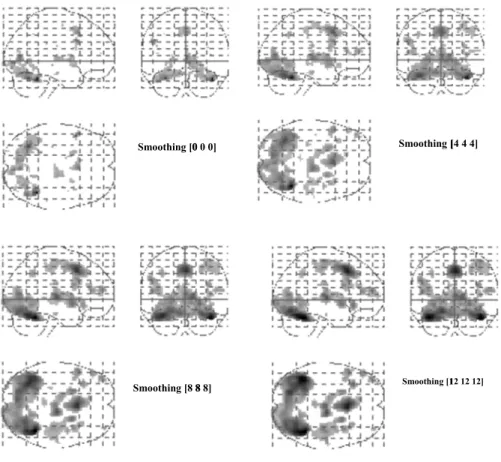
FIGURE 7. MIP results of Several values (0,4, 8, and 12 mm FWHM) of the smoothing of variance.
transformation and nonlinear deformation, thereby allowing for accurate correction of structural variations among sub-jects. The normalization step is performed for functional and anatomical images. For the former, the realigned functional and deformation images are required as input data to the normalization process of functional images. Bias-corrected and deformation images are required as input data for the normalization process of structural images.
7) SMOOTHING
Averaging values of neighbor voxels for minimal noise and small intersubject variability and the smooth function is applied as the last stage in the spatial preprocessing to blur the fMRI images. The goal is to correct the small remain-ing structural and functional variations among subjects. The normalized functional images are required as input data for the smoothing function, and the weighting is defined by a Gaussian kernel with a 7 or 8 mm (full width at half maxi-mum, FWHM) size.
8) INTERLEAVED MODE PREPROCESSING STEPS
When fMRI data are acquired by an interleaved mode, the order of pipeline steps of preprocessing is presented as follows: slice time correction, realignment, coregistration of a mean EPI image with anatomical ones (T13D), seg-mentation of a structural image, normalization of functional
and structural images, and smoothing. The interleaved mode preprocessing steps include all the order steps above automat-ically in only one click by designing a model based on batch editor script; therefore, the user can set and change any value of parameters.
9) SEQUENTIAL MODE PREPROCESSING STEPS
When fMRI data are acquired by a sequential mode, the steps will be in the following order: realignment, coregistration of a mean EPI image with anatomical ones (T13D), slice time correction, segmentation of a structural image, normalization process of functional and structural images, and smoothing. The sequential mode preprocessing steps also perform all the order steps above automatically in only one click by design-ing a model based on batch editor script. Therefore, the user can set and change any value of parameters. Table 4 presents the preprocessing steps with input and output data for each level with the assumption that the name of the fMRI data input is fMRI.
C. POSTPROCESSING ANALYSIS
In this section, a serious and crucial comparison analysis between statistical parametric and nonparametric mapping approaches is presented in one tool. The free-face fMRI dataset is called multisubject event-related and is discussed as follows.
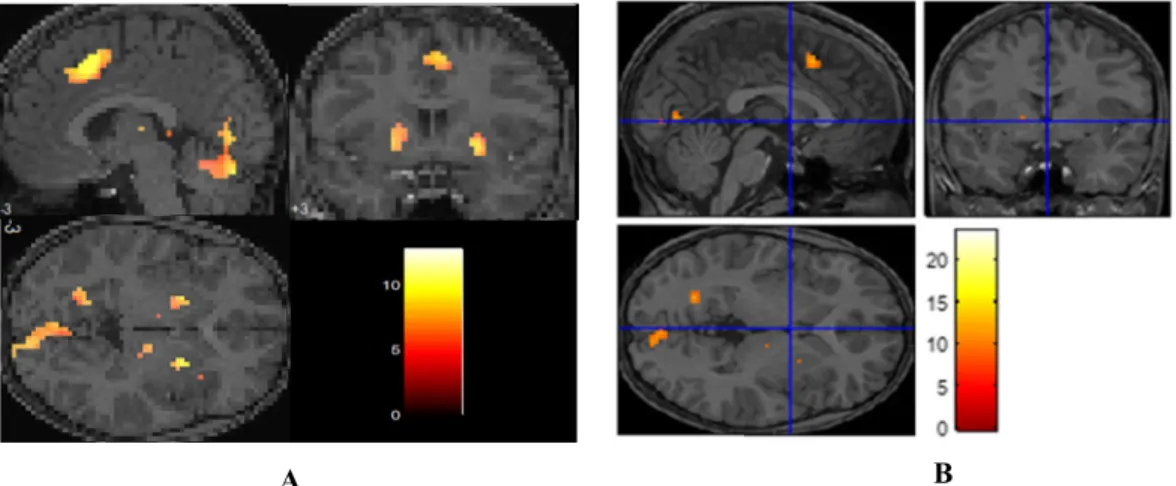
FIGURE 8. Multisubject fMRI images for the two approaches are applied with pseudo t-statistic nonparametric-random permutation test and RFT. (A) Applying a pseudo t-statistic test (with smoothing) to multisubject fMRI images. (B) Applying t-statistic based on RFT to multisubject fMRI images.
For the multisubject fMRI experiment, a permutation test is performed to conclude a population in comparison with a randomized trial. A pseudo t-statistic of the smoothed vari-ance is used with a one-threshold experiment in this work. Quantitative and qualitative comparisons of the correspond-ing parametric outcomes are also performed. This analysis amounts to a one-sample t-test on first-level images by testing for a zero-mean effect across subjects. A pseudo-t-test is applied because only 11 degrees of freedom exist in this work. Four values (0,4, 8, and 12 mm FWHM) of the smoothing of variance are applied as depicted in Fig. 7 These values are compared with the mean values within the smoothing of subjects. Based on our expertise and results, applying any smoothing of variation is more important than the values (FWHM) of the smoothing process, although four magni-tudes (0,4, 8, and 12 mm FWHM) are used in this work. The examination around the entire brain is conducted in the present practice to investigate considerable changes; there-fore, the maximum pseudo t is used. The sign of several or all data of subjects is flipped in this work based on the exchange-ability concept with a null hypothesis. Here, 212=4096 pos-sible ways are available to set either ‘‘−1’’ or ‘‘+1’’ for each subject.
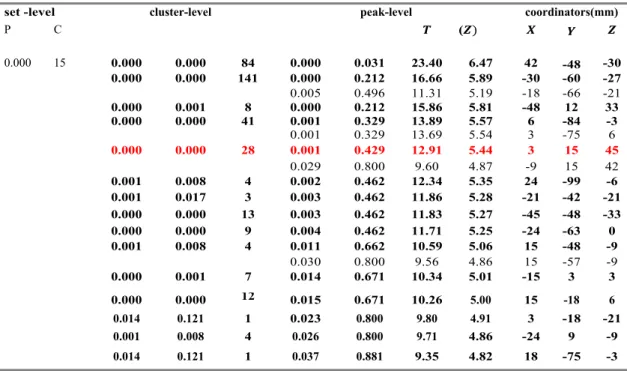
Fig. 8A depicts the overlay multisubject fMRI images of significant voxels by using pseudo-t permutation test. The anterior cingulate activation at coordinates (3, 15, and 45) is 402 voxels with a nonparametric pseudo-t permutation test. In Fig. 8B, 28 voxels are located at the anterior cingulate with the parametric t-test based on RFT.
However, variation in brain activities is revealed in sev-eral ways throughout the current tools, such as patches of color on an fMRI brain section, slice, and montage overlay, with the colors that demonstrate the position of the voxels that illustrate statistically significant variances among condi-tions. The variations in activities may also be embodied as a glass brain or a maximum intensity projection, which is a demonstration of three views of the brain diagram as if it
was transparent. Activation patches appear only as shading areas or in different colors. This feature is useful in rapidly summarizing the total area of essential changes in a specific statistical comparison.
The nonparametric mapping threshold (5.09) using the
pseudo-tpermutation test when 8 mm smoothing is applied is lower than the classical parametric threshold (9.07) based on random field approaches. Consequently, the nonparametric
pseudo-tpermutation test shows active voxels, as illustrated in Fig. 8A. The suprathreshold voxels are observed using nonparametric pseudo-t permutation test more than those using the standard parametric analysis, and the fMRI images are smooth. For example, the anterior cingulate activation at coordinates (3, 15, and 45) is 402 voxels in the nonparametric
pseudo-tpermutation test, while it is 28 voxels in the classical parametric t-test (shown in Table 5 & 6).
The above Tables (5 & 6) are a result of one of the fea-tures results of postprocessing analysis in both parametric and nonparametric analysis that provides a comprehensive explanation of how many clusters tin each result, as well as a number of a voxel in a cluster of activation area with each of the corresponding coordinates.
VI. DISCUSSION
The main contribution of this work is that multiple conversion processes for all fMRI data formats are proposed and tested successfully in our lab. Specific preprocessing order steps are recommended on the basis of data acquisition mode (inter-leaved and sequential mode). These steps are preceded by two processes, namely, removing dummy scans and reorientation of fMRI images, which must be implemented after the fMRI data conversion process. A serious and crucial comparison analysis between statistical parametric and nonparametric mapping approaches is presented in one tool. No literature review has any software packages that contain all analysis of fMRI data similar to our work; a total of 12 conversion processes of fMRI data format are performed in the current
TABLE 5. Statistical report of the non-parametric pseudo-t permutation test.
TABLE 6. Statistical report of parametric pseudo-t t- statistic by a random field theory test.
practice. Therefore, multiple conversion processes are pro-posed and shown in the first part of preparing fMRI data.
VII. CONCLUSION
Working with raw fMRI data (DICOM) is complex, and these data have many artifacts. Preparing fMRI data is cru-cial and is considered the initial step before implementing the statistical analysis. However, a specific and user-friendly tool for developing fMRI data for postprocessing remains lacking. Consequently, a software tool (CPREPP fMRI) is designed to have a collection of algorithms that satisfy parametric and nonparametric approaches. This toolbox is designed and implemented under the MATLAB platform and 64-bit Windows environment based on the new technology in
MATLAB called APP Designer. CPREPP fMRI is designed and developed to address many problems in DICOM conver-sion and removing artifacts in the fMRI signal. The integra-tion of multiconversion processes of multiform at fMRI data is an essential and first step to prepare fMRI data for statistical analysis.
The preprocessing pipeline in this work is performed in two ways, namely, selecting individual preprocessing steps sepa-rately (select optional state) and selecting one of two models that are suggested in this work (interleaved and sequential modes). The preprocessing models include all preprocessing steps but are performed automatically by clicking the model button; then, all levels are automatically performed step by step. The user’s duty is to enter data at the beginning.
The package provides the following main features: 1) Conversion tools for fMRI modalities
2) Conversion of fMRI raw data into a friendly and straightforward format, such as Analyze, NIFTI, and .mat formats
3) CPREPP fMRI package that can view diverse fMRI image formats, such as Analyze, NIFTI, .mat, and 4D formats
4) Creation of 2D fMRI data
5) Exporting images to the MATLAB format
6) Reading/writing and viewing of all fMRI data formats 7) Reference and base tools, especially for physicians, healthcare specialists, and researchers who face chal-lenges on handling these types of data
8) User-friendly comprehensive neuroscience tools that contain all fMRI data format (DICOM, ANALYZE, NIFTI, and MAT) conversion modalities
9) Easy and straightforward tools for preprocessing pipeline steps
10) Crucial comparative analyses between statistical para-metric and nonparapara-metric mapping approaches This work is comprehensive and has vital significance, espe-cially for physicians in the neuroscience area, healthcare specialists, engineers, and researchers who face challenges in handling these types of data. This toolbox supports the useful application of these nonparametric methods with multiple features to assist neuroscience researchers.
REFERENCES
[1] S. Pamilo, ‘‘New approaches to statistical analysis of fMRI data,’’ Dept. Neurosci. Biomed. Eng.-School Sci., Helsinki, Finland, Tech. Rep., 2015. [2] F. G. Ashby, Statistical Analysis of fMRI Data. Cambridge, MA, USA:
MIT Press, 2011.
[3] S. C. Strother, ‘‘Evaluating fMRI preprocessing pipelines,’’ IEEE Eng.
Med. Biol. Mag., vol. 25, no. 2, pp. 27–41, Mar. 2006.
[4] W. D. Penny, K. J. Friston, J. T. Ashburner, S. J. Kiebel, and T. E. Nichols,
Statistical Parametric Mapping: The Analysis of Functional Brain Images. New York, NY, USA: Academic, 2007.
[5] J. Ashburner, ‘‘SPM: A history,’’ NeuroImage, vol. 62, no. 2, pp. 791–800, 2012.
[6] X.-W. Song, Z. Y. Dong, X. Y. Long, S. F. Li, X. N. Zuo, and C. Z. Zhu, ‘‘REST: A toolkit for resting-state functional magnetic resonance imaging data processing,’’ PLoS ONE, vol. 6, no. 9, Sep. 2011, Art. no. e25031. [7] Y. Yan and Y. Zang, ‘‘DPARSF: A MATLAB toolbox for ‘pipeline’ data
analysis of resting-state fMRI,’’ Frontiers Syst. Neurosci., vol. 4, p. 13, May 2010.
[8] J. D. Power, K. A. Barnes, A. Z. Snyder, B. L. Schlaggar, and S. E. Petersen, ‘‘Spurious but systematic correlations in functional connectivity MRI networks arise from subject motion,’’ NeuroImage, vol. 59, no. 3, pp. 2142–2154, Feb. 2012.
[9] J. D. Power, A. Mitra, T. O. Laumann, A. Z. Snyder, B. L. Schlaggar, and S. E. Petersen, ‘‘Methods to detect, characterize, and remove motion arti-fact in resting state fMRI,’’ NeuroImage, vol. 84, pp. 320–341, Jan. 2014. [10] C. W. Wu, C.-L. Chen, P.-Y. Liu, Y.-P. Chao, B. B. Biswal, and C.-P. Lin, ‘‘Empirical evaluations of slice-timing, smoothing, and nor-malization effects in seed-based, resting-state functional magnetic reso-nance imaging analyses,’’ Brain Connectivity, vol. 1, no. 5, pp. 401–410, Dec. 2011.
[11] R. Sladky, K. J. Friston, J. Tröstl, R. Cunnington, E. Moser, and C. Windis-chberger, ‘‘Slice-timing effects and their correction in functional MRI,’’
NeuroImage, vol. 58, no. 2, pp. 588–594, Sep. 2011.
[12] M. N. Hallquist, K. Hwang, and B. Luna, ‘‘The nuisance of nuisance regression: Spectral misspecification in a common approach to resting-state fMRI preprocessing reintroduces noise and obscures functional con-nectivity,’’ NeuroImage, vol. 82, pp. 208–225, Nov. 2013.
[13] W. R. Shirer, H. Jiang, C. M. Price, B. Ng, and M. D. Greicius, ‘‘Opti-mization of rs-fMRI pre-processing for enhanced signal-noise separation, test-retest reliability, and group discrimination,’’ NeuroImage, vol. 117, pp. 67–79, Aug. 2015.
[14] A. Eklund, T. E. Nichols, and H. Knutsson, ‘‘Cluster failure: Why fMRI inferences for spatial extent have inflated false-positive rates,’’ Proc. Nat.
Acad. Sci. USA, vol. 113, no. 28, pp. 7900–7905, Jul. 2016.
[15] G. Flandin and K. J. Friston, ‘‘Analysis of family-wise error rates in statistical parametric mapping using random field theory,’’ Hum. Brain
Mapping, vol. 40, no. 7, pp. 2052–2054, Nov. 2017.
[16] Y. Ge, Y. Pan, and W. Dou, ‘‘Analysis of BOLD fMRI signal preprocessing pipeline on different datasets while reducing false positive rates,’’ in Proc.
Int. Conf. Biol. Inf. Biomed. Eng. (BIBE), Dec. 2017, pp. 1–8.
[17] K. J. Friston, C. D. Frith, P. F. Liddle, and R. S. J. Frackowiak, ‘‘Comparing functional (PET) images: The assessment of significant change,’’ J. Cereb.
Blood Flow Metabolism, vol. 11, no. 4, pp. 690–699, Jul. 1991. [18] K. J. Friston, A. P. Holmes, J.-B. Poline, P. J. Grasby, S. C. R. Williams,
R. S. J. Frackowiak, and R. Turner, ‘‘Analysis of fMRI time-series revis-ited,’’ NeuroImage, vol. 2, no. 1, pp. 45–53, Mar. 1995.
[19] K. J. Worsley, A. C. Evans, S. Marrett, and P. Neelin, ‘‘A three-dimensional statistical analysis for CBF activation studies in human brain,’’ J. Cerebral
Blood Flow Metabolism, vol. 12, no. 6, pp. 900–918, Nov. 1992. [20] K. J. Worsley and K. J. Friston, ‘‘Analysis of fMRI time-series revisited—
Again,’’ NeuroImage, vol. 2, no. 3, pp. 173–181, Sep. 1995.
[21] S. Arndt, T. Cizadlo, N. C. Andreasen, G. Zeien, G. Harris, D. S. O’Leary, G. L. Watkins, L. L. Ponto, and R. D. Hichwa, ‘‘A comparison of approaches to the statistical analysis of [15O]H2O PET cognitive activation studies,’’ J. Neuropsychiatry Clin. Neurosci., vol. 7, no. 2, pp. 155–168, May 1995.
[22] E. Zarahn, G. K. Aguirre, and M. D’Esposito, ‘‘Empirical analyses of BOLD fMRI statistics. I. Spatially unsmoothed data collected under null-hypothesis conditions,’’ NeuroImage, vol. 5, no. 3, pp. 179–197, Apr. 1997. [23] P. L. Purdon and R. M. Weisskoff, ‘‘Effect of temporal autocorrelation due to physiological noise and stimulus paradigm on voxel-level false-positive rates in fMRI,’’ Hum. Brain Mapp., vol. 6, no. 4, pp. 239–249, 1998. [24] S. Siegel, ‘‘Nonparametric Statistics,’’ Amer. Stat., vol. 11, no. 3,
pp. 13–19, Jun. 1957.
[25] A. P. Holmes, R. C. Blair, J. D. Watson, and I. Ford, ‘‘Nonparametric anal-ysis of statistic images from functional mapping experiments,’’ J. Cerebral
Blood Flow Metabolism, vol. 16, no. 1, pp. 7–22, Jan. 1996.
[26] S. Arndt, T. Cizadlo, N. C. Andreasen, D. Heckel, S. Gold, and D. S. O’Leary, ‘‘Tests for comparing images based on randomization and permutation methods,’’ J. Cerebral Blood Flow Metabolism, vol. 16, no. 6, pp. 1271–1279, Nov. 1996.
[27] E. Amaro, Jr., and G. J. Barker, ‘‘Study design in fMRI: Basic principles,’’
Brain Cogn., vol. 60, pp. 220–232, 2006.
[28] M. Filippi, fMRI Techniques and Protocols, vol. 41. Totowa, NJ, USA: Humana Press, 2009.
[29] C. M. Bennett and M. B. Miller, ‘‘fMRI reliability: Influences of task and experimental design,’’ Cogn., Affect., Behav. Neurosci., vol. 13, no. 4, pp. 690–702, Dec. 2013.
[30] B. Maus and G. J. P. van Breukelen, ‘‘Optimal design for functional magnetic resonance imaging experiments: Methodology, challenges, and future perspectives,’’ Zeitschrift Psychol., vol. 221, no. 3, pp. 174–189, Jan. 2013.
HUSSAIN A. JABER received the B.S. degree from the University of Technology, Baghdad, Iraq, in 1997, and the M.Sc. degree from Ankara Yıldırım Beyazıt University, Ankara, Turkey, in 2015, both in electrical and electronic engi-neering. He is currently pursuing the Ph.D. degree with the Electrical and Electronics Engineering Department, Graduate School of Natural Science, Ankara Yıldırım Beyazıt University, Turkey. He is also a Research and Development Specialist with the National Magnetic Resonance Research Center (UMRAM). He has over 19 years’ experience in the biomedical area. He has many publications in the field of biomedical engineering. His research interests include connec-tion networks over funcconnec-tional (fMRI, ASL, EEG, and MEG) and struc-tural (diffusion-weighted MRI) data, biomedical signal processing, medical devices, medical imaging, data mining, clustering techniques, machine learn-ing, MATLAB, and ASP.NET programming.
HADEEL K. ALJOBOURI received the B.S. degree in biomedical engineering from the Univer-sity of Baghdad, Baghdad, Iraq, in 2000, the M.Sc. degree in medical engineering from Al-Nahrain University, Baghdad, in 2004, and the Ph.D. degree with the Electrical and Electronics Engineering Department, Graduate School of Natural Science, Ankara Yıldırım Beyazıt University, Turkey. She was an Academic Staff with the Biomedical Engi-neering Department, Al-Nahrain University. She has many publications in the field of biomedical engineering. Her research interests include biomedical signal processing, medical imaging, data min-ing, clustering techniques, and machine learning. Her particular attention focuses on functional MRI.
İLYAS ÇANKAYA received the B.S. degree in elec-tronic engineering from Gazi University, Ankara, Turkey, in 1990, and the Ph.D. degree in elec-tronic and computer from Sussex University, U.K., in 1998. He is currently a Professor with the Electrical and Electronics Engineering Depart-ment, Ankara Yıldırım Beyazıt University, Turkey. He is involved in nonlinear dynamics, nonlinear frequency response analysis, and applications of biomedical engineering. He has two books and more than 60 publications.
ORHAN M. KOÇAK is a Medical Doctor, and cur-rently a Psychiatric and an Academic Staff (Pro-fessor) with the Psychiatry Department, School of Medicine, Kırıkkale University, Kırıkkale, Turkey. His researches have been published in high-level academic journals. His research interest includes functional neuroimaging.
OKTAY ALGIN is currently a Radiologist with City Hospital and an Academic Staff with the Department of Radiology, Ankara Yıldırım Beyazıt University, and the National MR Research Center, Bilkent University, Ankara, Turkey. He has authored or coauthored well over 100 articles (SCI or SCI-expanded) and has 30 international presentations and 1348 citations (h-index: 21). His researches have been published in high-level aca-demic journals, including AJNR, BJR, AJR, JCAT,
Neuroradiology, and Magnetic Resonance in Medicine. His clinical interests include functional MRI and three tesla-MR imaging. His research interests include CSF disorders, imaging/intervention of brain aneurysms, and inter-ventional MRI.