See discussions, stats, and author profiles for this publication at: https://www.researchgate.net/publication/261727268
Predicting Chemotherapy Sensitivity Profiles for
Breast Cancer Cell Lines with and Without Stem
Cell-Like Features
Article in Current Signal Transduction Therapy · December 2013 DOI: 10.2174/1574362409666140206222115 CITATION1
READS81
3 authors: Some of the authors of this publication are also working on these related projects: Epigenetic Regulation of CT genesView project TRIB2 confers resistance to anti-cancer therapy by activating the serine/threonine protein kinase AKT View project Murat İşbilen PHI-Tech Bioinformatics 13 PUBLICATIONS 5 CITATIONS SEE PROFILE Kerem Mert Şenses Senses Biotechnology 6 PUBLICATIONS 7 CITATIONS SEE PROFILE Ali Osmay Gure Bilkent University 120 PUBLICATIONS 5,916 CITATIONS SEE PROFILE
All content following this page was uploaded by Ali Osmay Gure on 22 April 2014.
268 Current Signal Transduction Therapy, 2013, 8, 268-273
Predicting Chemotherapy Sensitivity Profiles for Breast Cancer Cell Lines
with and Without Stem Cell-Like Features
Murat Isbilen, Kerem Mert Senses and Ali Osmay Gure
*Bilkent University, Department of Molecular Biology and Genetics, Ankara, Turkey 06800
Abstract: Our current understanding of cancer-stem cells (CSCs) is that they are slow growing, generally
mesenchymal-like cells capable of generating tumors. Convincing evidence for the existence of such cells comes from recent lineage tracing experiments. CSCs have been reported as being resistant to conventional drug treatment and have been considered as being responsible for failure of chemotherapy. Recently, several databases aiming the genetic characterization of a large number of cancer cell lines have been made publicly available. In addition to gene expression data, these databases contain cytotoxicity information for all cell lines for a number of drugs as well. It is possible to classify known cell lines derived from a given tumor, based on how similar they are to CSCs, or in other words, to define their stem-ness, using gene-lists that define such cells. Using two such, independently generated, gene lists we found that breast cancer cell lines could be categorized into two distinct groups which we designate CSC-like and non-CSC-like. We then identified drugs to which the two groups were most sensitive to. We also generated sensitivity profiles for all drugs, within one such database, to identify chemotherapeutics with preferential action on breast cancer. We believe this is a straight-forward approach for swiftly identifying drugs that would selectively target a subpopulation of cells for any given tumor type.
Graphical Abstract
Keywords: Cancer, cancer stem cells, chemotherapy, cytotoxicity, database mining, lapatinib, LBW242, TKI258.
INTRODUCTION
Despite decades of work, cancer remains mostly an incurable disease. One reason for drug resistance in cancer has been proposed to stem from the fact that tumors contain cancer stem cells (CSCs) that can resist therapy. Recently, several papers have clearly documented the presence of CSCs using lineage tracing [1]. However, markers by which such cells can be reproducibly identified in tumors has been difficult due to the fact that tumors show vast heterogeneity [2]. Nevertheless, many ongoing studies aim to identify agents that can target cancer stem cells, as it is agreed that such cells are difficult to kill using conventional drugs. A recent COST action (CM1106) made its priority to characterize such drugs and many other studies have been or are being
*Address correspondence to this author at the Bilkent University, Department of Molecular Biology and Genetics, Ankara, Turkey 06800; Tel: +90-312-290-2507; Facsimile: +90-312-266-509; E-mail: [email protected]
conducted with the same purpose. The logic behind these is that cells defined by either a marker or a behavior should be tested for drug sensitivity. However, as we show in this study, in cases where a gene expression profile for a CSC-like cell is available, it is possible to use this signature to classify commonly used cancer cell lines into CSC-like and non-CSC-like populations. This information can then be used to identify drugs that affect either population better than the other, and thus predict drugs with preferential action on both CSC-like and non-CSC-like cells. We believe annotating drugs for both populations is critical in that there is building evidence that either group can cause cancer mortality, due to the phenotypic plasticity allowing transition between phenotypes. An extremely useful source for this purpose is the drug cytotoxicity data provided within the Cancer Cell Line Encyclopedia (CCLE) project [3]. We here show that it is possible to identify drugs that can possibly be selected for validation studies, even when their effects on purified CSCs are not yet available.
Predicting Chemotherapy Sensitivity Profiles for Breast Cancer Cell Lines Current Signal Transduction Therapy, 2013, Vol. 8, No. 3 269
MATERIALS AND METHODS
In Silico Classification of Breast Cancer Cell Lines and Identification of Drugs with Differential Effects
The GSE36133 dataset containing expression data from all cell lines with drug screening data in the CCLE project was RMA normalized using GeneSpring v.12.5. Breast cancer cell lines were hierarchically clustered based on the probeset lists reported by Gupta et al. [4] or Kao et al. [5]; with Euclidian distance measures for both genes and arrays, and complete linkage, using Cluster 3.0 software. Drug toxicity data was obtained from the CCLE project (http://www. broadinstitute.org/ccle) [3]. Groups identified as CSC-like and non-CSC-like were compared using t-test (2-sided, equal variance) for all parameters (activity area, Amax, IC50, and EC50). p≤0.05 was considered statistically significant. ANNOTATING GLOBAL EFFECTS OF DRUGS ON CANCER CELL LINES
Drug toxicity (activity area) data was obtained for all drugs contained within the CCLE project database [3], and was plotted for each cell line type following mean-sorting, using the “boxplot” function of the graphics package of R [6]. Cell line annotations are those provided by CCLE, except for the two breast cancer cell types which were identified in this study.
RESULTS
In Silico Classification of Breast Cancer Cell Lines into CSC-Like and Non-CSC-Like Populations
Several recent studies have generated gene lists that define CSC-like populations. One such list generated by Gupta et al, consists of genes differentially expressed in cells that resist paclitaxel but are sensitive to salinomycin, drugs known to effect non-CSCs or CSCs, respectively. The list was validated based on its ability to correctly identify breast CSCs as defined by other methods [4]. We asked if this signature could be used to differentiate commonly used breast cancer cell lines into distinct populations. Indeed, hierarchical clustering of the 27 breast cancer cell lines with screening data in the CCLE project revealed two distinct clusters, one that contained 6 cell lines which up-regulated most CSC-related genes and down-regulated all genes associated with non-CSCs, clearly categorizing them as CSC-like. The second cluster behaved in exactly the opposite manner, indicating that they were, or at least contained, primarily non-CSC or epithelial cells (Fig. 1). In another study aiming to classify breast cancer cell lines into subgrups, Kao et al. revealed the presence of 3 distinct subtypes which they coined basal-A, basal-B and luminal [5]. When we used this gene list to cluster all CCLE breast cancer cell lines, we observed that all CSC-like cells as defined by Gupta et al.’s
Fig. (1). Hierarchical clustering of the 27 breast cancer cell lines used in the CCLE project with a breast CSC signature (ref. 4). The
list used for clustering contains 14 genes that are down-regulated (D), and 25 that are upregulated (U) in salinomycin-sensitive cells (CSCs). Clustering of the CCLE cell lines reveals two distinct groups, one which shows the same expression pattern as CSCs, which we therefore, denote “CSC-like”(A). The second cluster, behaves in the opposite fashion, and are therefore, coined “non-CSC-like” or epithelial cells (B). Colors are standardized to represent maximum and minimum expression for each gene. Red: up-, green: down-regulation.
list corresponded to basal-B cells, while non-CSC-like cells were basal-A or luminal type cell lines (Supplementary Fig. 1). In our analysis, basal-B cells formed an independent cluster, while basal-A and luminal cells co-clustered. Thus, two independent gene lists classified existing breast cancer cell lines into the same two major groups.
IDENTIFYING DRUGS TARGETING CSC-LIKE BREAST CANCER CELL LINES
The CCLE database contains cytotoxicity data reported as 4 different parameters (IC50, EC50, Amax and activity area) for 24 drugs. Using this data, we determined drugs which showed statistically different effects on the CSC-like
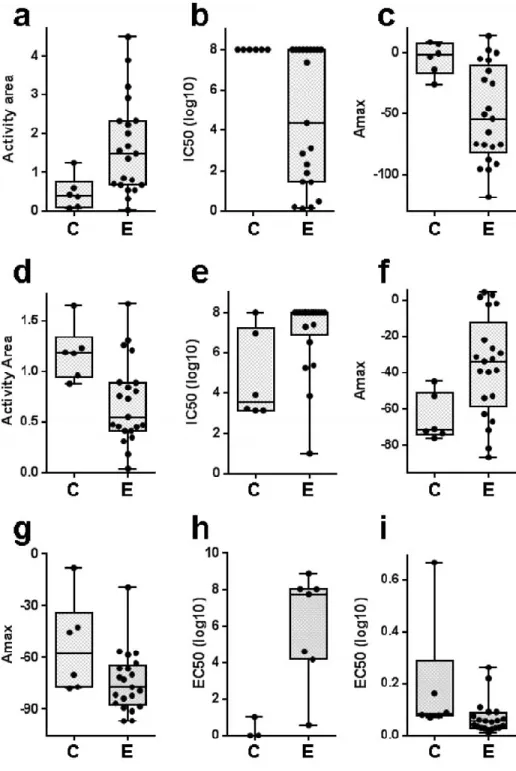
Fig. (2). Drugs with differential effects on CSC-like and non-CSC-like cells. Inhibitory effects that are significantly different among
CSC-like (C) and non-CSC-like (E) cell lines are shown. Drugs: Lapatinib (a-c), TKI258 (d-f), 17AAG (g), L685458 (h), and Panobinostat (i). The measure of cytotoxicity for which significance was observed is indicated on the y-axis. Increased activity area, or decreased Amax, IC50 or EC50 values indicate increased drug sensitivity. Box includes values between the 25th and 75th percentiles, with the median indicated. Whiskers are from the minimum to the maximum value. P values obtained by the two-tailed t-test are: a: 0.03, b: 0.02, c: 0.01, d: 0.01, e: 0.01, f: 0.02, g: 0.04, h: 0.01, i: 0.05.
Predicting Chemotherapy Sensitivity Profiles for Breast Cancer Cell Lines Current Signal Transduction Therapy, 2013, Vol. 8, No. 3 271
and non-CSC-like cell lines. We thus identified TKI258 (dovitinib, a FGFR, VEGFR and PDGFR inhibitor) and L-685458 (a γ -secretase inhibitor) as agents that were preferentially active on CSC-like cells. TKI258 showed significantly better toxicity on the CSC-like cells when analyzed using 3 of the 4 parameters of cell viability (Fig. 2). Non-CSC cells were relatively sensitive to Lapatinib (a dual HER2/neu and EFGR inhibitor), 17-AAG (a HSP90 inhibitor), and Panobinostat (histone deacetylase inhibitor). Significant sensitivity to Lapatinib was evident from analysis performed with 3 out of 4 measures of cytotoxicity (Fig. 2). GLOBAL DRUG EFFECTS ON CANCER CELL LINES BASED ON TISSUE OF ORIGIN
Comparing two groups of cells, albeit useful, has a caveat in that a drug with excellent toxicity for both groups will not be identified if it affects both groups similarly, or alternatively if the drug’s active concentration range is
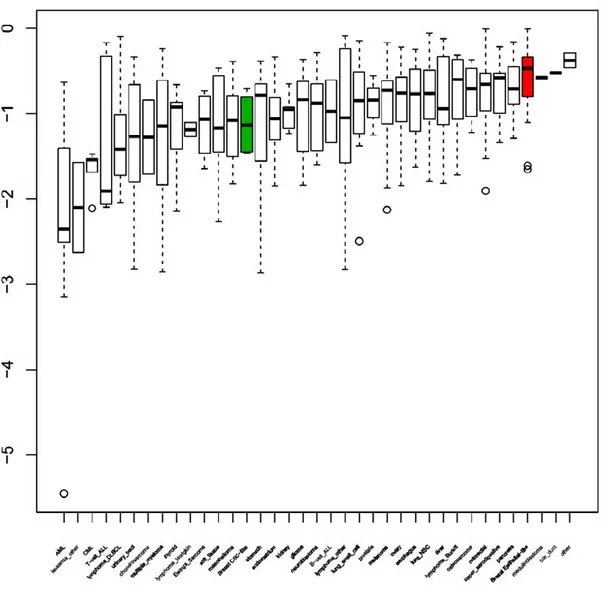
narrow. To overcome this caveat we wanted to view the “overall” effect of all CCLE drugs on all cancer cell lines including the two breast cancer cell line groups we identified. We chose “activity area” as the reference measure as it generates a value for each cell/treatment condition as opposed to IC50 or EC50. When tumor cell lines, grouped by tissue of origin, were sorted based on the mean value for activity area from lowest (most active) to the highest (least active) for TKI258, we observed that the two breast cancer subpopulations were indeed quite distant from each other (Fig. 3). However, the fact that the non-CSC-like breast cancer cell lines were among the most resistant to this drug, obviously contributed to the significant difference observed between the two cell groups. Thus, it needs to be determined whether the doses of this drug at which CSC-like cells are affected can be tolerated in vivo. If most CSC-like cells are within this range, then the drug would be a suitable agent for treating CSC-like breast cancer cells. Similar analyses
Fig. (3). TKI258 sensitivity of tumor cell lines. TKI258 activity on cell lines (activity area) grouped by tissue of origin is shown. Box
represents 25th to 75th percentile, and whiskers the 2 standard deviations above and below the mean value of the activity area values obtained for each cell line type. Outliers are represented by circles. Line indicates the median. Cell lines are mean-sorted from the most sensitive (left) to the least. CSC-like (green) and non-CSC-like (red) breast cancer cell lines are indicated.
revealed that the B-Raf and VEGFR2 inhibitor Raf265, although not significant by t-test analysis, was in fact a better differentiator of the two breast cancer cell line populations based on how far apart the two populations were in this graphic (Supplementary Fig. 2). Again, the value of this observation strongly depends on the effective dose range of the drug in vivo. The non-CSC-like breast cancer cells, on the other hand, were found to be the most sensitive cells, compared to all other cancers when evaluated for lapatinib toxicity. In contrast, CSC-like breast cancer cells were very resistant to lapatinib (Fig. 4). This is an interesting finding as lapatinib has been recently approved for hormone-positive and HER2 positive breast cancer treatment. Even if most non-CSC-like breast cancer cells are sensitive to this agent, our data suggests that lapatinib treatment alone will likely not affect CSC-like breast cancer cells. In contrast, the IAP (inhibitor of apoptosis) inhibitor LBW242 was the drug to which the CSC-like breast cancer cells were most sensitive,
when compared to all other drugs (Supplementary Fig. 3). The drug is only moderately toxic for non-CSC-like breast cancer. Therefore, if tumors are found to contain a mixture of CSC-like and non-CSC-like populations, this analysis suggests that lapatinib/LBW242 combination therapy could be worth further validation.
DISCUSSION
We herein describe two straight-forward approaches by which large-scale gene expression and drug sensitivity data can be utilized to identify suitable chemotherapeutics for a given cell type. Our first approach is based on defining subsets of cell lines based on published gene lists. It is interesting to observe how two such independent lists generate the same clusters for breast cancer cell lines. Gene lists have been used to reproducibly cluster breast cancer into “intrinsic subtypes” that consist primarily of luminal and basal types [7, 8]. It is, therefore, not surprising that
Fig. (4). Lapatinib sensitivity of tumor cell lines. Lapatinib activity on cell lines (activity area) grouped by tissue of origin is shown. Box
represents 25th to 75th percentile, and whiskers the 2 standard deviations above and below the mean value of the activity area values obtained for each cell line type. Outliers are represented by circles. Line indicates the median. Cell lines are mean-sorted from the most sensitive (left) to the least. CSC-like (green) and non-CSC-like (red) breast cancer cell lines are indicated.
Predicting Chemotherapy Sensitivity Profiles for Breast Cancer Cell Lines Current Signal Transduction Therapy, 2013, Vol. 8, No. 3 273
signatures consisting of the most differentially expressed genes among cell groups overlap with the intrinsic subtypes. On the other hand, that such a classification reflects a stem-cell character is in our opinion very valuable. This not only implies that such cell lines can represent CSCs, but it also suggests that larger numbers of cells within a tumor might take upon themselves a stem-like character. In fact, the mechanism behind epithelial to mesencymal transition (EMT) or its reverse (MET), is exactly this [9]. Mesenchymal cells are slow growing, less differentiated, invasive and tumorigenic cells, resembling CSCs in many ways. In this line, for melanoma, colorectal cancer and others, EMT or a similar profile of “switchable” phenotypes has been associated with the tumorigenesis process or the variation of cells within the tumor. Therefore, even if cell line subtypes do not consist of CSCs exclusively, they still can represent behavior of such cells. Nevertheless, analyses described within this study do not eliminate the need for validation studies where CSC-like cells would be tested for qualities of colony formation, proliferation, invasion and such to demonstrate a functional similarity to CSCs. As the drug effects predicted in this study are very likely to be reproduced if the same cells are tested in vitro, it would be important to perform clustering and cell toxicity experiments in cells that are not included in the CCLE cell line cohort. In this study, paclitaxel activity on CSC-like and non-CSC-like cells was not found to differ significantly. As Gupta et al. showed differential toxicity of this drug against the two populations, the two cell populations identified here in in Gupta et al.’s study are not identical [4]. However, as different subtypes of breast cancer (represented by the cell subtypes identified in this study) are known to benefit from different chemotherapeutics, it could be argued that even if cell line sub-populations are not CSCs, they do represent a distinct phenotype that resembles CSCs in certain aspects. The validity of the approach described in this study will be strengthened if drugs that are found to affect CSC-like cells are also able to kill phenotypically similar populations of CSCs.
We believe, a global view of drug sensitivity, showing sensitivity profiles of all tumor cells for a given drug, is helpful in determining chemotherapeutics better suited for clinical use for a given tumor type. A most striking finding is that among all cell lines, non-CSC-like breast cancer cells are most sensitive to lapatinib, a drug currently approved for breast cancer treatment. Equally revealing, is the finding that CSC-like cells are relatively resistant to the same drug, when they are sensitive to agents like LBW242 or Raf265. Thus, our analysis reveals the presence of two distinct breast cancer cell types for which different treatment regimens might be appropriate and those drugs that are candidates for combination therapy. All drugs within the CCLE database are FDA-approved, and have a limited effective concentration range. Generating the in vitro counterpart to the maximum tolerable in vivo dose for cell lines, combined with this global analysis, would be very helpful in identifying tumor types for which a given drug is suitable in vivo.
CONCLUSION
We show that the classification of breast cancer cell lines into phenotypically distinct groups facilitates the identification of chemotherapeutics that might individually target CSC-like as well as non-CSC-like cells. The overall drug sensitivity profile of cell lines, on the other hand, reveals that drugs like Raf265 or LBW242 might affect CSC-like breast cancer cell lines at concentrations that are possibly well tolerated.
CONFLICT OF INTEREST
The author(s) confirm that this article content has no conflict of interest.
ACKNOWLEDGEMENTS
MI: R based bioinformatics analyses, re-annotation of cell lines, cluster analyses and CCLE drug profiling experiments. KMS: Clustering and drug identification based on the CSC-list (Gupta et al.). AOG: Overall design of the study.
SUPPLEMENTARY MATERIAL
Supplementary material is available on the publisher’s web site along with the published article.
LIST OF ABBREVIATIONS CSC = cancer stem cell
CCLE = cancer cell line encyclopedia
COST = intergovernmental framework for European Cooperation in Science and Technology EMT = epithelial to mesenchymal transition FDA = food and drug administration RMA = robust multi-array average REFERENCES
[1] Gilbertson, R.J. and T.A. Graham, Cancer: Resolving the stem-cell
debate. Nature, 2012. 488(7412): p. 462-3.
[2] Magee, J.A., E. Piskounova, and S.J. Morrison, Cancer stem cells:
impact, heterogeneity, and uncertainty. Cancer Cell, 2012. 21(3): p.
283-96.
[3] Barretina, J., et al., The Cancer Cell Line Encyclopedia enables
predictive modelling of anticancer drug sensitivity. Nature, 2012. 483(7391): p. 603-7.
[4] Gupta, P.B., et al., Identification of selective inhibitors of cancer
stem cells by high-throughput screening. Cell, 2009. 138(4): p.
645-59.
[5] Kao, J., et al., Molecular profiling of breast cancer cell lines
defines relevant tumor models and provides a resource for cancer gene discovery. PLoS ONE, 2009. 4(7): p. e6146.
[6] The R Development Core Team, R: A Language and Environment
for Statistical Computing. 2010.
[7] Perou, C.M., et al., Molecular portraits of human breast tumours. Nature, 2000. 406(6797): p. 747-52.
[8] Sorlie, T., et al., Gene expression patterns of breast carcinomas
distinguish tumor subclasses with clinical implications. Proc Natl
Acad Sci U S A, 2001. 98(19): p. 10869-74.
[9] Mani, S.A., et al., The epithelial-mesenchymal transition generates
cells with properties of stem cells. Cell, 2008. 133(4): p. 704-715.
SUPPLEMENTARY MATERIAL
Predicting Chemotherapy Sensitivity Profiles for Breast Cancer Cell Lines with and
Without Stem Cell-Like Features
Murat Isbilen, Kerem Mert Senses and Ali Osmay Gure
*Bilkent University, Department of Molecular Biology and Genetics, Ankara, Turkey 06800
Supplementary Fig. (1). Hierarchical clustering analysis of CCLE breast cancer cell lines with Kao et al.’s gene list (ref. 5). Cluster
analysis of all breast cancer cell lines, including those that were previously analyzed by Kao et al. (ref. 5), reveal three groups: Luminal (blue), Basal A (red) and Basal B (yellow). The heatmap and details of the cluster are shown. The 6 CSC-like cell lines are all of the “Basal B” type. The gene list used for clustering included 12628 probesets corresponding to 5771 of the 8750 genes used for the original analysis, as only these genes had corresponding annotations for the HGU 133 Plus 2.0 platform.
ii Current Signal Transduction Therapy, 2013, Vol. 8, No. 3 Isbilen et al.
Supplementary Fig. (2). RAF265 sensitivity of tumor cell lines. RAF265 activity on cell lines (activity area) grouped by tissue of origin is
shown. Box represents 25th to 75th percentile, and whiskers the 2 standard deviations above and below the mean value of the activity area
values obtained for each cell line type. Outliers are represented by circles. Line indicates the median. Cell lines are mean-sorted from the most sensitive (left) to the least. CSC-like (green) and non-CSC-like (red) breast cancer cell lines are indicated.
Supplementary Fig. (3). LBW242 sensitivity of tumor cell lines. LBW242 activity on cell lines (activity area) grouped by tissue of origin is
shown. Box represents 25th to 75th percentile, and whiskers the 2 standard deviations above and below the mean value of the activity area
values obtained for each cell line type. Outliers are represented by circles. Line indicates the median. Cell lines are mean-sorted from the most sensitive (left) to the least. CSC-like (green) and non-CSC-like (red) breast cancer cell lines are indicated.
View publication stats View publication stats