A NEW ADAPTIVE BURST ASSEMBLY ALGORITHM
FOR OBS NETWORKS CONSIDERING CAPACITY
OF CONTROL PLANE
a thesis
submitted to the department of electrical and
electronics engineering
and the institute of engineering and sciences
of bilkent university
in partial fulfillment of the requirements
for the degree of
master of science
By
˙Ismail C¸ırak
September 2008
I certify that I have read this thesis and that in my opinion it is fully adequate, in scope and in quality, as a thesis for the degree of Master of Science.
Assoc. Prof. Dr. Ezhan Kara¸san(Supervisor)
I certify that I have read this thesis and that in my opinion it is fully adequate, in scope and in quality, as a thesis for the degree of Master of Science.
Assoc. Prof. Dr. Nail Akar
I certify that I have read this thesis and that in my opinion it is fully adequate, in scope and in quality, as a thesis for the degree of Master of Science.
Assist. Prof. Dr. ˙Ibrahim K¨orpeo˘glu
Approved for the Institute of Engineering and Sciences:
Prof. Dr. Mehmet Baray
ABSTRACT
A NEW ADAPTIVE BURST ASSEMBLY ALGORITHM
FOR OBS NETWORKS CONSIDERING CAPACITY
OF CONTROL PLANE
˙Ismail C¸ırak
M.S. in Electrical and Electronics Engineering
Supervisor: Assoc. Prof. Dr. Ezhan Kara¸san
September 2008
Recent developments in wavelength-division multiplexing (WDM) technology increase the amount of bandwidth available in fiber links by many orders of mag-nitude. However, this increase in link capacities is limited by the conventional electronic router’s capability. Optical burst switching (OBS) has been proposed as a promising and a short-term solution for switching technology to take ad-vantage of increased capacity of optical links. The congestion in OBS control plane and the adaptive burst assembly algorithms are two important research topics that are among the most effective factors determining the performance of OBS networks. These two problems have been separately studied in the litera-ture so far. It has been shown that contending bursts at a core optical switch in an OBS network may experience unfair loss rates based on their residual off-set times and burst lengths, that are called path length priority effect (PLPE) and burst length priority effect (BLPE), respectively. In this thesis, we propose a new adaptive timer-based burst assembly algorithm (ATBA) which uses loss
order to mitigate the undesired effects of PLPE and BLPE. ATBA distributes the burst generation rates of traffic streams at an ingress node such that total rate of generated bursts is constant in order to constrain the congestion in the control plane. Without ATBA, the fairness index drops to 76% when per hop processing delay (PHPD) is increasing. With ATBA, the fairness index drops only to 85% with increasing PHPD. It is also shown that the total goodput of the OBS network improves by 5% compared with the case without ATBA.
Keywords: Optical Burst Switching (OBS), Adaptive Burst Assembly,
Conges-tion in OBS Control Plane, Path Length Priority Effect (PLPE), Burst Length Priority Effect (BLPE)
¨
OZET
OPTIK C
¸ O ˘
GUS¸UM ANAHTARLAMA A ˘
GLARI ˙IC
¸ ˙IN
D ¨
UZENLENM˙IS¸ KONTROL D ¨
UZLEM˙IN˙IN KAPAS˙ITES˙INE
UYGUN UYARLANAB˙IL˙IR C
¸ O ˘
GUS¸UM OLUS¸TURMA
ALGOR˙ITMASI
˙Ismail C¸ırak
Elektrik ve Elektronik M¨uhendisli¯gi B¨ol¨um¨u Y¨uksek Lisans
Tez Y¨oneticisi: Do¸c. Dr. Ezhan Kara¸san
Eyl¨ul 2008
Fiber ba˘glantılardaki ula¸sılan bant geni¸sli˘gi ¸coklanmı¸s b¨ol¨unebilir-dalga boyun-daki (WDM) yeni geli¸smelerinde yardımı ile y¨uksek boyutlara ¸cıkmı¸stır. An-cak, ba˘glantı kapasitelerindeki bu artı¸s geleneksel elektronik y¨onelticilerin kapa-sitesi ile sınırlanmaktadır. Y¨uksek bant geni¸sli˘ginden yararlanabilmek i¸cin, Op-tik C¸ o˘gu¸sum Anahtarlama (OBS) kısa vadede uygulanabilir bir ¸c¨oz¨um olarak ¨onerilmi¸stir. OBS kontrol d¨uzlemindeki tıkanıklık ve uyarlanabilir ¸co˘gu¸sum olu¸sturma algoritmaları, OBS a˘glarının performansı ¨uzerideki etkin fakt¨orler arasında iki ¨onemli ara¸stırma konusudur. S¸imdiye kadar bu iki problem ayrı ayrı incelenmi¸stir. OBS a˘gında bulunan bir optik anahtarda ¸carpı¸san ¸co˘gu¸sumlar arta kalan artık zamanlarına ve ¸co˘gu¸sum boylarına g¨ore de˘gi¸sebilen haksız kayıplar g¨orebilirler. Bu iki neden literat¨urde yol boyuna ba˘glı ¨oncelik etkisi (PLPE) ve ¸co˘gu¸sum uzunlu˘guna ba˘glı ¨oncelik etkisi olarak adlandırılmaktadır. Biz bu tezde PLPE ve BLPE’nin istenmeyen etkilerini yok etmek i¸cin kayıp oranlarını kullanarak ¸co˘gu¸sum olu¸sturma zamanlarını ayarlayabilen yeni bir
OBS kontrol d¨uzlemindeki tıkanıklı˘gını engellemek i¸cinde sabit olan toplam ¸co˘gu¸sum olu¸sturma hızını gelen trafik akımları arasında payla¸stırmaktadır. Yapılan sim¨ulasyonlarda ATBA kullanılmadan ¸cıkan sonu¸clarda artan zıplama ba¸sına olu¸san i¸slemden kaynaklı gecikmelerine (PHPD) g¨ore hak dizini % 76’ya d¨u¸sm¨u¸st¨ur. ATBA kullanıldı˘gında bu d¨u¸s¨u¸s % 85’de sınırlandırılmı¸stır. Ayrıca, ATBA’nın kullanılmadı˘gı sim¨ulasyon sonu¸cları ile kar¸sıla¸stırldı˘gında OBS a˘gından elde edilen toplam ¨uretilen i¸s %5 artmı¸stır.
Anahtar Kelimeler: Optik C¸ o˘gu¸sum Anahtarlama , Uyarlanabilir C¸ o˘gu¸sum Olu¸sturma, OBS Kontrol D¨uzlemindeki Tıkanıklık, Yol Boyuna Ba˘glı ¨Oncelik Etkisi, C¸ o˘gu¸sum Uzunlu˘guna Ba˘glı ¨Oncelik Etkisi
ACKNOWLEDGMENTS
I would like to thank my supervisor Assoc. Prof. Dr. Ezhan Kara¸san for his supervision and guidance throughout the development of this thesis.
I would like to thank to Dr. Nail Akar and Dr. ˙Ibrahim K¨orpeo˘glu for reading the manuscript and commenting on the thesis.
I would like to thank to Onur Alparslan and G¨uray G¨urel for their efforts in developing the nOBS simulator.
I would also like thank to Bilkent Computer Center for allowing me to use their labs.
Contents
1 Introduction 1
2 Performance Issues in OBS Networks 9
2.1 Congestion in OBS Control Plane . . . 10
2.2 Adaptive Burst Assembly Algorithms . . . 11
2.3 Path Length and Burst Length Priority Effects . . . 13
2.4 Analysing The Burst Length Effect on Burst Loss Rates . . . 15
3 ATBA: A New Adaptive Timer-Based Assembly Algorithm 20 3.1 Signalization Procedure and Adaptive Assembly Algorithm . . . . 20
3.2 Rate Control Mechanism . . . 26
3.3 Simulation Results . . . 27
3.3.1 Effect of ATBA on Burst Length Distribution . . . 28
3.3.2 Effect of ATBA on Performance of OBS Network . . . 29
3.4 Application of ATBA on OBS Network with Offset-Based QoS . . 46
List of Figures
2.1 Chain Network Topology . . . 15
2.2 Throughput of UDP Flows in Chain Network with P HP D = 50µsec, BBG rates are λ = 8.5burstspersecond, µ−1 = 1.5msec, UDP flow rate M = 40Mbps . . . 17
2.3 Throughput of UDP Flows in Chain Network with P HP D = 100µsec, BBG rates are λ = 8.5burstspersecond, µ−1 = 1.5msec, UDP flow rate M = 40Mbps . . . 17
3.1 Signaling Scheme for ATBA . . . 22
3.2 Flow Chart of ATBA . . . 25
3.3 Rate Control Mechanism in the Ingress Routers in OBS Networks 27 3.4 Mesh Scenario used as Simulation Topology . . . 28
3.5 Burst Histogram of S1− D1 Flow . . . 30
3.6 Burst Histogram of S2− D2 Flow . . . 30
3.7 Burst Histogram of S3− D3 Flow . . . 31
3.9 Burst Histogram of S5− D5 Flow . . . 32
3.10 Burst Histogram of S6− D6 Flow . . . 32
3.11 Throughput of S1− D1 Flow . . . 34
3.12 Burst Loss Rates of S1− D1 Flow . . . 34
3.13 Throughput of S2− D2 Flow . . . 35
3.14 Burst Loss Rates of S2− D2 Flow . . . 35
3.15 Throughput of S3− D3 Flow . . . 36
3.16 Burst Loss Rates of S3− D3 Flow . . . 36
3.17 Throughput of S4− D4 Flow . . . 37
3.18 Burst Loss Rates of S4− D4 Flow . . . 37
3.19 Throughput of S5− D5 Flow . . . 38
3.20 Burst Loss Rates of S5− D5 Flow . . . 38
3.21 Throughput of S6− D6 Flow . . . 39
3.22 Burst Loss Rates of S6− D6 Flow . . . 39
3.23 Total Throughput of OBS Network . . . 40
3.24 Max-Min Fairness of OBS Network . . . 40
3.25 BGR Distribution at Ingress Node 1 . . . 42
3.26 BGR Distribution at Ingress Node 2 . . . 42
3.27 Adaptation of ATBA - Throughput of S1− D1 Flow . . . 43
3.29 Adaptation of ATBA - Throughput of S3− D3 Flow . . . 44
3.30 Adaptation of ATBA - Throughput of S4− D4 Flow . . . 44
3.31 Adaptation of ATBA - Throughput of S5− D5 Flow . . . 45
3.32 Adaptation of ATBA - Throughput of S6− D6 Flow . . . 45
3.33 New Ingress Structure . . . 48
3.34 Throughput of S1− D1 Flows . . . 49 3.35 Throughput of S2− D2 Flows . . . 50 3.36 Throughput of S3− D3 Flows . . . 50 3.37 Throughput of S4− D4 Flows . . . 51 3.38 Throughput of S5− D5 Flows . . . 51 3.39 Throughput of S6− D6 Flows . . . 52
List of Abbreviations
WDM
Wavelength-Division Multiplexing
1
OCS
Optical Circuit Switching
1
O/E/O
Optical-Electronic-Optical
1
OPS
Optical Packet Switching
2
FDL
Fiber Delay Lines
2
OBS
Optical Burst Switching
2
BCP
Burst Control Packet
2
JET
Just-Enough-Time
4
PHPD
Per-Hop Processing Delay
4
LAUC-VF Latest Available Unused Channel with Void Filling 4
BLPE
Burst Length Priority Effect
4
PLPE
Path Length Priority Effect
5
ATBA
a new Adaptive Timer-based Assembly Algorithm
5
BGR
Burst Generation Rate
6
QoS
Quality of Service
7
HPF
High Priority Flows
7
LPF
Low Priority Flows
7
VoIP
Voice over IP
7
VTC
Video Teleconferencing
7
HPB
High Priority Burstifiers
7
LPB
Low Priority Burstifiers
7
n-OBS
ns2 Based OBS Network Simulator
15
BBG
Background Burst Generator
16
BLRF
Burst Loss Rate of the Flow
22
ABLL
Average Loss Rate of the Outgoing Link
22
DNR
Degree of Need For Extra Rate
23
RCM
Rate Control Mechanism
26
RD
Rate Dealer
26
TB
Token Buckets
26
Chapter 1
Introduction
Communication networks are dealing with a dramatic increase in bandwidth de-mands which can be supported with recent developments in wavelength-division multiplexing (WDM) technology that increase the amount of bandwidth avail-able in fiber links by many orders of magnitude. However, this increase in link capacities is limited by the conventional electronic router’s capability.
Several approaches have been proposed to take advantage of increased capac-ity of optical links. One such approach is Optical Circuit Switching (OCS), which is based on a lightpath that is established before the data transfer starts. Wave-length routing is the essential part of this approach since a lightpath, which is like a circuit, uses a dedicated wavelength on each link from source to destination. Once this lightpath have been established, data remains in the optical domain throughout the path. Although, OCS eliminates expensive optical-electronic-optical (O/E/O) conversion at intermediate nodes, it has several drawbacks. First, the delay during the connection establishment and release significantly in-creases the latency for services which have short holding times. Furthermore, OCS holds a wavelength on each link during the transmission independent of the actual rate of the traffic which can be much smaller than the bandwidth of
a wavelength. Finally, establishing a lightpath before data transfer makes this approach unsuitable for adopting the changes of the link availability during the transfer. These shortcomings make OCS a non-optimal switching technology for optical networking applications with dynamic traffic and networking conditions. An alternative approach to OCS is the Optical Packet Switching (OPS) [1] which can cope up with the bursty traffic and can adapt to changes in link status. With these positive characteristics, OPS becomes a strong candidate for next-generation optical networking. However, in OPS the packet headers should be processed all optically, which is not feasible in the near future. This guides the researches to the electronic processing of the optical packet header after an O/E conversion at each intermediate node. This conversion creates an extra processing delay for headers that requires a guard time between the header and the data payload. In order to satisfy this requirement the data packets should be waiting in optical buffers called Fiber Delay Lines (FDL). An FDL is a very long optical fiber which can transfer the data payload for a fixed amount of time, providing a delay to enable the optical switching. However, FDL increases the switch cost and switches with FDL may require too much room.
An alternative approach, optical burst switching (OBS) [3], [6] has been pro-posed as a promising and a short-term solution for switching technology. OBS combines the strengths and avoids the shortcomings of OCS and OPS. An OBS network consists of ingress, core and egress nodes. In OBS, data packets reach-ing an reach-ingress node are aggregated into bursts before bereach-ing transmitted into the OBS network which already separates the wavelengths into two different planes: control and data planes. A Burst Control Packet (BCP) is transmitted over the control plane before the optical burst is transmitted over the data plane. In the control plane, the BCPs are converted to electrical signals at the core nodes along their paths and are electronically processed to reserve network resources to ac-commodate the upcoming burst. Meanwhile, in the data plane data bursts follow
their routes without any O/E/O conversion or processing delay, which eliminates the need for optical buffers and high switching rates. At the egress nodes, the incoming bursts are disassembled into electrical packets that are forwarded to the IP networks.
One of the main responsibilities of an ingress node is the Burst Assembly, which is a procedure for aggregating packets from various sources into an optical burst. At each ingress node, there is at least one burst assembler for each egress node, called a burstifier, which collects the electronic packets destined for that egress node. On each burstifier, an assembly algorithm decides when to stop aggregating the incoming packets and form the burst. Assembly algorithms in the literature can be classified as timer-based, burst-length-based and mixed timer/burst-length-based. In a burst-length-based assembly algorithm, there is a counter which counts the collected packets in a burst [7]. In timer-based assembly algorithm, this counter starts when the first electronic packet in the burst arrives [8]. In both algorithms, when the counter reaches some pre-defined threshold value, burstifier stops collecting the incoming packets to this burst and starts to aggregate new incoming packets into a new burst. In mixed timer/burst-length-based assembly algorithm, there are both types of counters and when one of them reaches to the assigned threshold value, the algorithm ends the aggregation procedure of that burst [9], [10]. Adaptive assembly algorithms have been proposed to enhance the OBS networks’ performance by considering the parameters of the incoming traffic, network state, etc., in the burst assembly algorithm. Adaptive assembly algorithms will be further discussed in Chapter 2. After packets are aggregated into a burst using the algorithms mentioned above, the burst should wait in the electronic buffers for an offset period until the ingress node is ready to send this burst into the optical domain. This offset period gives enough time to the corresponding control packet to make reservations at the core nodes along the path. Sending the BCP and the optical burst after an
offset time without waiting for any response from the core nodes is called one-way-reservation. Due to the one-way-reservation mechanism used in OBS, some bursts can be lost since the requested reservation cannot be fulfilled because of a contention. The duration of the reservations made at each intermediate node along the path is determined by the scheduling algorithm. Among the reservation algorithms proposed in the literature, Just-Enough-Time (JET) [6] reservation algorithm achieves the best performance in terms of the loss probability. In JET, the BCP reserves the network resources for just enough time for the transmission of the data burst at the core nodes.
In the control plane, these BCPs have to be processed to reserve a wavelength for the assigned burst after an O/E conversion. Since these conversion and processing events at the control plane take time at each core node, offset-time is determined by the product of the number of hops on the path and the per-hop processing delay (PHPD). Since, BCP needs to be processed while the burst traverses through without delay at each core node, a decrease takes place in the time difference between the arrival times of the data burst and BCP as the burst moves from one node to another. The new time difference between BCP and the associated burst, which is portion of the assigned offset-time, is called the residual offset-time.
Each core node uses a scheduling algorithm for allocating resources using the information contained in BCP. Latest Available Unused Channel with Void Filling (LAUC-VF) scheduling algorithm is one of the most efficient algorithms [10]. In LAUC-VF, even if some resource is scheduled, it is still considered available since a new burst may fill in the gap before a future scheduled burst.
In OBS networks when LAUC-VF is used, it has been recognized that Burst Length Priority Effect (BLPE), which is the effect of burst length distribution on the burst loss probabilities, results in an undesirable drop at the performance of OBS network [20]. Two bursts to be transmitted over the same link may have
different residual offsets, since the number of hops toward their respective desti-nations may be different. In such a situation, the burst which has lower residual offset, experiences higher burst loss rates which has been called the Path Length Priority Effect (PLPE) in [17], [20]. Moreover, this burst experiences a burst length dependent loss probability since these bursts may need to fit into voids formed by other reservations that have made earlier. We call the flows, which have lower residual offset times than the residual offset times of the contending flows at a congested node, as disadvantaged flows. New scheduling algorithms have been proposed for eliminating the unfairness between the performance of
disadvantaged flows and the contending flows in [17],[20]. However, the
pro-posed algorithms eliminate the unfairness by dropping the bursts of contending flows, which penalizes the performance of OBS network. Moreover, such new algorithms give extra processing delays at the control plane which increases the PHPD. This increase lengthens the difference between the residual offset-times and increases the adverse effect of PLPE on fairness between the performances of disadvantaged flows and the contending flows. This effect will be analyzed in more detailed in Chapter 2.
Another important factor that has a significant effect on the performance of OBS networks is the congestion in the control plane. It is caused by extensive processing load at the optical switches resulting from a large number of BCPs that are transmitted within the network. Extensive delays of the BCPs are penalized with the loss of the burst since the scheduling attempt becomes futile. It is shown that this congestion may become the main source of burst loss and it may be the most effective parameter on the throughput of OBS networks [14],[16].
In this thesis, we propose a new Adaptive Timer-based Assembly Algorithm (ATBA), for improving the burst loss probabilities for disadvantaged flows by shortening their burst lengths. Since smaller sized bursts result in large number
of burst transmissions, which in turn increases the processing load on the control plane, we use an adaptive burstification algorithm at each ingress node such that the total rate of bursts generated at each ingress node is kept constant. The adaptive burstifier at each ingress node uses the burst loss statistics collected by the optical nodes to allocate the fixed burst generation rate (BGR) budget assigned to the ingress node among the burstifiers, each corresponding to an ingress node. In this algorithm, the burstifier corresponding to a disadvantaged
flow is assigned a larger burst transmission rate whereas the rates of the other
flows are decreased so that smaller sized bursts belonging to disadvantaged flow will receive favorable loss rates at the congested links. With ATBA, the adverse effects of PLPE and BLPE are dealt with at the ingress nodes so that processing load at the core nodes is not increased. Furthermore, ATBA does not penalize the throughput of other flows while the adverse effects of PLPE and BLPE are alleviated.
Up to now, the studies in the literature clarifies adverse effect of the conges-tion in the control plane on the performance of OBS networks in detail. However, this problem is only focused on the identification of the restrictions on network parameters, such as minimum possible length of the generated bursts or maxi-mum possible number of wavelengths at the data plane. On the other hand, the proposed adaptive burst assembly algorithms try to improve the performance of OBS network by only considering the incoming traffic parameters. So far, none of the studies about burst assembly algorithm focuses on the congestion in OBS control plane. However, ATBA considers these restrictions by limiting the burst generation rates at each ingress node.
In Chapter 3, we study the decrease in the fairness index when the PHPD is increasing. Without ATBA, the fairness index drops to 76% when PHPD is increasing. With ATBA, the fairness index drops only to 85% with increasing PHPD. Moreover, the throughput of disadvantaged flows increase 10% without
penalizing the throughputs of other flows. It is also shown that the total goodput of the OBS network improves by 5% compared with the case without ATBA.
Quality of service (QoS) has been under intensive study for OBS networks. One of the basic differentiation mechanisms proposed for OBS networks is the offset-time based QoS. In offset based QoS, the main idea is to add an extra time interval to the offset times of high priority flows (HPFs) for making the reservations for a further moment in time than the competing low priority flows (LPFs).
Since offset based QoS inreases the offset times of HPFs, the delays experi-enced by these flows increase. This violates the maximum delay requirements of real time applications such as Voice over IP (VoIP), Video Teleconferencing (VTC). In this thesis, firstly we separate the burstifiers into two groups: high priority (HPBs) and low priority burstifiers (LPBs). Secondly, we try to decrease the total delay for HPFs by increasing the assigned BGRs to the HPBs. Since high BGR results in lower burstification delay, which in turn decreases the total delay of HPFs, we divide the total BGR budget among the burstifier groups such that the assigned BGR to HPBs is greater than the assigned BGR budget to LPBs. Then, ATBA dynamically allocates these BGR budgets, which are assigned to the burstifier groups, among the burstifiers to pressurize the adverse effects of PLPE and BLPE.
We show that, while the delays of HPFs are reduced by decreasing the bursti-fication delays, the throughputs of disadvantaged HPFs increase 5% with ATBA. Moreover, the throughputs of disadvantaged LPFs increase 10% since the fairness increases at the core node.
In Chapter 2, we first give detailed information of related studies. The effect of burst length distribution and PHPD on burst loss rates are also discussed in Chapter 2. Information of ATBA and the simulation results of the effect of
ATBA on burst length distributions, on performance of the OBS Network and the adaptation of ATBA to changes in network traffic are represented in Chapter 3. Also in Chapter 3, we discuss how ATBA can be expended to OBS networks with two QoS classes. The thesis will be concluded at Chapter 4.
Chapter 2
Performance Issues in OBS
Networks
Recent developments in wavelength-division multiplexing (WDM) technology in-crease the amount of bandwidth available in fiber links by many orders of mag-nitude. However, this increase in link capacities is limited by the conventional electronic router’s capability. Several approaches have been proposed to take advantage of increased capacity of optical links. One of the several approaches is optical burst switching (OBS) has been proposed as a promising and a short-term solution for switching technology.
In OBS, data packets reaching an ingress node are aggregated into bursts before being transmitted into the optical network. OBS network separates the wavelengths into two different planes: data and control plane. After burstifiers finish aggregating the incoming electronic packets, ingress node transmits a Burst Control Packet (BCP) over the control plane, before transmitting the optical burst over the data plane. At each core node, BCPs are electronically processed to reserve the resources to accommodate the upcoming bursts. So, data bursts
can follow their routes without any O/E/O conversion. These features allow OBS to benefit from the transmission efficiency of optical links.
Performance of OBS networks is one of the main research topics in the liter-ature. Congestion in OBS control plane and adaptive burst assembly algorithms are two important research topics that are the most effective factors on perfor-mance of OBS networks. Another important research topic in the literature is the fairness problem at the core nodes due to the Path Length (PLPE) and Burst Length Priority Effect (BLPE).
In this chapter, we first present studies about the effect of congestion in OBS control plane. Then, we describe adaptive burst assembly algorithms in the literature. In the third part, we focus on the studies on fairness problem due to PLPE and BLPE. Finally, we clarify the fairness problem with a simulation and analyze the effects of this fairness on the performance of OBS networks.
2.1
Congestion in OBS Control Plane
There have been many proposed scheduling algorithms for OBS networks, which are focused on efficiency and the complexity of the algorithms such as LAUC-VF in [10]. However, with increasing complexity the processing times of the BCPs are also increased as well. This raises the usage of queues in control plane and in heavily loaded networks, this may result in losses of BCPs. Consequently, the losses of BCPs make the scheduling attempts futile.
The effect of the control plane congestion on performance of OBS networks is studied in [14]. In this study, the increased per-hop processing delay (PHPD) raises the load on the control-processor, which results in losses at the control plane. With high PHPDs, these losses dominate the system performance and results in dramatically high burst loss rates. As a conclusion, this study implies
that the control plane limitation is one of the important parameters that should be considered when building an efficient OBS network.
In [15], the study derives necessary conditions for eliminating the control plane congestion which can become the ultimate throughput bottleneck of an OBS network. In this study, the necessary conditions are some physical design parameters such as the number of data channels, the burst lengths and PHPD. Authors explore safety regimes, where the impact of congestion in the control plane can be noneffective on OBS networks, according to these parameters. This safety regime becomes more important for networks with relatively short bursts or with large number of data channels. Finally, the authors state that if the designers want the network to work in the safety regime, they should limit the minimum average burst size that can be accommodated in the network according to PHPD. Moreover, [16] also states that carefully chosen minimum mean burst length can limit the effects of congestion in the control plane on the performance of OBS networks.
2.2
Adaptive Burst Assembly Algorithms
In an ingress node, incoming electronic packets wait at an assembly queue with the packets destined for the same egress node. The waiting packets are aggre-gated in data bursts before being transmitted into the OBS network. On each burstifier, an assembly algorithm decides when to stop aggregating the incoming packets and transmit the assembled data burst into the optical domain. Assembly algorithms can be classified in the literature as timer-based, burst-length-based and mixed timer/burst-length-based. In a burst-length-based assembly algo-rithm [7], there is a counter which counts the collected packets into the burst, and the judgment of the transmission time is decided by a pre-defined threshold value. In timer-based assembly algorithm [8], this counter starts when the first
electronic packet of the burst arrives and the release time is decided by a pre-defined timeout. In mixed timer/burst-length-based assembly algorithm, there are both types of counters and when one of them reaches to assigned threshold value, algorithm ends the aggregation procedure and sends the assembled burst into the optical domain [9],[10].
Since the incoming traffic has a bursty behavior, the assembly algorithms with fixed threshold cannot be optimum for aggregating the incoming bursts. Several adaptive assembly algorithms have been proposed. In [11], the timer-based threshold value is changed according to the previously assembled data burst length. When the previously examined burst length is small, the adaptive algorithm forces to shorten the timeout. By this way, the traffic with low rate has experienced lower burstification delay which results in improvements in the performance of the network. However, with this adaptive algorithm the variation at the burst lengths are increasing which results in assembled bursts with longer burst lengths. The lengthened bursts result in more delay. So, for achieving better performance, burst assembly algorithm should produce bursts with less variation when utilizing the network resources.
In [12], an adaptive burst-length-based assembly algorithm is proposed. In this study, the threshold value increases if the generated burst length exceeds a pre-defined upper limit or decreases when the length is lower then the lower limit. By this way, the threshold value changes according to the traffic statistics so that burst lengths with lower variation are generated improving the performance for OBS networks.
Up to now, assembly algorithms have been set and updated the threshold values according to the incoming traffics’ characteristics. However, the network performance depends on not only traffic characteristic but also many other para-meters such as processing delay of BCP or congestion in the control plane or link utilization. In [13], the timeout and burst-length threshold is decided according
to satisfying the previously mentioned network conditions. This algorithm starts with sensing the incoming traffic rate and forms the functions of link utilization, loss rate and delay bound of control packets by using the incoming traffic rate and the threshold values as parameters. In the final step, the algorithm sets the minimum required timeout and threshold value in order to optimize these functions. However, when the algorithm forms these functions of network pa-rameters, this study uses only incoming traffic rate and the threshold values at that ingress node. But, this assumption is only valid when these traffics do not meet another traffic coming from other ingress nodes.
2.3
Path Length and Burst Length Priority
Ef-fects
In OBS networks, since BCPs are processed electronically at each core node for reserving the network resources, ingress nodes wait an offset time before sending the data burst after sending the BCP. This offset time must be at least equal to the product of the hop number of the routing path and PHPD that is the sum of required time for O/E/O conversion and the processing delay of BCPs.
Since BCPs are delayed at each core node but data bursts transverse through the node without any delay, the offset time decreases as the data burst passes through each core node. So, a burst with less remaining hops to its destination has lower residual offset time [17]. In [18], it has been proposed that since higher offset time means earlier reservation of wavelengths for data bursts, the bursts with higher residual offset times experiences lower burst loss rates. So, in [17], it has been proposed that, since the residual offset time decreases when the data burst reaches to its destination, the loss probability increases as well, which is called Path Length Priority Effect (PLPE).
In [17], the proposed solution for this drawback is using FDL-based scheme. When FDL-based scheme is used in OBS networks, the data burst is delayed by transferring through an FDL before it passes through each core node. Since BCPs are also delayed as mentioned before, the proposed scheme fixes the residual offset times when data burst follows its route. As a result, new scheme eliminates the PLPE by fixing the residual offset times. However, the processing delay at the core nodes may not be constant all the time which cannot work well with FDLs. Accordingly, a new distributed algorithm called Monitoring Group Drop
Prob-ability (MGDP) is proposed to alleviate the PLPE [19]. In this algorithm, each
core node classifies the incoming traffic into groups considering the residual off-set times of the flows and calculates the burst drop rates of the groups. At each scheduling event, if scheduling algorithm successfully schedules the upcoming burst, then core node runs the algorithm. The algorithm decides either to final-ize the scheduling or to drop the upcoming burst. The algorithm decides to drop the burst when the average drop rate of the group of that burst is lower then the overall loss rate at that node. With this decision, the algorithm increases the average drop rates of the groups with low drop rates and decreases the average drop rates of the groups with high drop rates. So, the algorithm is trying to increase fairness by pushing the drop rates close to the overall drop rate.
However, when void filling scheduling algorithms, such as LAUC-VF, is used at the core nodes, the burst loss rates of the flows not only depend on residual offset times but also depend on burst lengths. Therefore, the unfairness is not only formed by PLPE but also burst length priority effect (BLPE). In [20], in the first step, the algorithm groups the traffics according to residual offset times as in [19]. In the second step, the algorithm separates these groups into subgroups according to the burst length of the traffics. The proposed scheduling algorithm eliminates the adverse effects of PLPE and BLPE on fairness by pushing the drop rates close to the overall drop rate as in [19]. However, the algorithm
Figure 2.1: Chain Network Topology
penalizes the traffics with low drop rates to conserve the fairness. When the network is not heavily loaded, this algorithm deteriorates the performance of the OBS network. Also, the proposed algorithm increases the processing delays of control packets, which in turns increases the PHPD. This increase lengthens the difference between the residual offset times and increases the effects of PLPE and BLPE on fairness between the performances of disadvantaged flows and the contending flows.
2.4
Analysing The Burst Length Effect on
Burst Loss Rates
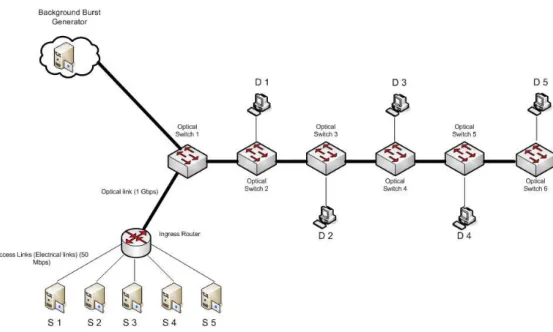
In this part, before we propose a new burst assembly algorithm to reduce the burst loss rates by shortening the burst lengths, the burst length effect on burst loss rates will be investigated. In order to analyze the effect of burst length on burst loss rates, a typical chain network scenario is constructed as shown in Figure 2.1. The simulations are performed at ns2 [22] based OBS network simulator, which is called n-OBS [23], using JET with LAUC-VF scheduling algorithm.
In this scenario, there are five UDP flows attached to the ingress node. Each UDP flow has different destination nodes. The competing traffic is produced by a Background Burst Generator (BBG) which creates bursts according to a Poisson process with rate λ where burst lengths are exponentially distributed with mean 1/µ. Before BBG transmits the bursts, it randomly chooses the destinations of the bursts with uniform distribution between the destinations of the UDP flows. With this scenario, we are able to create a bottleneck link between optical core node 1 and 2 where UDP flows and the traffic produced by BBG merge.
Two bursts to be transmitted over the same link may have different residual offset times since the number of hops toward their respective destinations may be different. In such a situation, the burst with lower residual offset time expe-riences higher burst loss rates. Moreover, this burst expeexpe-riences a burst length dependent loss probability since this burst may need to fit into void formed by other reservations that have made earlier. We call the flows that have lower residual offset times than the residual offset times of the contending flows at a congested node, as disadvantaged flows. In this scenario, each UDP flow has different hop number to their destinations resulting in different residual offset times at optical switch 1. In Figure 2.1, S1 − D1 flow has the lowest residual
offset time at the bottleneck link in all flows, is followed by S2− D2, S3− D3,
S4− D4, S5 − D5 flows. The UDP flows with lower residual offset times than
the residual offset times of the contending flows transmitted by BBG, which are
S1− D1, S2 − D2, S3 − D3, S4 − D4, are disadvantaged flows in this scenario.
This difference at the residual offset times gives an opportunity to understand the burst loss rate dependency on burst lengths.
The traffic rate between each source destination pair Si− Di is fixed. At the
ingress node, fixed timer based assembly period is used.However, we tested the scenario for different timeout values. The average of burst length of UDP flows are controlled with managing the timeout value.
0 5 10 15 20 25 29 30 31 32 33 34 35 36 37 38 39 40 Timeout (ms) Throughput (Mbps) Throughput Vs Timeout S1 − D1 S2 − D2 S3 − D3 S4 − D4 S5 − D5
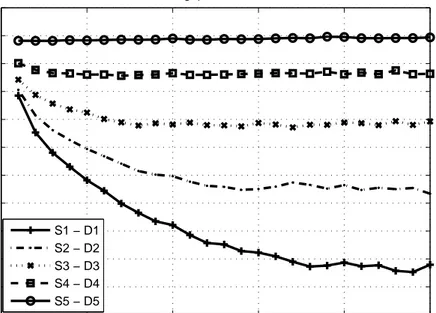
Figure 2.2: Throughput of UDP Flows in Chain Network with P HP D = 50µsec, BBG rates are λ = 8.5burstspersecond, µ−1 = 1.5msec, UDP flow rate M =
40Mbps 0 5 10 15 20 25 29 30 31 32 33 34 35 36 37 38 39 40 Timeout (ms) Throughput (Mbps) Throughput Vs Timeout S1 − D1 S2 − D2 S3 − D3 S4 − D4 S5 − D5
Figure 2.3: Throughput of UDP Flows in Chain Network with P HP D = 100µsec, BBG rates are λ = 8.5burstspersecond, µ−1 = 1.5msec, UDP flow
Figures 2.2 and 2.3 show the performance of the five UDP sources with chang-ing timeout at the burst assembler for PHPD = 50µsec and 100µsec, respectively. Since the burst length is directly proportional to the timeout of the burst assem-bler, the increasing timeout result in an increase of the burst length. The most pronounced observation is the decrease of the throughput of disadvantaged flows when the average burst length is increasing. As in Figure 2.2, S1− D1 flow with
the lowest residual offset time at the bottleneck link has the most considerable drop at the throughput. The second major drop occurs for S2 − D2 flow whose
residual offset time is the second lowest. Since the slopes of the drops are get-ting sharper as the difference of the residual offset times increases, we state that the average burst length effect on burst loss rates is influenced by the differ-ence between residual offset times of the disadvantaged flows and the competing traffic.
Furthermore, since S5−D5flow’s residual offset time has the same magnitude
with the highest residual offset time of the competing traffic, this flow is the only flow that is not a disadvantaged flow at the bottleneck link in this scenario. We observe, from Figures 2.2 and 2.3 that S5− D5 flow is the only flow whose
throughput is independent of the burst length.
One more important observation is that when throughput graphs in Figures 2.2 and 2.3 are compared, the slope and the amount of the drops in the through-put of the disadvantaged flows are larger when PHPD = 100µsec. From this ob-servation, we conclude that as PHPD increases, which results in increase at the difference of the residual offset times of the disadvantage flows and the competing traffic, the burst length effect on burst loss rates becomes more pronounced.
Congestion in the OBS control plane is one of the main limiting factors on the performance of OBS networks. Up to now, the studies in the literature only try to clarify this problem in detail and identify the restrictions on network pa-rameters, such as minimum possible length of the generated bursts or maximum
possible number of wavelengths at the data plane [14],[16]. On the other hand, the proposed adaptive burst assembly algorithms only focuse on the incoming traffic parameters for improving the performance of the OBS network [11],[13]. In this thesis, we propose a new adaptive timer-based burst assembly algorithm that focuses on the performance of OBS network when considering the congestion in the OBS control plane.
With this algorithm, we also alleviate the fairness problem due to PLPE and BLPE. Furthermore, the studies on this fairness problem try to annihilate this problem with new scheduling algorithms at the core nodes [17],[20]. However, these algorithms deteriorate the performance of OBS networks when the network is not heavily loaded since the algorithm penalizes flows which have low drop rates. Also, these algorithms increase the processing delays of the control packets since they increase the complexity of the scheduling algorithm. This increase results in long PHPD and increases the effect of PLPE and BLPE on performance of OBS networks.
In the next chapter, we propose a new adaptive timer-based burst assembly algorithm (ATBA) in detail. In the first part of the chapter, a new signaling procedure and ATBA are discussed in detail. The new control mechanism for ingress nodes is described in the next part. In the final part, we represent the performance of OBS networks with ATBA.
Chapter 3
ATBA: A New Adaptive
Timer-Based Assembly
Algorithm
In this chapter, we propose a new adaptive timer-based burst assembly algorithm (ATBA) in detail. In the first part, a new signaling procedure and the outline of ATBA is analyzed in detail. The new control mechanism for ingress node is men-tioned in the next part. Finally, we represent the performance of OBS networks when ATBA become active. Moreover, in the final part, we test compatibility of ATBA to the changing network conditions and represent an application of the algorithm on OBS networks with QoS.
3.1
Signalization Procedure and Adaptive
As-sembly Algorithm
impor-disadvantaged flows and the other is the limitation by the control plane. In order
to achieve higher performance through the OBS network, our aim is shorten-ing the burst lengths of the disadvantaged flows that favors the burst loss rates. However, this action increases the number of generated bursts which results in an undesirable rise in the number of generated BCPs, which can penalize the systems throughput by the limitations of the control plane. Therefore, the burs-tification algorithm should consider limiting the total number of generated bursts at the ingress node in order to avoid congestion in the control plane while trying to reduce the burst loss rates of the disadvantaged flows.
For achieving these goals, we set the total burst generation rate (BGR) con-stant at each ingress node while trying to reduce the burst loss rates of the
disadvantaged flows by shortening the burst lengths. The proposed algorithm,
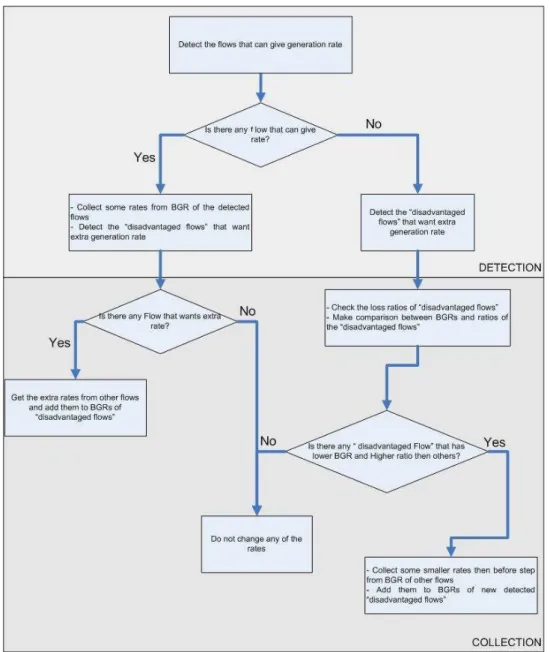
Adaptive Timer-Based Assembly Algorithm (ATBA) borrows some amount of rates from other burstifiers at the same ingress node and adds these collected rates to the burstifiers of disadvantaged flows. This distribution of BGRs is gov-erned by two basic parts: the first part is the Detection part which is responsible to detect disadvantaged flows and determine the flows that can give BGRs. In the second part, which is called the Collection part, ATBA collects the extra rates and distribute to the detected burstifiers.
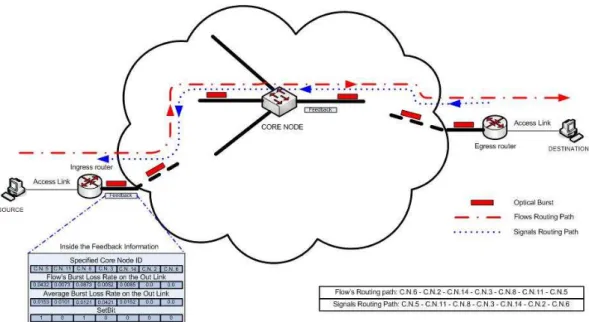
In the Detection part, ATBA uses network statistics of the flows that are collected from the core nodes on the routes of the flows. To get this information a synchronous signaling mechanism is implemented in the OBS network between the egress and ingress nodes. In each signaling period, each egress node records the ingress nodes and the routes of the bursts that are disassembled in that node. When this signaling period is completed, each egress node starts signaling with transmitting empty packets over the control plane in the reverse direction of the routes of flows to each ingress node that have been recorded.
Figure 3.1: Signaling Scheme for ATBA
When this signaling packet passes through each core node, there are three statistics, which are already calculated by core nodes, written in the packets. These are burst loss rate of the flow (BLRF) at that core node, the average loss rate of the outgoing link (ABLL) that flow uses and the ’Setbit’ information which is used for deciding whether the flow is a disadvantaged flow or not. To make this decision, each core node checks the residual offset times of the other flows that are competing with that flow. If one of these flows has higher residual offset time than the examined flow, then the core node decides that this flow is a disadvantaged flow and sets the ’Setbit’ to one. This signalization is shown in more detail in Figure 3.1.
Each packet collects these three statistics from each core node on the path in the reverse order and reaches the last node i.e., the ingress node. Before ATBA starts to redistribute the BGRs, each ingress node should wait all packets of the flows whose bursts are assembled at the node.
When the last information packet reaches the ingress node, the node starts ATBA with Detection part to update the BGRs. In the first step of Detection part, the algorithm detects bottleneck links of all flows. A bottleneck link limits
the performance of the flow, since flow has the higher BLRF at that link than the other links along the routing path. After that, ATBA takes all the statistics of these flows at the bottleneck links and tries to notice the flows that are
disad-vantaged by checking the ’Setbit’ information of flows. After the Detection part,
there are three possible cases can happen.
In the first case, none of the flows can be disadvantaged flow which means that their burst loss rates are not dependent on burst lengths. Therefore, ATBA decides that there is no need to collect any rate from burstifiers and remains the rate distribution between bustifiers unchanged.
In the second case, there are both disadvantaged flows that want extra BGRs and flows, which are not disadvantaged flows that can give BGRs. In this case, before collecting the extra BGRs from the burstifiers ATBA, calculates a ratio between BLRF and ABLL of each disadvantaged flow. These ratios (DNRs) are comprehended as the degree of need for extra rate for the burstifiers of
disadvan-taged flow. After this calculation, in the Collection part, ATBA tries to cover
the BGR needs considering that higher DNR means more need for extra BGR and distributes the collected BGRs according to these DNRs to the assigned burstifiers.
Parameters used in Pseudo Code of ATBA
BLRFi = Burst loss rate of ithflow at its bottleneck link
ABLLi = Average loss rate of the outgoing link at the bottleneck link of ithflow Delta = Total possible BGR change in one signalling period
BGRmin = Minimum possible BGR assigned the burstifier BGRmax = Maximum possible BGR assigned the burstifier
Search for all i {
DN Ri= BLRFi/ABLLi;
%Setting the burstifiers that can give BGR
if (Setbiti= 0) {
if (BGRi> BGRmin){ Deci= 1 }
else { Deci= 0 }
}
%Setting the burstifiers that need extra BGR
if (Setbiti= 1){ if (BGRi< BGRmax){ Inci= 1 DN RT otal= DN RT otal+ DN Ri } else { Inci= 0 } } } %Case 2 if ( sum(Deci)>= 1){ if (sum(Inci)>= 1){
Search for all i{
if ( Deci= 1){ BGRi= BGRi- (Delta/sum(Deci))}
if ( Inci= 1){ BGRi= BGRi+ (Delta ∗ DN Ri/DN RT otal)}
} } } %Case 3 if ( sum(Deci)= 0){ ExtraBGRT otal= 0 Search for all i{
if ( Inci= 1){ ExtraBGRT otal = ExtraBGRT otal+ (BGRi- BGRstart)}
}
Search for all i{
if (((BGRi- BGRstart)/ExtraBGRT otal) > (DN Ri/DN RT otal) ){
Inci= 0 Deci= 1 } } if ( sum(Deci)>= 1){ if (sum(Inci)>= 1){
Search for all i{
if ( Deci= 1){ BGRi= BGRi- 0.2 ∗ (Delta /sum(Deci))}
if ( Inci= 1){ BGRi= BGRi+ 0.2 ∗ ((Delta /sum(Inci))}
} } } }
Figure 3.2: Flow Chart of ATBA
In the final case, if all flows are disadvantaged flows, ATBA calculates the DNRs of all flows again. Then, the procedure tries to keep fairness between the
disadvantaged flows by checking the DNRs. If ATBA decides that some flows
have higher BGRs than other flows but lower DNRs, which means some flows have higher BGR than their needs, then ATBA borrows some small amount of BGR from these flows and distributes these collected BGRs to the other flows uniformly. The flow chart of ATBA is shown in Figure 3.2and the pseudo code of ATBA is given in Algorithm 3.1.
As a result, ATBA is capable of distributing all available BGR to the flows considering the burst length dependency of burst loss rates. This new approach gives flexibility to control the burst lengths of the flows to increase the throughput of the disadvantaged flows. Furthermore, the congestion at the control plane is taken care by the limitation on the BGR budget at each ingress node.
3.2
Rate Control Mechanism
With ATBA, each ingress node is capable of changing the distributions of the BGRs at each burstifier based on the collected network statistics. In this chapter, the role of BGRs on burstifiers is described in detail. At each ingress nodes, there is a Rate Control Mechanism (RCM) which is authorized to deal and assign the BGRs of each burstifier. Each RCM at ingress nodes has two main parts. In the first part, the task of Rate Dealer (RD) is to deal a total burst generation rate to the Token Buckets (TBs) of each active burstifier. With ATBA, RD can manage the BGRs of the burstifiers.
The second part consists of an adaptation of Token Bucket Algorithms (TBA) running in each TBs which are attached to assigned burstifiers. The main ser-vice of TBA is to limit the total number of generated bursts in each burstifier with allocated BGR. When TB is dealing with limiting the number of generated bursts, burstifier continues to collect the electrical packets and generates new bursts with the decision of Burst Assembler, which uses fixed timer based as-sembly algorithm. After Burst Assembler becomes ready to transmit the burst, TB can decide either to transmit the burst or to delay the burst transmission. When TB decides to delay the burst transmission, the burstifier continues to collect incoming electronic packets until the new token comes. In Figure 3.3, Rate Control Mechanism and the graphics of two parts are depicted.
Figure 3.3: Rate Control Mechanism in the Ingress Routers in OBS Networks With RD, RCM is able to distribute the total BGRs between the active burstifiers while conserving the performance of the disadvantaged flows. At the same time, RCM can limit the number of generated bursts at each burstifier with TBs in order to avoid congestion of the control plane.
3.3
Simulation Results
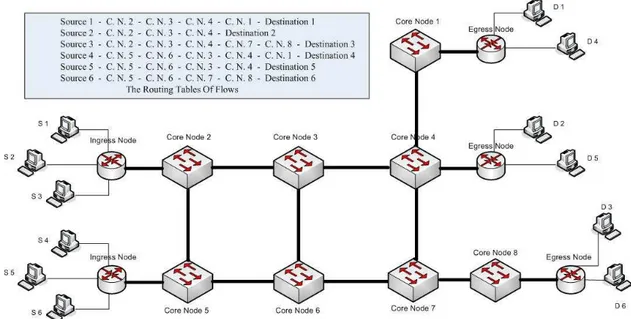
For testing new rate controller mechanism with ATBA, a mesh topology scenario is constructed as shown in Figure 3.4. In this scenario, each access link, which is connected to the ingress nodes, has a capacity of 250 Mbps. Every source produces 5 different UDP connections to the specified destinations in the Figure 3.4. Each of the UDP sources produces 50 Mbps traffic on the average into the network, opens and closes with exponentially distributed times with rates
Figure 3.4: Mesh Scenario used as Simulation Topology
one wavelength. This scenario is run in two different conditions. In the first run, RDs deal the BGRs uniformly between the active burstifiers. In the second simulation, ATBA starts to act in RDs and RDs deal the BGRs to the burstifiers when ATBA is protecting the disadvantaged flows.
As in the routing table shown in Figure 3.4, two traffics from different ingress nodes collide at the link between CN 3 and CN 4. Since the number of remaining hops to destination of S3 − D3 flow is the biggest, it has the highest residual
offset time in that bottleneck link. Moreover, S2 − D2 and S5 − D5 flows have
the same residual offset times which are lower then the residual offset times of
S1− D1 and S4− D4 flows. So, S2− D2, S4− D4 and S5− D5 flows can be called
as disadvantaged flows in this scenario.
3.3.1
Effect of ATBA on Burst Length Distribution
Before examining the effect of ATBA on the performance of the flows, the effect of ATBA on the burst length distribution of the UDP flows will be analyzed. Since, each UDP flow opens and closes with exponentially distribution durations,
the change of the timeout value changes the average of the burst lengths of the generated bursts. In this scenario, timeout is set to a very small value ² and BGR for each ingress node is set to 1200 bursts per second. Since, timeout is too small and finishes rapidly, the burstifier continues aggregation procedure until new token comes to the TB. So, ATBA will be able to change the burst distribution when it changes the BGR at each burstifier. The PHPD is set to 400
µsec in the simulation and UDP flows transfer at a rate of 250 Mbps data with
opening and closing rates α−1= 1.6 msec and θ−1 = 0.4 msec which corresponds
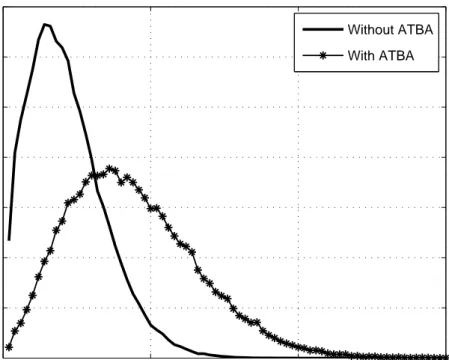
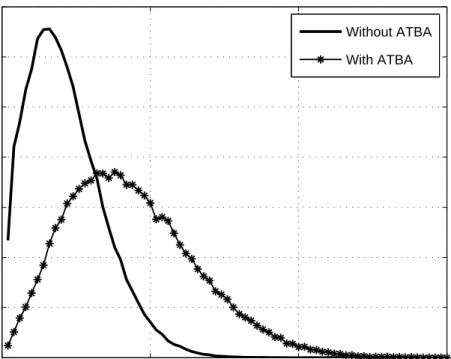
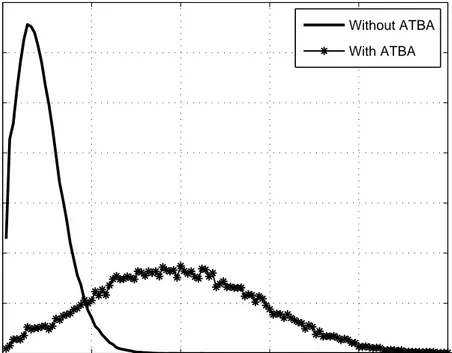
to an average rate of 50 Mbps for each UDP source destination pair. Normalized Production Rates, which are the ratios between the numbers of bursts contain the same number of packets and total number of bursts are depicted in the Figures 3.5-3.10 for different source-destination pairs.
From the Figures 3.5-3.10, the changes in the burst length distribution of the UDP flows can be observed. The burst lengths of the disadvantaged flows, which are S2 − D2, S4 − D4 and S5 − D5 flows, are shortened when ATBA is
used in RD. However, since the total number of produced bursts at same ingress node is limited, ATBA uses some of BGRs of the other flows to shorten the burst lengths of disadvantaged flow. This lengthens the average burst lengths of
S1− D1 , S3− D3 and S6− D6 flows.
3.3.2
Effect of ATBA on Performance of OBS Network
In Figures 3.11-3.22 the burst loss rates and the throughputs of the UDP flows are analyzed. In this scenario, PHPD changes from 50 µsec to 800 µsec so that the change in the burst loss rates of disadvantaged flows and other flows can be analyzed when the difference between the residual offset times of the competing traffics changes.
0 50 100 150 0 0.01 0.02 0.03 0.04 0.05 0.06 0.07
Number of Electronic Packets in Assembled Bursts
Normalized Production Rate
Burst Histogram S1−D1 Flow
Without ATBA With ATBA
Figure 3.5: Burst Histogram of S1− D1 Flow
0 50 100 150 0 0.02 0.04 0.06 0.08 0.1 0.12 0.14 0.16
Number of Electronic Packets in Assembled Bursts
Normalized Production Rate
Burst Histogram S2−D2 Flow
Without ATBA With ATBA
0 50 100 150 0 0.01 0.02 0.03 0.04 0.05 0.06 0.07
Number of Electronic Packets in Assembled Bursts
Normalized Production Rate
Burst Histogram S3−D3 Flow
Without ATBA With ATBA
Figure 3.7: Burst Histogram of S3− D3 Flow
0 50 100 150 0 0.01 0.02 0.03 0.04 0.05 0.06 0.07 0.08 0.09
Number of Electronic Packets in Assembled Bursts
Normalized Production Rate
Burst Histogram S4−D4 Flow
Without ATBA With ATBA
0 50 100 150 0 0.01 0.02 0.03 0.04 0.05 0.06 0.07 0.08 0.09 0.1
Number of Electronic Packets in Assembled Bursts
Normalized Production Rate
Burst Histogram S5−D5 Flow
Without ATBA With ATBA
Figure 3.9: Burst Histogram of S5− D5 Flow
0 50 100 150 200 250 0 0.01 0.02 0.03 0.04 0.05 0.06 0.07
Number of Electronic Packets in Assembled Bursts
Normalized Production Rate
Burst Histogram S6−D6 Flow
Without ATBA With ATBA
Without ATBA, when we are increasing PHPD, the burst loss rates of
dis-advantaged flows raises as seen in Figures 3.14, 3.18 and 3.20, which results in a
major drop of the throughput of these flows as shown in Figures 3.13, 3.17 and 3.19, respectively. When ATBA becomes active, 6% drop of burst loss rates and 10% raise of throughput are achieved for disadvantaged flows.
One more important result is that when we are forcing the burst loss rates to stay low by increasing the number of successfully scheduled bursts of
disad-vantaged flows, the throughputs of other competing flows are not reduced, even
if other flows, such as S1 − D1 or S2 − D2 flows, have the same residual offset
times with disadvantaged flows.
Since disadvantaged flows are the tender flows when a contention occurrs at the bottleneck links, the burst loss rates of these flows are higher which results in lower throughput for these flows. Favoring the burst loss rates of disadvantaged
flows without penalizing the throughput of the intersecting flows also improves
the total throughput of OBS system as shown in Figure 3.23.
Without ATBA, the burst loss rates of disadvantaged flows are higher than the competing flows, which in turn lowers the fairness of the throughput distribution between the flows. When ATBA favors the burst loss rates of disadvantaged
flows, it also improves the max-min fairness in the system as shown in Figure
3.24 from 76% to 85%.
3.3.3
Adaptation of ATBA to Changes in Network Traffic
So far, the effect of ATBA on the steady-state performance of disadvantaged
flows has been discussed. We now discuss the transient performance of ATBA
to changing network conditions can be examined. The previous scenario is kept same with the only difference that one of the flows, S3 − D3 flow, opens 500
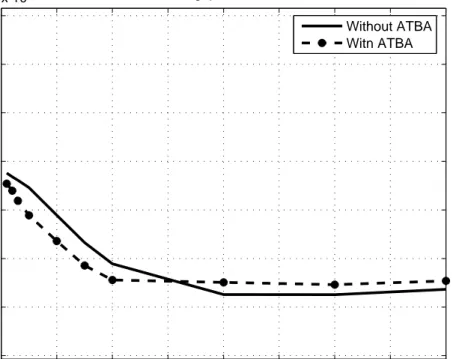
0 100 200 300 400 500 600 700 800 4.3 4.4 4.5 4.6 4.7 4.8 4.9 5x 10 7 Throughput S−1 D−1
Per Hop Processing Delay (µsec)
Troughput (bits per second)
Without ATBA Witn ATBA
Figure 3.11: Throughput of S1− D1 Flow
0 100 200 300 400 500 600 700 800 0 0.02 0.04 0.06 0.08 0.1 0.12
Burst Loss Rates S−1 D−1
Per Hop Processing Delay (µsec)
Burst Loss Rates
Without ATBA Witn ATBA
0 100 200 300 400 500 600 700 800 4.2 4.3 4.4 4.5 4.6 4.7 4.8 4.9 x 10⁷ Throughput S−2 D−2
Per Hop Processing Delay (µsec)
Troughput (bits per second)
Without ATBA Witn ATBA
Figure 3.13: Throughput of S2− D2 Flow
0 100 200 300 400 500 600 700 800 0.04 0.06 0.08 0.1 0.12 0.14 0.16
Burst Loss Rates S−2 D−2
Per Hop Processing Delay (µsec)
Burst Loss Rates
Without ATBA Witn ATBA
0 100 200 300 400 500 600 700 800 4.3 4.4 4.5 4.6 4.7 4.8 4.9 5 x 10⁷ Throughput S−3 D−3
Per Hop Processing Delay (µsec)
Throughput (bits per second)
Without ATBA Witn ATBA
Figure 3.15: Throughput of S3− D3 Flow
0 100 200 300 400 500 600 700 800 0.02 0.04 0.06 0.08 0.1 0.12 0.14
Burst Loss Rates S−3 D−3
Per Hop Processing Delay (µsec)
Burst Loss Rates
Without ATBA Witn ATBA
0 100 200 300 400 500 600 700 800 4 4.1 4.2 4.3 4.4 4.5 4.6 4.7 x 10⁷ Throughput S−4 D−4
Per Hop Processing Delay (µsec)
Throughput (bits per second)
Without ATBA With ATBA
Figure 3.17: Throughput of S4− D4 Flow
0 100 200 300 400 500 600 700 800 0.08 0.1 0.12 0.14 0.16 0.18 0.2
Burst Loss Rates S−4 D−4
Per Hop Processing Delay (µsec)
Burst Loss Rates
Without ATBA Witn ATBA
0 100 200 300 400 500 600 700 800 3.6 3.7 3.8 3.9 4 4.1 4.2 4.3x 10 7 Throughput S−5 D−5
Per Hop Processing Delay (µsec)
Troughput (bits per second)
Without ATBA Witn ATBA
Figure 3.19: Throughput of S5− D5 Flow
0 100 200 300 400 500 600 700 800 0.16 0.18 0.2 0.22 0.24 0.26
Burst Loss Rates S−5 D−5
Per Hop Processing Delay (µsec)
Burst Loss Rates
Without ATBA Witn ATBA
0 100 200 300 400 500 600 700 800 4.3 4.4 4.5 4.6 4.7 4.8 4.9 5x 10 7 Throughput S−6 D−6
Per Hop Processing Delay (µsec)
Troughput (bits per second)
Without ATBA Witn ATBA
Figure 3.21: Throughput of S6− D6 Flow
0 100 200 300 400 500 600 700 800 0 0.02 0.04 0.06 0.08 0.1 0.12
Burst Loss Rates S−6 D−6
Per Hop Processing Delay (µsec)
Burst Loss Rates
Without ATBA Witn ATBA
0 100 200 300 400 500 600 700 800 2.75 2.76 2.77 2.78 2.79 2.8 2.81 2.82 2.83x 10
8 Total Systems Throughput
Per Hop Processing Delay (µsec)
Throughput (bits per second)
Without ATBA With ATBA
Figure 3.23: Total Throughput of OBS Network
0 100 200 300 400 500 600 700 800 0.74 0.76 0.78 0.8 0.82 0.84 0.86 0.88 0.9
Systems Max−Min Fairness
Per Hop Processing Delay (µsec)
Fairness
Without ATBA Witn ATBA
again. In the first period before the S3−D3 flow opens, only S2−D2and S5−D5
are the disadvantaged flows at the bottleneck link. After S3 − D3 flow opens,
S4− D4 flow also becomes a disadvantaged flow. In the final period, the network
turns to the first condition.
In the simulation, BGR for each ingress node is set to 1200 bursts per second and the timeout is set to ². PHPD is set to 400 µsec. When we are constructing the throughput graphs, we smoothen the goodput values by using Exponential Moving Average (EMA) as in Equation (3.1) where n is the time index, T is the throughput of the flow and γ = 1/8 is the averaging constant.
Tnew
n = γTnew(n−1)+ (1 − γ)Told(n) (3.1)
In Equation (3.1), Told
(n) is the successfully transferred data at time n and
Tnew
n is the smoothened value at that time portion. The smoothened graphs of
BGR distribution at each ingress node are shown in the Figures 3.25,3.26. In the Figures 3.27-3.32, the throughputs of the UDP sources as the time elapses are shown.
Before the S3−D3 flow starts to transmit data, ATBA improves the
through-put of two disadvantaged flows S2 − D2 and S5 − D5 flows as shown in Figures
3.28 and 3.31. After the S3−D3 flow starts to transmit data, then one more flow,
S4− D4 flow, becomes a disadvantaged flow on that bottleneck link. However,
ATBA changes the rate distributions according to new condition and protects the performance of the new disadvantaged flow without penalizing throughputs of the other competing flows. After S3− D3 flow stops to transmit data, ATBA
adapts the rate distributions and achieve the same improvement as in first period. In conclusion, we deal with two important parameters that effect the perfor-mance of OBS networks: the burst length dependent burst losses of the
0 100 200 300 400 500 600 700 800 900 1000 1100 1200 1300 1400 1500 0 200 400 600 800 1000 1200
Burts Generation Rates (BGR) Per Burstifier
Time (seconds)
Burts Generation Rates (BGR)
BGR S 1−D1 BGRS 2−D2 BGR S 3−D3
Figure 3.25: BGR Distribution at Ingress Node 1
0 100 200 300 400 500 600 700 800 900 1000 1100 1200 1300 1400 1500 0 200 400 600 800 1000 1200
Burts Generation Rates (BGR) Per Burstifier
Time (seconds)
Burts Generation Rates (BGR)
BGR S 4−D4 BGR S 5−D5 BGR S 6−D6
200 400 600 800 1000 1200 1400 40 41 42 43 44 45 46 47 48 49 50 Time (seconds) Throughput (Mbps) S1−D1 Throughput vs Time Without ATBA With ATBA
Figure 3.27: Adaptation of ATBA - Throughput of S1− D1 Flow
200 400 600 800 1000 1200 1400 40 41 42 43 44 45 46 47 48 49 50 Time (seconds) Throughput (Mbps) S2−D2 Throughput vs Time Without ATBA With ATBA
0 500 1000 1500 0 5 10 15 20 25 30 35 40 45 50 Time (seconds) Throughput (Mbps) S3−D3 Throughput vs Time Without ATBA With ATBA
Figure 3.29: Adaptation of ATBA - Throughput of S3− D3 Flow
200 400 600 800 1000 1200 1400 40 41 42 43 44 45 46 47 48 49 50 Time (seconds) Throughput (Mbps) S4−D4 Throughput vs Time Without ATBA With ATBA
200 400 600 800 1000 1200 1400 34 36 38 40 42 44 46 48 50 Time (seconds) Throughput (Mbps) S5−D5 Throughput vs Time Without ATBA With ATBA
Figure 3.31: Adaptation of ATBA - Throughput of S5− D5 Flow
200 400 600 800 1000 1200 1400 40 42 44 46 48 50 52 Time (seconds) Throughput (Mbps S6−D6 Throughput vs Time Without ATBA With ATBA
major improvement at the throughputs of disadvantaged flows without penaliz-ing the throughputs of other flows that are intersectpenaliz-ing with disadvantaged flows. By increasing the throughput of disadvantaged flows, we also increase max-min fairness index and total throughput of the OBS network. In the final simulation, we also demonstrate that ATBA successfully adapts to changing network traffic conditions.
3.4
Application of ATBA on OBS Network with
Offset-Based QoS
ATBA improves the performances of the disadvantaged flows without penalizing the other competing flows, thus achieves higher total network throughput and overall fairness. ATBA achieve all these without increasing the congestion in the control plane. We now discuss how ATBA can be used when offset based QoS is applied. Firstly, we double the number of UDP flows in each source destination pair marking half of them as high priority flows (HPFs) and assign the rest as low priority flows (LPFs). Since, offset based QoS is applied, the offset time of HPFs have an extra term (ETQoS) as shown in Equation (3.2) where H is the
number of hops in the routes.
HpOffsetTime = ETQoS+ LpOffsetTime (3.2)
where
LpOffsetTime = H ∗ PHPD (3.3)
When ETQoS is set to a value more than the addition of the maximum burst
length of the LPFs and maximum possible LpOffsetTime, then full isolation between two different priority classes is achieved. Full isolation means when a