Mechanical, electronic, and optical
properties of the A
4
B
6
layered ferroelectrics:
ab initio calculation
Husnu Koc1, Sevket Simsek2, Selami Palaz3, Oral Oltulu3, Amirullah M. Mamedov*,4,5, and Ekmel Ozbay4 1 Siirt University, Faculty of Science and Letters, Department of Physics, 56000 Siirt, Turkey
2 Hakkari University, Faculty of Engineering, Department of Material Science and Engineering, 3000 Hakkari, Turkey 3 Harran University, Faculty of Science and Letters, Department of Physics, 63000 Sanliurfa, Turkey
4 Bilkent University, Nanotechnology Research Center, 06800 Ankara, Turkey 5 Baku State University, International Scientific Center, Baku, Azerbaijan Received 20 September 2014, revised 24 March 2015, accepted 25 March 2015 Published online 6 May 2015
Keywords ab initio calculation, electronic structure, mechanical properties, optical properties
* Corresponding author: e-mail [email protected], Phone: +90 312 290 19 66, Fax: +90 312 266 40 42
We have performed a first principles study of the struc-tural, elastic and electronic properties of orthorhombic SnS and GeS compounds using the density functional theory within the local density approximation. The sec-ond-order elastic constants have been calculated, and the other related quantities such as the Young’s modulus, shear modulus, Poisson’s ratio, anisotropy factor, sound velocities, Debye temperature, and hardness have also been estimated in the present work. All of the calculated modulus and Poisson’s ratio for SnS were less than the same parameters for GeS. Our calculations have discov-ered the large anisotropy of elastic parameters in the (100) and (010)-planes for both compounds. The band
structures of orthorhombic SnS and GeS have been cal-culated along high symmetry directions in the first Bril-louin zone (BZ). The calculation results for the band gap of Sn(Ge)S gave Eg=0.256 eV (0.852 eV) and has an in-direct character for an interband transition. The real and imaginary parts of dielectric functions and (by using these results) the optical constant such as energy-loss function, the effective number of valance electrons and the effective optical dielectric constant were calculated. All of the principal features and singularities of the di-electric functions for both compounds were found in the energy region between 2 eV and 20 eV.
© 2015 WILEY-VCH Verlag GmbH & Co. KGaA, Weinheim
1 Introduction SnS and GeS, the members of compounds
with the general formula A4B6 (A=Ge, Sn, Pb and B=S, Se, Te), are the metal chalcogenide structures with an ortho-rhombic layered crystal structure. SnS and GeS structures consist of double layers of atoms, with each Ge (Sn) atom coordinated by two S atoms in the plane of the layer [1]. These compounds possess an orthorhombic crystal struc-ture with eight atoms per unit cell belonging to the space group Pnma. These layered semiconductors have been at-tracting the attention of scientists because of their potential application in optoelectronic devices [2].
In the past, some detailed works [1-7] have been carried out on the structural and electronic properties of these compounds. Rathor et al. [3] presented the bands and den-sity of states (DOS) using the Hartree-Fock, denden-sity func-tional and pseudopotential schemes. Gashimzade et al. [4]
calculated the phonon modes of IV-VI semiconductor crys-tals (GeS, GeSe, SnS, and SnS) using the density func-tional perturbation theory (DEPT). Waghmare et al. [5] calculated the phonon frequencies, electron localization lengths, Born effective charges, dielectric response, and conventional electronic structures of the IV-VI chalco-genide series using the first principle density functional theory. Wiedemeier et al. [6] refined the structures of GeS, GeSe, SnS, and SnSe using the X-ray diffractometer. Malone et al. [7] performed the electronic structures of SnS and GeS materials using the density functional theory calculation. Band gap corrections of these materials are computed within the GW approximation. Rajagopalan et al. [2] investigated the structural behaviour of SnS under pres-sure using the first principle density functional calculations. Ettoma et al. [1] presented the electronic band structure of
SnS using the ab initio band structure calculation and pho-toelectron spectroscopy methods.
As far as we know, no ab initio general potential calcula-tions of the mechanical properties and detail optical prop-erties such as the energy-loss function, the effective num-ber of valance electrons and the effective optical dielectric constant along the main crystallographic axes of the SnS and GeS have been reported. The main purpose of this work is to provide some additional information on the ex-isting features of SnS and GeS by using the density func-tional theory. Therefore, in this work, we have investigated the structural, electronic, mechanical, and photon energy-dependent optical properties of the SnS and GeS crystals. The method of calculation is given in Section 2; the results are discussed in Section 3. Finally, the summary and con-clusion are given in Section 4.
2 Model and method
Our calculations have been performed using the density functional formalism and local density approximation (LDA) [8] through the Ceperley and Alder functional [9] as parameterized by Perdew and Zunger [10] for the ex-change-correlation energy in the SIESTA code [11, 12]. This code calculates the total energies and atomic forces using a linear combination of atomic orbitals as the basis set. The basis set is based on the finite range pseudoatomic orbitals (PAOs) of the Sankey-Niklewsky type [13], gener-alized to include multiple-zeta decays.
The interactions between electrons and core ions are simu-lated with separable Troullier-Martins norm-conserving pseudopotentials [14]. We have generated atomic pseudo-potentials separately for atoms, Sn, Ge and S by using the 5s25p2, 4s24p2 and 3s23p4 configurations, respectively. For present atomic pseudopotentials, the cut-off radii are taken as s: 2.40 au, p: 2.46 au, 2.79 au for the d and f channels of Sn, s: 2.06 au, p: 2.85 au, 2.58 au for the d and f channels of Ge and s: 1.60 au, p: 1.73 au, 1.90 au for the d and f channels of S. Siesta calculates the self-consistent potential on a grid in real space. The fineness of this grid is deter-mined in terms of an energy cut-off Ec in analogy to the energy cut-off when the basis set involves plane waves. Here, by using a double-zeta plus polarization (DZP) orbi-tals basis and the cut-off energies between 100 and 500 R with various basis sets, we found an optimal value of around 350 R for SnS and GeS. 75 k-points for SnS and GeS were enough to obtain the converged total energies.
3 Results and discussion
3.1 Structural properties The structures of SnS and
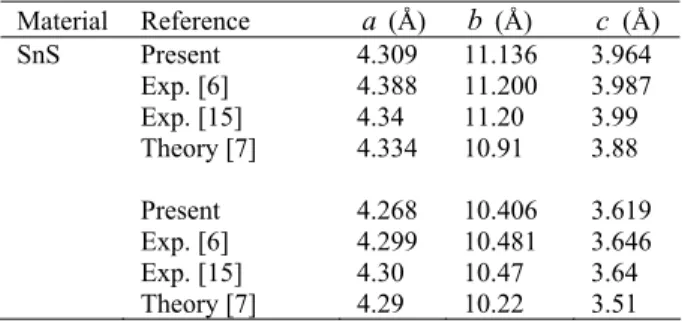
GeS are considered as an orthorhombic structure. These crystals have four molecules (8 atoms) in the unit cell. The equilibrium lattice parameters were obtained by minimiz-ing the total energy for the different values of the lattice parameters by means of Murnaghan’s equation of states (EOS) [15]. The results are shown in Table 1. The obtained
lattice parameters are in good agreement with the experi-mental and theoretical values.
Table 1 The calculated equilibrium lattice parameters (a, b, and
c), with the theoretical and experimental values for SnS and GeS in fractional coordinates. Material Reference a (Å) b (Å) c (Å) SnS Present Exp. [6] Exp. [15] Theory [7] Present Exp. [6] Exp. [15] Theory [7] 4.309 4.388 4.34 4.334 4.268 4.299 4.30 4.29 11.136 11.200 11.20 10.91 10.406 10.481 10.47 10.22 3.964 3.987 3.99 3.88 3.619 3.646 3.64 3.51
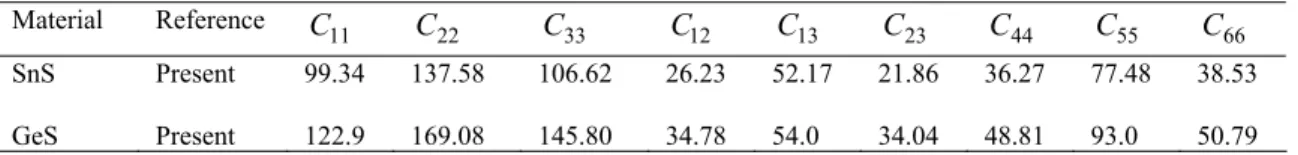
3.2 Elastic properties The elastic constant Cij of solids provides a link between the mechanical and dynami-cal behavior of crystals, and some of the most important information that can be obtained from ground state total energy calculations. The Cij determine the response of the
crystal to external forces characterized by the bulk modulus, Young's modulus, shear modulus, and Poisson's ratio, and, therefore, play an important part in determining the stability and stiffness of the materials [16-18]. The pre-sent elastic constants are computed by using the "volume-conserving" technique [19]. The obtained Cij calculations
are summarized in Table 2. Unfortunately, there are no theoretical results for comparing them with the present work. However, our results can serve as a prediction for future investigations.
Nine independent strains are necessary to compute the elastic constants of orthorhombic GeSand SnScompounds. Mechanical stability leads to restrictions on the elastic con-stants, which for orthorhombic crystals [19-21] are
0 ) 2 (C11+C22− C12 >
,
(C11+C33−2C13)>0, 0 ) 2 (C22+C33− C23 >,
C11>0,C22 >0,(1) 33 0, 44 0, 55 0, 66 0, C > C > C > C > 0 ) 2 2 2 (C11+C22+C33+ C12+ C13+ C23 > .
The present elastic constants in Table 2 obey these stability conditions for orthorhombic SnS and GeS. The elastic con-stants C , 11 C22, and C measure the a-, b-, and c-33
direction resistance to linear compression, respectively.
The C for SnS11 and GeScompounds are lower than the
22
C and C . Thus, SnS33 and GeScompounds are more
compressible along the a-axis. It is known that the elastic constant C is the most important parameter indirectly 44
governing the indentation hardness of a material. The large
44
C means a strong ability of resisting the monoclinic shear distortion in (100) plane, and C relates to the resis-66
tance to shear in the <110> direction. In the present case,
44
Material Reference C11 C22 C33 C12 C13 C23 C44 C55 C66 SnS GeS Present Present 99.34 122.9 137.58 169.08 106.62 145.80 26.23 34.78 52.17 54.0 21.86 34.04 36.27 48.81 77.48 93.0 38.53 50.79
Table 3The calculated isotropic bulk modulus (B, in GPa), shear modulus (G, in GPa), Young’s modulus (E, in GPa) and Poisson’s ratio for SnS and GeS compounds.
Material Reference BR BV B GR GV G E υ SnS GeS Present Present 60.41 75.65 60.45 75.93 60.43 75.79 40.33 54.58 46.67 59.52 43.50 57.05 105.3 136.8 0.2097 0.1991 A problem arises when single crystal samples are not
available, since it is then not possible to measure the indi-vidual elastic constants. Instead, the polycrystalline bulk modulus (B) and shear modulus (G) may be determined. There are two approximation methods to calculate the po- lycrystalline modulus, namely, the Voigt method [22] and the Reuss method [23]. For specific cases of orthorhombic lattices, the Reuss shear modulus (G ) and the Voigt shear R
modulus (G ) are V
1 66 55 44 23 13 23 13 12 13 12 23 12 12 33 13 33 22 23 33 22 11 )] / 1 ( ) / 1 ( ) / 1 [( 3 / )] ( ) ( ) ( ) ( ) ( [ 15 − ⎪ ⎪ ⎭ ⎪ ⎪ ⎬ ⎫ ⎪ ⎪ ⎩ ⎪ ⎪ ⎨ ⎧ + + + Δ + − + − + − + + + + + = C C C C C C C C C C C C C C C C C C C C C GR (2) and ) ( 5 1 ( 15 1 66 55 44 23 13 12 33 22 11 C C C C C C C C C GV + + + − − − + + = (3)
and the Reuss bulk modulus (BR) and Voigt bulk modulus
) (BV are defined as 1 23 13 23 13 12 13 12 23 12 12 33 13 33 22 23 33 22 11 ) 2 ( ) 2 ( ) 2 ( 2 ) 2 ( ) 2 ( − ⎥ ⎥ ⎥ ⎦ ⎤ ⎢ ⎢ ⎢ ⎣ ⎡ − + − + − + − − + − + Δ = C C C C C C C C C C C C C C C C C C BR (4) and ) ( 9 2 ) ( 9 1 23 13 12 33 22 11 C C C C C C BV = + + + + + .
(5) In Eq. (2) and (4), ) ( ) ( ) ( 12 23 13 22 23 12 13 23 11 33 11 22 122 13C C C C C C C C C C C C C C − + − + − = Δ is
the elastic compliance constant. Using energy considera-tions Hill [24] proved that the Voigt and Reuss equaconsidera-tions represent the upper and lower limits of the true polycrystal-
line constants, and recommended that a practical estimate of the bulk and shear moduli were the arithmetic means of the extremes. Hence, the elastic moduli of the polycrystal-line material can be approximated by Hill’s average. The shear moduli can, therefore, be expressed as
) ( 2 1 V R G G G= + , (6) and in a similar manner the bulk moduli can be written as
1
( ).
2 R V
B= B +B (7) Young’s modulus, E and Poisson’s ratio, , v, for an iso-tropic material are given by
G B BG E + = 3 9
,
(8)) 3 ( 2 2 3 G B G B v + − = , (9) respectively [25, 26]. The Hill average [24] was used to calculate the polycrystalline modulus in a manner similar to our recent works [17, 18].Using the relations given above, the calculated bulk modulus, shear modulus, Young’s modulus, and Poisson’s ratio for SnSand GeSare given in Table 3. The bulk modulus is a measure of resis-tance to volume change by an applied pressure, whereas the shear modulus is a measure of resistance to reversible deformations upon shear stress [27]. Hence, shear modulus exhibits better correlations with hardness than the bulk modulus. The calculated bulk modulus and shear modulus for SnSand GeS are 60.43, 43.50 GPa and 75.79, 57.05 GPa, respectively. The values of the bulk moduli indicate that GeS is a less compressible material than the SnS com-pound. The calculated shear modulus for SnS is lower than GeS compound.
The criterion in Refs. [27, 28] for ductility or brittleness is the value of the B /G. If the B /G ratio is higher (less) than, 1.75, then a material is ductile (brittle). The B /G ra-tio calculated for SnS and GeS compounds are lower than 1.75. Hence, both compoundsbehave in a brittle manner.
Young’s modulus, which is defined as the ratio of stress to strain for a given material, is used to provide for the meas-urement of the stiffness of the solid. The higher the value of Young's modulus, the stiffer the materials will be. Here, the value of Young’s modulus (105.3 GPa) of the SnS compound is higher than GeS (136.8 GPa). Therefore, the GeS compound is relatively stiffer than SnS. If the value of
E, which has an impact on the ductile, increases, then the covalent nature of the material also increases. In Table 3, it is shown that Eincreases as you move from SnS to GeS. The value of Poisson’s ratio is indicative of the degree of directionality of the covalent bonds. The value of the Pois-son’s ratio is small (υ =0.1) for covalent materials, whereas for ionic materials a typical value of υ is 0.25 [29]. The calculated Poisson’s ratios are approx. 0.210 and 0.199 for SnSand GeS, respectively. Therefore, the ionic contribution to inter atomic bonding for these compounds is dominant. The υ=0.25 and 0.5 are the lower and upper limits, respectively, for central force solids [30]. For SnS and GeS, the values of υ are close to 0.25, indicating that interatomic forces are central forces.
In the crystal structures, elastic anisotropy is important in understanding the elastic properties [31]. The shear ani-sotropic factors on different crystallographic planes pro-vide a measure of the degree of anisotropy in atomic bond-ing in different planes. The shear anisotropic factors are given by 13 33 11 44 1 2 4 C C C C A − +
= for the {100} plane, (10) 23 33 22 55 2 2 4 C C C C A − +
= for the {010}plane, (11) 12 22 11 66 3 2 4 C C C C A − +
= for the {001}plane. (12) The calculated values of A1, A2 and A3 for SnSand GeS are given in Table 4. A value of unity means that the crys-tal exhibits isotropic properties while values other than unity represent varying degrees of anisotropy. From Table 4, it can be seen that SnSand GeSexhibit larger anisotropy in the {100} and {010} planes and these compounds ex-hibit almost isotropic properties for the {001} plane ac-cording to other planes. Another way of measuring the elastic anisotropy is given by the percentage of anisotropy in the compression and shear [29, 30, 32].
100 V R comp V R B B A B B -= ¥ + , (13) 100 V R shear V R G G A G G -= ¥ + . (14)
For crystals, these values can range from zero (iso-tropic) to 100% representing the maximum anisotropy. The percentage anisotropy values have been computed for SnS and GeS, and are shown in Table 4. It can be also seen that
the anisotropy of SnS in compression is small and its ani-sotropy in shear exhibits relatively high shear compared to GeS.
Table 4The shear anisotropic factors A1, A2, A3, and Acomp(%), Ashear(%).
Material Reference A1 A2 A3 Acomp Ashear SnS GeS Present Present 1.43 1.06 1.55 1.51 0.84 0.91 0.03 0.18 7.29 4.33
Table 5 The longitudinal, transverse, average elastic wave ve-locities, and hardness together with the Debye temperature for SnS and GeS. Material Reference v|(m/s) vt(m/s) vm(m/s) θD(K) SnS GeS Present Present 4745 5928 2875 3634 3178 4011 414 553
One of the standard methods for calculating the Debye temperature is to use elastic constant data since θ [33] D may be estimated from the average sound velocity (vm).
m A D M v N n k 3 / 1 4 3 ⎥ ⎦ ⎤ ⎢ ⎣ ⎡ ⎟ ⎠ ⎞ ⎜ ⎝ ⎛ = ρ π θ = , (15) where = is Planck's constants, k is Boltzmann's constant,
A
N is Avogadro's number, n is the number of atoms per formula unit, M is the molecular mass per formula unit,
) / (=M V
ρ is the density, and vm is given [34] as 3 / 1 3 3 1 2 3 1 − ⎥ ⎥ ⎦ ⎤ ⎢ ⎢ ⎣ ⎡ ⎟ ⎟ ⎠ ⎞ ⎜ ⎜ ⎝ ⎛ + = l t m v v v , (16) where vl and vt, are the longitudinal and transverse elas-tic wave velocities, respectively, which are obtained from Navier's equation [35] ρ 3 4 3B G vl + = , (17) and ρ G vt= . (18)
At low temperatures, we have calculated the sound ve-locities and the Debye temperature by using the common relation given herein above for SnSand GeS, and the re-sults are listed in Table 5. For materials, usually, the higher Debye temperature, the larger microhardness. The calcu-lated Debye temperature for GeSis higher than SnS. Un-fortunately, there are no theoretical and experimental re-sults to compare with the calculated vl , vt, vm , and
D
θ values.
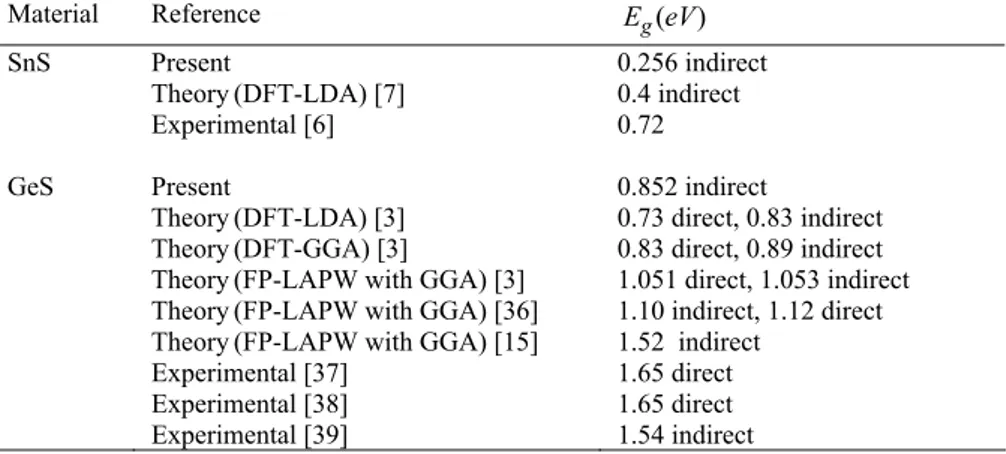
Material Reference Eg(eV) SnS GeS Present Theory(DFT-LDA) [7] Experimental [6] Present Theory(DFT-LDA) [3] Theory(DFT-GGA) [3]
Theory(FP-LAPW with GGA) [3] Theory(FP-LAPW with GGA) [36] Theory(FP-LAPW with GGA) [15] Experimental [37] Experimental [38] Experimental [39] 0.256 indirect 0.4 indirect 0.72 0.852 indirect 0.73 direct, 0.83 indirect 0.83 direct, 0.89 indirect 1.051 direct, 1.053 indirect 1.10 indirect, 1.12 direct 1.52 indirect 1.65 direct 1.65 direct 1.54 indirect
3.3 Electronic properties The investigation of the
elec-tronic band structure for understanding the elecelec-tronic and optical properties of SnSand GeS is very useful. The band structures of the orthorhombic SnSand GeS were calcu-lated using LDA approximation. The electronic band struc-tures were calculated along the special lines connecting the high-symmetry points Γ(0,0,0), X (½,0,0), S (½,½,0), Y (0,½,0), Z (0,0, ½), R (½,½,½) for SnSand GeS in the k-space.
Figure 1Energy band structure for a) SnS and b) GeS
The energy band structures calculated for SnSand GeS are shown in Fig. 1. As can be seen in Fig. 1a, the SnS compound is an indirect band gap semiconductor with the value 0.256 eV (see Table 6). The top of the valance band positioned at the nearly X point between Γ and X point of BZ, the bottom of the conduction band is located at the nearly Z point between Γ and Z point of BZ. The band gap with the value 0.852 eV (see Table 6) of GeS com-pound has the same character of that of SnS. Similarly, the top of the valance band is located at the nearly midway point between Γand X point of the BZ, and the bottom of the conduction band is located at the Γ point of BZ. The
band gap value obtained for GeS is in good agreement with the theoretical results, but is less than the estimated ex-perimental results. The present band and the density of states (DOS) profiles for GeS agree with the earlier work [1, 7]. The total and partial densities of states correspond-ing to the band structures of SnSand GeSwere calculated and the results are indicated in Fig. 2 and Fig. 3 along with the Fermi energy level, respectively. In these figures, the lowest valence bands that occur between approximately -16 and -12 eV are dominated by S 3s states while the va-lence bands that occur between approximately -10 and -6
eV are dominated by Sn 5s and Ge 4s states. The highest occupied valance bands are essentially dominated by S 3p states. The 5p and 4p states of Sn and Ge atoms, respec-tively are also contributing to the valance bands, but the values of the densities of these states are rather small com-pared to S 3p states. The lowest unoccupied conduction bands just above Fermi energy level is also dominated by the 5p and 4p states of Sn and Ge atoms, respectively.
3.4 Optical properties It is well known that the effect of
the electric field vector, E ( )w , of the incoming light is to polarize the material. At the level of linear response, this polarization can be calculated using the following relation [40, 41]: (1) ( ) ( , ) ( ), i j ij P w =c -w w E w
(19) where (1) ij
χ is the linear optical susceptibility tensor and it is given by [42] π δ ω ε ω ω ω ω χ 4 ) ( ) ( ) ( ) ( ) ( ) , ( 2 ) 1 ( ij ij k nm mn i mn i nm nm ij k k r k r k f e ∑ = − − Ω = − G G G G G = (20)
where n,m denote energy bands, fmn(kG)≡ fm(kG)−fn(kG) is the Fermi occupation factor, Ω is the normalization volume,
ω
mn(kG)≡ω
m(kG)−ω
(kG) are the frequency dif-ferences, =ω
n(kG) is the energy of band n at wave vectork. The rnm
G
Figure 2The total and projected density of states for SnS.
Figure 3The total and projected density of states for GeS. [42]. As can be seen from Eq. (20), the dielectric func- tion
ε
ij(ω
)=1+4πχ
ij(1)(−ω
,ω
)and the imaginary part of) ( ), (
ω
ε
2ω
ε
ij ij , is given by )). ( ( ) ( ) ( ) ( ) ( 2 2 2 k k v k v k f k d e w mn nm mn j nm i nm nm ij G G G G G =π ω δ ω ω ε = ∑ ∫ − (21)The real part of
ε ω
ij( )
andε ω
1ij( )
can be obtained by us-ing the Kramers-Kronus-ing transformation [42]. Because theKohn-Sham equations determine the ground state proper-ties, the unoccupied conduction bands as calculated have no physical significance. If they are used as single-particle states in a calculation of the optical properties for semi-conductors, a band gap problem comes included in the cal-culations of response.
The known sum rules [43] can be used to determine some quantitative parameters, particularly the effective number of the valence electrons per unit cell N , as well eff
as the effective optical dielectric constant εeff , which make a contribution to the optical constants of a crystal at the energy E . One can obtain an estimate of the distribu-0
tion of oscillator strengths for both intraband and interband transitions by computing the Neff(E0)defined according to
∫ = ∞ 0 2 2 2 0 ( ) , 2 ) ( E EdE Na e m E Neff ε π ε =
(22)
where Na is the density of atoms in a crystal, e and m
are the charge and mass of the electron, respectively and
) (E0
Neff is the effective number of electrons contributing to optical transitions below an energy of E0.
Further information on the role of the core and semi-core bands may be obtained by computing the contribution that the various bands make to the static dielectric con-stant, ε According to the Kramers-Kronig relations, 0.
0
ε
can be written in the form∫ = − ∞ − 0 1 2 0 ( ) . 2 1 ) (E ε E E dE π ε (23) One can, therefore, define an ‘effective’ dielectric constant, which represents a different mean of the interband transi-tions from that represented by the sum rule, Eq. (23), ac-cording to the relation
∫ = − 0 − 0 1 2( ) . 2 1 ) ( E eff E π ε E E dE ε (24) The physical meaning of εeff is quite clear: εeff is the
ef-fective optical dielectric constant governed by the inter-band transitions in the energy range from zero to E0, i.e. by the polarizition of the electron shells. In order to calcu-late the optical response by using the calcucalcu-lated band struc-ture, we have chosen a photon-energy range of 0-25 eV and have seen that a 0-15 eV photon-energy range is suf-ficient for most optical functions.
The SnS and GeS single crystals have an orthorhombic structure that is optically a biaxial system. For this reason, the linear dielectric tensor of the SnS and GeS com-pounds have three independent components that are the diagonal elements of the linear dielectric tensor. We first calculated the real and imaginary parts of the linear dielec-tric function of the SnS and GeS compounds along the x- and z-directions (Fig. 4 and Fig. 5). All of the SnS and GeS
Figure 4 Energy spectra of dielectric function ε=ε1−iε2and energy-loss function (L) along the x- and z-axes for SnS.
compounds studied so far have ε1x
( )
ε1z and are equal to zero in the energy region between 2 eV and 19 eV for decreasing (dε1 dE<0) and increasing (dε1 dE>0) of) (
1eV
ε (see Table 7). In addition, the values of
ε
1 versus photon energy have main peaks in the energy region be-tween 0.5 eV and 6 eV . Some of the principal features and singularities of the ε for both investigated co pounds ij are shown in Table 7. The peaks of theε
2x and e corre-2zspond to the optical transitions from the valence band to the conduction band and are in an agreement with the pre-vious result [36, 37] for GeS. The maximum peak values of
ε
2x and εz2 for SnS are around 2.37 eV and 1.88 eV, respectively, whereas the maximum values ofε
2x and ε for GeS are around 3.18 2z eV and 2.69 eV, respec-tively. In general, there are various contributions to the di-electric function, but Fig. 4 and Fig. 5 show only the con-tribution of the electronic polarizability to the dielectric function. In the range between 1 eV and 5 eV,ε
1z decrease with increasing photon-energy, which is characteristic of an anomalous dispersion. In this energy range, the transi-tions between occupied and unoccupied states mainly oc-cur between occupied and unoccupied S 3p states that can be seen in the DOS and PDOS shown in Fig. 2 and Fig. 3.Table 7 Some of principal features and singularities of the linear
optical responsesfor SnS and GeS.
Material ε1
( )
eV dε1 dE<0 dε1 dE>0 ε2( )
eV SnS x 1 ε 3.84 - 17.88 - x max , 2 ε 2.37 z 1 ε 2.41 4.49 3.27 18.04 z max , 2 ε 1.88 GeS x 1 ε 4.41 - 19.47 - x max , 2 ε 3.18 z 1 ε 5.02 - 19.27 - z max , 2 ε 2.69Figure 5 Energy spectra of dielectric function ε=ε1−iε2and energy-loss function (L) along the x- and z-axes for GeS.
The corresponding energy-loss functions, L(ω), are also presented in Fig. 4 and Fig. 5. In this figure, L and x
z
L correspond to the energy-loss functions along the x- and z-directions. The function L(ω) describes the energy loss of fast electrons traversing the material. The sharp maxima in the energy-loss function are associated with the existence of plasma oscillations [44]. The curves of L x
and Lz in Fig. 4 and Fig. 5 have a maximum near 18.77 and 18.16 eV for SnS, respectively, and 19.96 and 19.35
eV for GeS, respectively
.
Figure 6Energy spectra of Neff and εeff along the x- and z- axes.
The calculated effective number of valence electrons
eff
N
and the effective dielectric constantε
eff are givenin Fig. 6. The effective number of valence electron per unit cell,
N
eff , contributing in the interband transitions, reaches saturation value at about 25 eV. This means that deep-lying valence orbitals participate in the interband transitions as well (see Fig. 1). The effective optical dielec-tric constant,ε
eff ,as shown in Fig. 6, reaches a saturation value at about 10 eV. This means that the greatestcontribu-tion to
ε
eff arises from interband transitions between 0 and 10 eV.4 Conclusion We studied the structural, electronic,
me-chanical, and optical properties of the SnS and GeS com-pounds using first principle DFT methods. The calculated lattice parameters are in agreement with the experimental and theoretical results. The elastic constants obtained using the “volume-conserving” technique and strain-stress rela-tionship. Our results indicate that these compounds are mechanically stable. Due to the higher value of Young's modulus, GeS compound is relatively stiffer than SnS. In addition, the calculated bulk modulus, shear modulus, De-bye temperature and wave velocity for GeS are higher than SnS. Moreover, B/G calculations for both compounds are classified as being brittle. The ionic contribution to inter atomic bonding for these compounds is dominant. We have revealed that the band structures of these compounds are a semiconductor in nature. We have examined the photon-energy dependent dielectric functions, some optical proper-ties such as the energy-loss function, the effective number of valance electrons, and the effective optical dielectric constant along the x- and z- axes.
Acknowledgements This work is supported by the
projects DPT-HAMIT, DPT-FOTON, and NATO-SET-193 as well as TUBITAK under project nos., 113E331, 109A015, and 109E301. One of the authors (Ekmel Ozbay) also acknowledges partial support from the Turkish Academy of Sciences.
References
[1] A. R. H. F. Ettema, R. A. de Groof, C. Haas, and T. S. Turner, Phys. Rev. B 46, 7363 (1992).
[2] M. Rajagopalan G. Kalpana, and V. Priyamvadha, Bull. Ma-ter. Sci. 29, 25-28 (2006).
[3] A. Rathor, V. Sharma, N. L. Heda, Y. Sharma, and B. L. Ahuja, Radiat. Phys. Chem. 77, 91-400 (2008).
[4] F. M. Gashimzade, D. A. Guseinova, Z. A. Jahangirli, and M. A. Nizametdinova, Phys. Solid State 55, 1802-1807 (2013).
[5] U. V. Waghmare, N. A. Spaldin, H. C. Kandpal, and R. Seshadri, Phys. Rev. B 67, 125111 (2003).
[6] H. Wiedemeier and H. G. von Schnering, Z. f. Kristallogra-phie 148, 295-303 (1978).
[7] B. D. Malone and E. Kaxiras, Phys. Rev. B 87, 245312 (2013).
[8] J. M. Kohn and L. J. Sham, Phys. Rev. 140, A1133 (1965). [9] D. M. Ceperley and M. J. Adler, Phys. Rev. Lett. 45, 566
(1980)
[10] P. Perdew and A. Zunger, Phys. Rev. B 23, 5048 (1981). [11] P. Ordejόn, E. Artacho, and J. M. Soler, Phys. Rev. B 53,
R10441-R10444 (1996).
[12] J. M. Soler, E. Artacho, J. D. Gale, A. García, J. Junquera, P. Ordejón, and D. Sánchez-Portal, J. Phys.: Condens. Matter
14, 2745-2779 (2002).
[13] O. F. Sankey and D. J. Niklewski, Phys. Rev. B 40, 3979 (1989).
[14] N. Troullier and J. L. Martins, Phys. Rev. B 43, 1993 (1991).
[15] F. M. Gashimzade, D. G. Guliev, D. A. Guseinova, and V. Y. Shteinshrayber, J. Phys.: Condens. Matter 4, 1080-1091 (1992).
[16] E. Deligoz, H. Ozisik, K. Colakoglu, G. Surucu, and Y. O. Ciftci, J. Alloys Compd. 509, 1711-1715 (2011).
[17] H. Koc, H. Ozisik, E. Deligoz, Amirullah M. Mamedov, and E. Ozbay, J. Mol. Model. 20, 1-12 (2014).
[18] H. Koc, Amirullah M. Mamedov, E. Deligoz, and H. Ozisik, Solid State Sci. 14, 1211-1220 (2012).
[19] D. C. Wallace, Thermodynamics of Crystals, Chap. 1 (where finite Lagrangian strains ηij are discussed. In the case of infinitesimal strains these reduce to our εij of classical elasticity theory) (Wiley, New York, 1972).
[20] O. Beckstein, J. E. Klepeis, G. L. W. Hart, and O. Pankratov, Phys. Rev. B 63, 134112.1-134112.12 (2001).
[21] F. Birch, Phys. Rev. 71, 809-824 (1947).
[22] W. Voight, Lehrbuch der Kristallphysik (Teubner, Leipzig, 1928), p. 962.
[23] A. Z. Reuss, Angew. Math. Mech. 9, 49-58 (1929). [24] R. Hill, Proc. Phys. Soc. London A 65, 349-354 (1952). [25] K.B. Panda and K.S.R. Chandran, Acta Mater. 54,
1641-1657 (2006).
[26] P. Ravindran, L. Fast, P. A. Korzhavyi, B. Johansson, J. Wills, and O. Eriksson, J. Appl. Phys. 84, 4891-4904 (1998). [27] I. R. Shein and A. L. Ivanovskii, J. Phys.: Condens. Matter.
20, 415218.1-415218.9 (2008).
[28] S. F. Pogh, Philos. Mag. 45, 833-838 (1954).
[29] V. V. Bannikov, I. R. Shein, and A. L. Ivanovskii, Phys. Sta-tus Solidi RRL 3, 89-91(2007).
[30] H. Fu, D. Li, F. Peng, T. Gao, and X. Cheng, Comput. Mater. Sci. 44, 774-778 X (2008).
[31] V. Tvergaard and J. W. Hutchinson, J. Am. Chem. Soc. 71, 157-166 (1988).
[32] D. H. Chung and W. R. Buessem, in: Anisotropy in Single Crystal Refractory Compounds, edited by F. W. Vahldiek and S. A. Mersol (Plenum Press, New York, 1968), p. 217. [33] I. Johnston, G. Keeler, R. Rollins, and S. Spicklemire, Solids
State Physics Simulations, The consortium for upperlevel physics software (Wiley, New York, 1996).
[34] O. L. Anderson, J. Phys. Chem. Solids. 24, 909-917 (1963). [35] E. Schreiber, O.L. Anderson, and N. Soga, Elastic constants
and Their Measurements (McGraw-Hill, New York, 1973). [36] L. Makinistian and E.A. Albanesi, Phys. Rev. B 74, 0455206
(2006).
[37] R. Eymard and A. Otto, Phys. Rev. B 16, 1616-1623 (1977). [38] J. D. Wiley, A. Breitschwerdt, and E. Schönherr, Solid State
Commun. 17, 355-359 (1975).
[39] A. M. Elkorashy, J. Phys.: Condens. Matter 2, 6195-6205 (1990).
[40] Z. H. Levine and D. C. Allan, Phys. Rev. Lett. 63, 1719-1722 (1989).
[41] H. Koc, E. Deligöz, and A. M. Mamedov, Phys. Mag. 91, 3093-3107 (2011).
[42] H. R. Philipp and H. Ehrenreich, Phys. Rev. 129, 1550-1560 (1963).
[43] O.V. Kovalev, Representations of the Crystallographic Space Groups, Irreducible Representations Induced Repre-sentations and CorepreRepre-sentations (Gordon and Breach, Am-sterdam, 1965).