INVESTIGATION OF THE EFFECTS OF NICOTINE ON THE EXPRESSION
PROFILE OF SW620 COLON ADENOCARCINOMA CELLS USING A
FUNCTIONAL GENOMICS APPROACH
A THESIS SUBMITTED TO
THE DEPARTMENT OF MOLECULAR BIOLOGY AND GENETICS AND THE INSTITUTE OF ENGINEERING AND SCIENCE OF
BILKENT UNIVERSITY
IN PARTIAL FULFILLMENT OF THE REQUIREMENTS FOR THE DEGREE OF
MASTER OF SCIENCE
BY ONUR KAYA AUGUST 2009
I certify that I have read this thesis and that in my opinion it is fully adequate, in scope and in quality, as a thesis for the degree of Master of Science.
______________________________
Assist. Prof. Dr. Özlen KONU
I certify that I have read this thesis and that in my opinion it is fully adequate, in scope and in quality, as a thesis for the degree of Master of Science.
______________________________
Assoc. Prof. Dr. Işık G. YULUĞ
I certify that I have read this thesis and that in my opinion it is fully adequate, in scope and in quality, as a thesis for the degree of Master of Science.
______________________________
Dr. Özlem İLK
Approved for the Institute of Engineering and Science
______________________________
Director of Institute of Engineering and Science Prof. Dr. Mehmet BARAY
TO MY PARENTS SELVİ -KEMAL KAYA; MY BROTHER OKAN; and TO SEVGİ ŞAHİN…
ABSTRACT
INVESTIGATION OF THE EFFECTS OF NICOTINE ON THE EXPRESSION
PROFILE OF SW620 COLON ADENOCARCINOMA CELLS USING A
FUNCTIONAL GENOMICS APPROACH
Onur KAYA
MSc. in Molecular Biology and Genetics Supervisor: Assist. Prof. Dr. Özlen KONU
August 2009, 96 Pages
Colon cancer is the third most common form of cancer with approximately 655,000 deaths worldwide annually and the second principal cause of cancer-related death in the Western world. Studies focusing on genomic instability and cell culture in recent years have shown that there is a statistically significant link between tobacco smoking and colorectal cancer. Although nicotine is one of the most potent chemical in tobacco, it was not studied extensively in colorectal cancers. Nicotine works as an agonist of nicotinic acetylcholine receptors and modulates the intracellular calcium concentrations hence deregulating multiple signal transduction pathways (e.g.,
PI3K/AKT, MAPK, mTOR). It has been shown that nicotine accelerates cell proliferation while it increases cell migration, metastasis and angiogenesis, and inhibits apoptosis in lung and gastric cancers. The aim of this study was to give more insight into the association between nicotine and colon cancer by investigating the gene expression profiles of SW620 colon adenocarcinoma cells under 48h 1µM nicotine treatment at different serum levels to reflect molecular response to growth factor-induced and –depleted conditions (10% FBS or 0.1% FBS). We used multiple approaches including cell culture techniques, microarray technology, and gene-network analysis
selected genes that are involved in cell cycle and apoptosis were used to confirm and evaluate the transcriptome analysis results with real time qRT-PCR and Western Blot techniques. In this project, our findings indicated that serum starvation of SW620 colon adenocarcinoma cell line resulted in decreased cell proliferation, which could be rescued by 1µM nicotine via deregulation of multiple pathways including cell cycle, apoptosis, Ca2+ signaling, and ribosomal protein
expression. This study implicated that nicotine-, thus acetylcholine-mediated signaling may have an important role in tumor development and metastasis.
Key words: Nicotine, nicotinic acetylcholine receptors, SW620, colon cancer, microarray, serum starvation
ÖZET
NİKOTİNİN SW620 KOLON ADENOKARSİNOM HÜCRELERİNİN GEN İFADE PROFİLİ ÜZERİNE OLAN ETKİSİNİN İŞLEVSEL GENOMİK YAKLAŞIMLARLA
ARAŞIRILMASI
Onur KAYA
Moleküler Biyoloji ve Genetik Yüksek Lisansı Tez Yöneticisi: Yard. Doç. Dr. Özlen KONU
Ağustos 2009, 96 Sayfa
Kolon kanseri her yıl dünyada 655.000’e yakın kişinin ölümüne sebep olmakta dünyada en üçüncü, Batı dünyasında ise kanserle ilgili ölümlere sebep olmakta ikinci sıra bulunan kanser tipidir. Son yıllarda genomik kararsızlıklarla ilgili yapılan çalışmalar sigara kullanmakla kolorektal kanser arasında istatistiksel olarak kayda değer bir ilişki olduğunu göstermiştir. Sigarada bulunan kimyasallar içinde nikotin, sigaranın etkisini belirlemede çok önemli bir yer teşkil etmesine rağmen, kolorektal kanser araştırmalarında çok fazla kullanılmamıştır. Nikotinik kolinerjik reseptörlerine agonist olarak bağlanan nikotin, hücre içi kalsiyum konsantrasyonu üzerine etki ederek bir çok sinyal yolağının (PI3K/ AKT, MAPK, mTOR yolakları gibi) düzensizleşmesine, aktif ya da inaktif olmasına neden olur. Nikotin üzerine yapılan çalışmalar göstermiştir ki, nikotin hücre çoğalmasını hızlandırmakla beraber hücre göçü, hücre metaztazı, ve anjiyogenez (damar gelişmesini) olaylarını da arttırmakta, ayrıca akciğer ve gastrik
kanserlerde apoptozu engellemektedir. Bu çalışmamızda, SW620 kolon adenokarsinom
mikrodizin teknolojisi ve gen-ağ analizleri içeren yaklaşımlar kullanarak nikotinin hücre çoğalması ve gen ifadesi profiline olan etkisini araştırdık. Bunların yanında, apoptozda veya hücre döngüsünde görev alan ve mikrodizinde etkili bir biçimde ifade olan genleri belirleyerek bu genleri nicel gerçek zamanlı polimeraz zincir reaksiyonu ve “Western blot” tekniklerinde kullanarak mikrodizin çalışmasının doğrulamasını yaptık. Bu çalışmada, serumdan mahrum bırakılan SW620 kolon adenokarsinom hücrelerinin çoğalmasında belirgin bir azalma olmasına rağmen, aynı serum şartlarında 1µM konsantrasyondaki nikotin sayesinde hücreler hücre döngüsü, apoptoz, kalsiyum iyonu ve ribosomal protein yolakları gibi çeşitli sinyal yolaklarının aktivitelerini değiştirerek çoğalma özelliklerini belirli bir derecede geri kazanmıştır. Bu çalışma göstermiştir ki nikotin tarafından, bundan hareketle asetilkolin tarafında düzenlenen hücre içi sinyaller tümor gelişimi ve metaztaz mekanizmalarında önemli bir etken teşkil etmektedir.
ACKNOWLEDGEMENTS
First of all, I would like to express my gratitude for my thesis advisor Assist. Prof. Dr. Özlen Konu for her guidance and support throughout this study. Being her student was a great pleasure since she was very supportive during my studies and accessible to discussions. I learned a lot from her invaluable critics and creative ideas.
I would like to thank Assoc. Prof. Dr. Işık Yuluğ, Bilge Kılıç, and Nilüfer Sayar for perfoming the microarray experiments.
I would like to express my deepest thanks to Ceren Sucularlı, Ahmet Raşit Öztürk, Rümeysa Bıyık and Muammer Üçal who have provided me with discussions about experiments and sharing ideas besides creating a very favourable athmosphere in the lab and for being very good friends also outside of the lab. I would also thank to Koray Doğan Kaya for supporting with his original ideas and discussions.
I would also like to thank Şerif Şentürk, Prof. Dr. Mehmet Öztürk’s group, and Assoc. Prof. Dr. Can Akçalı’s group for sharing antibodies and for invaluable discussions.
I would like to thank Tamer Kahraman, Sinan Gültekin, Ender Avcı, Gökhan Yıldız, Derya Dönertaş, Fırat Taş, Gurbet Karahan, Duygu Akbaş-Avcı, and Atıl Ç. Saydere for sharing their invaluable ideas and friendship.
I would be grateful to Sevgi Şahin for standing by me at any cost and encouraging me throughout my studies. This project definitely would not be possible without her support.
Undoubtedly, my deepest gratitude goes to my family for their unconditional love and supporting me throughout my studies and decisions.
I would like to thank TÜBİTAK for supporting me with BIDEB-2210 scholarship during my M.Sc. research period. This thesis in part was supported by a grant from TÜBITAK (TBAG-106T0548).
TABLE OF CONTENTS PAGE ABSTRACT……….iii ÖZET………..v ACKNOWLEDGEMENTS………vii TABLE OF CONTENTS………...………...ix LIST OF FIGURES………xiv LIST OF TABLES….……….xvi ABBREVIATIONS………....xvii TABLE OF CONTENTS CHAPTER 1. INTRODUCTION...1 1.1 Colon Cancer...1 1.1.1 Colorectal Cancer...1 1.1.2 Risk Factors...2
1.1.3 Early Detection, Diagnosis and Staging...2
1.1.4 SW620 Human Colorectal Adenocarcinoma Cells...4
1.2 Nicotine...4
1.2.1 Smoking and Cancer...4
1.2.2 History of the Nicotine...5
1.2.3 Nicotine Metabolism...5
1.2.4 Nicotine and Apoptosis...7
1.3 Nicotinic Acetylcholine Receptors...10
1.3.1 General Information...10
1.3.2 Structure of nAChRs...11
1.3.3 Function of nAChRs...12
1.3.3.1 General Functions of Nicotinic Acetylcholine Receptors...12
1.3.3.2 Nicotine and Nicotinic Acetylcholine Receptors...12
CHAPTER 2. OBJECTIVES and RATIONALE...14
CHAPTER 3. MATERIALS and METHODS...16
3.1 MATERIALS...16
3.1.1 General chemicals...16
3.1.2 RNA Isolation, PCR and cDNA synthesis kits...16
3.1.3 Oligonucleotides...16
3.1.4 Western blotting materials...17
3.1.4.1 Kits and reagents...17
3.1.4.2 Antibodies...17
3.1.4.3 Protein transfer materials...17
3.1.5 Electrophoresis, photography, spectrophotometer and autoradiography...17
3.1.6 Tissue culture reagents and cell lines...17
3.1.7 Microarrays...17
3.1.8 Nicotine...18
3.1.9 Cell proliferation experiment kits and reagents...18
3.2 SOLUTIONS and MEDIA...18
3.2.1 General solutions...18
3.2.2 Cell culture solutions...18 3.2.3 SDS (Sodium Deodecyl Sulfate)-PAGE (Polyacrylamide Gel Electrophoresis)
solutions...19
3.2.4 Western-blotting solutions...19
3.3 METHODS...20
3.3.1 Cell culture techniques...20
3.3.1.1 Cell lines...20
3.3.1.2 Growth conditions of the cell lines...20
3.3.1.3 Cryopreservation of cell lines...21
3.3.1.4 Thawing of the frozen cell lines...21
3.3.2 Nicotine treatment of the cells...21
3.3.2.1 Time and dose-dependent nicotine treatments...21
3.3.2.2 Nicotine treatment to the cells for RNA and protein extraction...22
3.3.3 MTT cell viability assay...22
3.3.4 Microarray analyses...23
3.3.4.1 Obtaining raw data...23
3.3.4.2 Data normalization...23
3.3.4.3 Determination of differentially expressed genes...23
3.3.4.4 Gene Ontology (GO) analyses...24
3.3.4.5 Cluster analysis...24
3.3.4.6 Pathway Miner analysis...24
3.3.5 Microarray Verification- RNA experiments...25
3.3.5.1 Total RNA isolation...25
3.3.5.2 cDNA synthesis...25
3.3.5.3 Quantitative real time RT-PCR experiments...25
3.3.5.4 Quantification of relative expression with respect to GAPDH...25
3.3.6.1 Protein extraction...25
3.3.6.2 Quantification of protein concentrations...26
3.3.6.3 Western blotting...26
3.3.6.3.1 SDS polyacrylamide gel electrophoresis...26
3.3.6.3.2 Protein transfer to PVDF Membrane...27
3.3.6.3.3 Immunological detection of membrane transferred proteins...27
CHAPTER 4. RESULTS...28
4.1 Determination of optimum time and dose of nicotine treatment...28
4.1.1 Nicotine treatment of the SW620 cells and its effect on cell proliferation...28
4.2 Microarray Experiments………...31
4.2.1 Quality Control of RNA samples and microarray results……….31
4.2.1.1 Pre-hybridization quality control of the RNA samples...31
4.2.1.2 Post-hybridization quality control of microarray results………31
4.2.2 Scatter plot analysis………34
4.3 Determination of differentially expressed genes upon nicotine exposure under different serum conditions after microarray analyses………..37
4.3.1 Statistical and functional analysis of nicotine response...37
4.3.2 Effects of serum and of nicotine on cholinergic receptor expression ...55
4.3.3 Microarray verification experiments of selected differentially expressed genes using real-time RT-PCR and Western Blot analyses...56
CHAPTER 5. DISCUSSION and CONCLUSION...60
5.1 Nicotine Regulated Cell Proliferation and Cell Cycle...61
5.2 Nicotine Mediated Apoptosis...62
5.4 Nicotine and Signaling Pathways...65
CHAPTER 6. FUTURE PERSPECTIVES...68
APPENDICES...70
APPENDIX A: The results of the gene set enrichment analysis of the significant gene lists that generated by comparing the expression profiles of the nicotine treated serum starved cells to the cells grown under physiological serum level...70
Appendix A1: The significant genes act in biological process pathways……….70
Appendix A2: The significant genes act in cellular component pathways…...73
Appendix A3: The significant genes act in molecular function pathways………76
APPENDIX B: The KEGG pathway list of the significant genes that generated by comparing the expression profiles of the nicotine treated serum starved cells to the untreated serum starved cells by the gene set enrichment analysis………...79
APPENDIX C: Microarray post-hybrizdization quality control results...81
Appendix C1: Quality Control Plots……….81
Appendix C2.a: RNA Degradation Plots...83
Appendix C2.b: The data associated with the RNA degradation plot indicating significance levels………...83
LIST OF FIGURES
Figure 1.1: Human colon physiology...1 Figure 1.2: IUPAC name and chemical structure of nicotine...5 Figure 1.3: Illustration of nicotine metabolism and its primary metabolites in the human
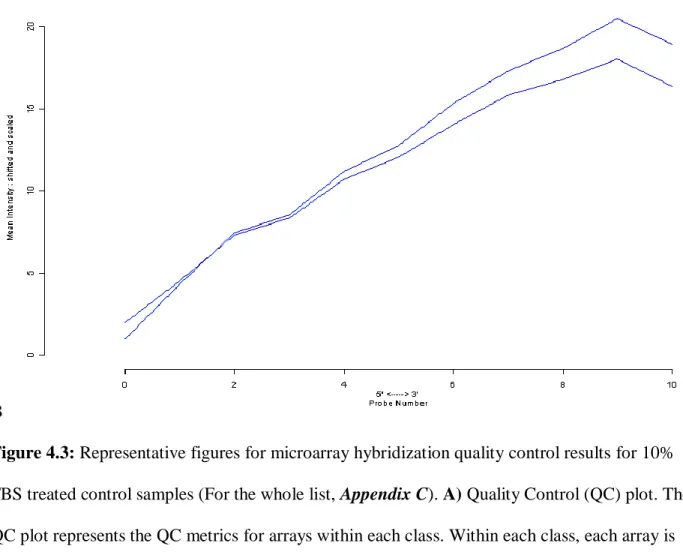
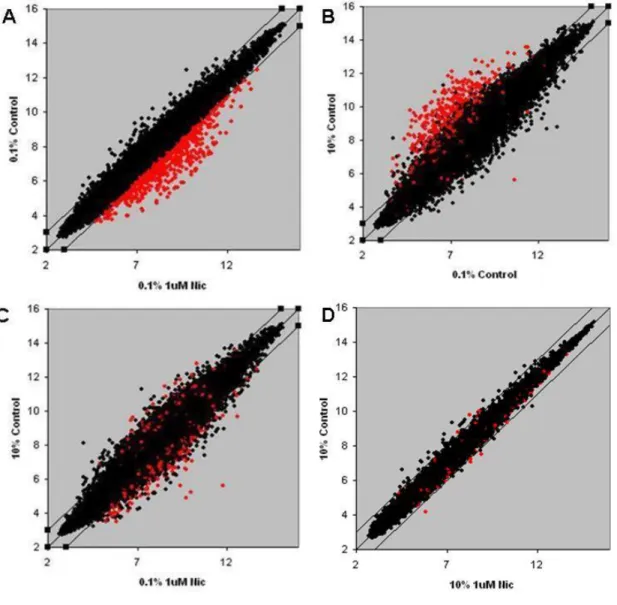
liver...7 Figure 1.4: The structure of the nAChR receptor/channel...11 Figure 1.5: Nicotine and acetylcholine interaction with nAChRs...12 Figure 4.1: MTT cell proliferation results for 48h nicotine treated quiescent SW620 colon adenocarcinoma cells...29 Figure 4.2: MTT cell proliferation results for 7 days nicotine treated quiescent SW620 colon adenocarcinoma cells...30 Figure 4.3: Representative figures for microarray quality control results for 10% FBS treated control samples...33 Figure 4.4: Different Scatter plot illustrations of 1μM nicotine exposed samples’ downregulated genes in 0.1% FBS control in comparison with 1μM nicotine under same serum
conditions...35 Figure 4.5: Different Scatter plot illustrations of 1μM nicotine exposed samples’ upregulated genes in 0.1% FBS control in comparison with 1μM nicotine under same serum
conditions...36 Figure 4.6: KEGG Pathway illustrations sketched via significant genes of 10% FBS serum conditions and 1μM Nicotine treatment in comparison with 0.1% FBS serum treatments...39 Figure 4.7: The Cellular and Regulatory Process Pathways were illustrated via KEGG Pathway genes…...41
Figure 4.8: The Metabolic Pathways were illustrated via Pathway Miner using KEGG Pathway genes…...43 Figure 4.9: The Cell cycle pathway genes illustrated via Pathway Miner with KEGG pathway genes...46 Figure 4.10: The ribosomal protein interactions illustrated via Pathway Miner with KEGG pathway genes....………..………...49 Figure 4.11: The Calcium Signaling genes illustrated via Pathway Miner with KEGG pathway genes….………..………...51 Figure 4.12: The Purine/ Pyrimidine metabolism illustrated via Pathway Miner with KEGG pathway genes...………...53 Figure 4.13: The Glucuronidation metabolism illustrated via Pathway Miner with KEGG
pathway genes………..………...54 Figure 4.14: DNA polymerase genes illustrated via Pathway Miner with KEGG pathway
genes……….………...55 Figure 4.15: Treeview image of nicotinic cholinergic receptor genes’ expression profiles...56 Figure 4.16: Western blotting results of 48 hour 1µM nicotine treated SW620 cells under two different serum conditions...57 Figure 4.17: Treeview imaging of SURVIVIN and XIAP gene expression values from
microarray analyses together with GAPDH...58 Figure 4.18: qRT-PCR results of XIAP (anti-apoptotic gene) under different conditions.
GAPDH used as an internal control for qRT-PCR...59 Figure 4.19: qRT-PCR results of SURVIVIN (anti-apoptotic gene) under different conditions. GAPDH used as an internal control for qRT-PCR...59
LIST OF TABLES
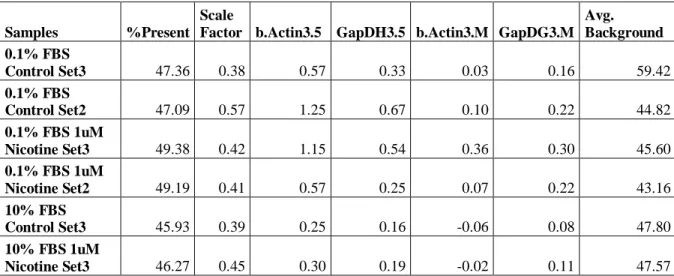
Table 1.1: The stages of the colorectal cancer………...………3 Table 3.1: The sequences of primers used for verification of the genes from microarray analysis via qRT-PCR……..……….……….…..16 Table 4.1: The list of experimental conditions of the SW620 cells and the concentration and RIN values of the RNA samples that were prepared for microarray experiments. ………..….32 Table 4.2: Representative data for microarray post-hybridization quality control analysis…….34 Table 4.3: 48 hours with or without 1 μM nicotine exposed SW620 cells’ total protein
ABBREVIATIONS
HNPCC Hereditary non-polyposis colon cancer
TNM Tumors/nodes/metastases
AJCC American Joint Committee on Cancer
IARC International Agency for Research on Cancer
IUPAC International Union of Pure and Applied Chemistry
NNO Nicotine N'-oxide
CNO cotinine N-oxide
XIAP X-linked Inhibitor of Apoptosis Protein
BIRC4 Baculoviral inhibitor of apoptosis repeat-containing 4 BIRC5 baculoviral inhibitor of apoptosis repeat-containing 5
NSCLC non-small cell lung cancer
GSK-3β Glycogen synthase kinase 3 beta
nAChR Nicotinic Acetylcholine Receptor
COX-2 Cyclooxygenase-2
ERK Extracellular signal-regulated kinases
ATCC American Type Culture Collection
GAPDH Glyceraldehyde 3-phosphate dehydrogenase
KEGG Kyoto Encyclopedia of Genes and Genomes
CDKN2A Cyclin dependent kinase inhibitor 2A
ATR Ataxia telangiectasia and Rad3 related
RP Ribosomal Protein
UGT Uridine 5'-diphospho-glucuronosyltransferase
CHAPTER 1. INTRODUCTION
1.1 Colon Cancer
1.1.1 Colorectal Cancer
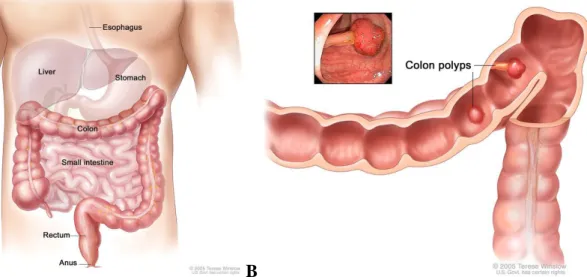
Colorectal cancers consist of cancers of the digestive system, namely colon and rectal cancers; the former includes cancers of the lower part of the digestive system (larger intestine-colon) while rectal cancers are characterized as originating from the end part of colon (last 6 inches) (Figure 1.1A) [1]. With approximately 655,000 deaths worldwide annually, it is the third most common form of cancer and the second principal cause of cancer-related death in the Western world [2]. About 112,000 people are diagnosed with colon cancer per year, and approximately 41,000 new cases of rectal cancer are diagnosed annually, according to the American Cancer Society [1]. According to the 2009 statistics, among these cases, nearly 50,000 people have died because of the colorectal cancer [3]. Most of the colon cancer cases begin as small-benign clumps of cells called adenomatous polyps (Figure 1.1B). Thereafter, some of these polyps progress to become colon cancers.
A B
Figure 1.1: Human colon physiology A) Illustration of normal colon physiology in human body. B) Imaging of colon polyps inside of the large intestine tissue [3].
1.1.2 Risk Factors
Although exact causes of colorectal cancer are not well known, there are some predicted reasons that may trigger the formation of cancer according to National Cancer Institute. Heritability and age are among the main risk factors for colorectal cancers. More than 90% of people with colorectal cancer are diagnosed after age 50 as colorectal polyps increase after that age and the average age for the disease is 72 [3]. Although colorectal cancer is not contagious, familial history takes important role in development of cancer. Close relatives of a person with a history of colorectal cancer are somewhat more likely to develop this disease [1]. Moreover, mutations in some key-genes increase the risk of colorectal cancer. For instance, “Hereditary Non-Polyposis Colon Cancer (HNPCC)” is the most common type of inherited colorectal cancer. It accounts for approximately 2% of all colorectal cancers [4]. Most people with an altered HNPCC gene develop cancer at an early age [3]. Recurrence is a common theme in colorectal cancers [5]. In addition, women with a history of ovary, uterus or breast cancer have higher risks to develop colorectal cancers [3, 6]. Long-term Ulcerative colitis and Crohn’s disease history and diets high in fat and low in calcium foliate may also increase the risk of colorectal cancer [7, 8]. Another very
important risk factor for development of colorectal cancer is tobacco smoking. A person who smokes cigarettes may have increased risk of developing adenomatous polyps. According to Strate et al., women and men who smoked have increased risk of dying from the disease, more than 40% and 30% respectively, when compared with those who never smoked [9].
1.1.3. Early Detection, Diagnosis and Staging
Weakness, fatigue, change in bowel habits, diarrhea or constipation, red or dark blood in stool, weight loss, gas, abdominal pain, cramps, or bloating are some of the symptoms of colorectal cancer. Some other diseases also mimic these symptoms such as ulcerative colitis, diverticulitis,
which vary according to the place of the tumor in the intestine [2]. Therefore, early detection of colorectal cancer gives a very important chance for treatment and better prognosis. The National Cancer Policy Board of the Institute of Medicine predicted in 2003 that efforts for developing and applying additional colorectal cancer screening methods would result in a 29% decrease in
colorectal cancer deaths in 20 years [10]. There are many screening methods to detect colorectal cancer formation such as digital rectal exam (DRE), fecal occult blood test (FOBT), endoscopy, sigmoidoscopy, and colonoscopy. A colonoscopy has the advantage that if polyps are found during the procedure they can be immediately removed and tissue can also be taken for biopsy [11, 12].
Colon cancer staging is an approximation of the quantity of diffusion of a particular cancer [13, 14]. It is performed for both diagnostic and research purposes, and in order to decide the best way for cure. The systems for staging colorectal cancers depend on the extent of local invasion, the degree of lymph node participation and whether there is outlying metastasis [14]. Staging of metastasis frequently include Abdominal Ultrasound, CT, PET scanning, and other imaging
studies. The most common staging system is the TNM (for tumors/nodes/metastases) system, from the American Joint Committee on Cancer (AJCC). The TNM system assigns a number based on three classes: "T" represents the grade of invasion of the intestinal wall, "N" denotes the degree of lymphatic node participation, and "M" symbolizes the degree of metastasis. Stages I to IV progressively indicate a more advanced cancer and worse prognosis (Table 1.1) [15].
Table 1.1: The stages of the colorectal cancer [15].
AJCC stage TNM stage criteria for colorectal cancer Stage 0 Tis: Tumor confined to mucosa; cancer-in-situ Stage I T1: Tumor invades submucosa
Stage I T2: Tumor invades muscularis propria
Stage II-A T3: Tumor invades subserosa or beyond (without other organs involved) Stage II-B T4: Tumor invades adjacent organs or perforates the visceral peritoneum Stage III-A N1: Metastasis to 1 to 3 regional lymph nodes. T1 or T2.
Stage III-B N1: Metastasis to 1 to 3 regional lymph nodes. T3 or T4. Stage III-C N2: Metastasis to 4 or more regional lymph nodes. Any T. Stage IV M1: Distant metastases present. Any T, any N.
1.1.4 SW620 Human Colorectal Adenocarcinoma Cells
The SW620 is a metastatic colon cancer cell line, which was established from a lymph node of a 51-year-old Caucasian male (blood group A, Rh+) patient with an undifferentiated
adenocarcinoma of the ascending colon [16]. It consists mainly of individual small spherical and bipolar cells lacking microvilli that are highly tumorigenic [17]. In this cell line, p53 is mutated (Arg His substitution at codon 273) [18] while several oncogenes also are expressed (c-myc, K-ras, H-K-ras, N-K-ras, Myb, sis and fos; www.atcc.org). Moreover, APC, which is key regulator in β-catenin signaling pathway, is mutated in SW620 cells [19].
1.2 Nicotine
1.2.1 Smoking and Cancer
Smoking is one of the worldwide reasons for cancer–related death. Research demonstrates that 69% of all lung cancers in women and 91% in men are related to smoking [20]. Moreover, smoking is also one of the major reasons for the oral cavity, larynx, esophagus and stomach cancers for both smoking males and females [21]. Cigarettes consist of more than 4000 diverse chemicals and of these chemicals more than 60 are identified as carcinogens according to the research of International Agency for Research on Cancer (IARC). These carcinogens in cigarette smoke react with DNA leading to DNA modifications and mutations and finally causing genetic alterations that might have a role in cancer [22]. Nicotine is one of the
carcinogens in the tobacco smoke. Its absorption may arise through the oral cavity, skin, lung, urinary bladder, and gastrointestinal tract [22]. Dissimilarly to the stomach, nicotine is well absorbed in the small intestine due to the higher pH and a large surface area [23]. Nicotine is known as a highly addictive chemical in tobacco taking the main role in addiction that leads to ongoing consumption of tobacco products. On the other hand, nicotine has an important role in
therapeutic applications for neurodegenerative diseases, such as Alzheimer’s and Parkinson’s disease [24, 25].
1.2.2 History of the Nicotine
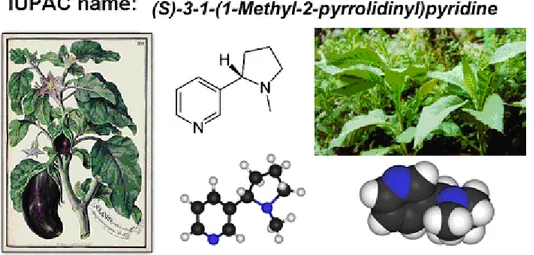
Nicotine is an active alkaloid named after the tobacco plant Nicotiana tabacum (Solanaceae) [22].The systematic International Union of Pure and Applied Chemistry (IUPAC) name is (S)-3-(1- methyl-2-pyrrolidinyl) pyridine (Figure 1.2). Pure nicotine is a clear liquid and it has a characteristic odor, while the color changes into brown on exposure to air. Nicotine is soluble in water and can be mixed with an equal amount of water. However, it prefers organic solvents [22].
Figure 1.2: IUPAC name and chemical structure of nicotine; tobacco plants images (left);
illustration for the correlation of smoking and lung cancer. The illustration modified from Catassi et. al., 2008 [22].
1.2.3 Nicotine Metabolism
Absorption of nicotine throughout the cell membrane relies on the pH property. If the pH is acidic, nicotine is ionized and does not easily pass through membranes [23]. In the lungs, nicotine is
rapidly captivated by the systemic circulation. The active form of nicotine is a cation, which is very similar to acetylcholine. It has been demonstrated that nicotine might compete and/or
interferes with acetylcholine, which is the major neurotransmitter of the brain [26]. The binding of nicotine opens the ionic channel in a very few milliseconds and opening of these channels leads to a brief depolarization (Na+ through the cell) [27]. Nicotine also activates the dopamine system
within the brain. An expanded exposure of these receptors to nicotine decreases the effectiveness of dopamine by repressing the number of suitable receptors [27]. When nicotine concentration decreases in the brain, the receptors turn into active state from desensitized state. The re-activation of receptors increases neurotransmission to an unusual rate [28].
Nicotine is chiefly metabolized in the liver as well as in the lungs and the kidneys into many different metabolites (Figure 1.3). Quantitatively, cotinine (70-80% of nicotine converted to cotinine) and nicotine N'-oxide (NNO) (4-7% of nicotine converted to NNO) are the most
important and primary metabolites of nicotine. They are the products hepatic oxidation of nicotine via cytochrome P-450 [29]. Cotinine is further metabolized to a number of metabolites including 3'-Hydroxycotinine (3HC), 3HC-glucuronide conjugate (3HC-Gluc), and cotinine N-oxide (CNO) [30]. Indeed, it appears that most of the reported urinary metabolites of nicotine are derived from cotinine [30]. NNO can also be reduced back to nicotine that will lead to recycling of nicotine in the body. Other than these metabolites of nicotine, about 3-5% of nicotine is converted to nicotine-glucuronide (Nicotine-Gluc) and excreted in urine [29]. Nornicotine is also shown as a metabolite of nicotine in human. It has been detected in smokers' urine and about 1% of nicotine is converted to nornicotine.
Figure 1.3: Illustration of nicotine metabolism and its primary metabolites in the human liver (www.pharmgkb.org).
1.2.4 Nicotine and Apoptosis
Nicotine has a very important role in deregulation of key and regulator genes in apoptosis events. It is shown by Mai et al. that 1μM nicotine may prevent cisplatin-induced apoptosis via phosphorylation of Bcl2 in human lung cancer cells [31]. Another similar study performed with oral cancer cells has shown parallel results [32]. Banerjee et al. also have shown that nicotine inhibits apoptosis triggered by nitric oxide induction in oral epithelial cells and they have proposed that inhibition of apoptosis may lead tobacco- induced oral cancer formation [33]. Nicotine may also deregulate apoptotic pathways via inducing phosphorylation of Bax through activation of AKT [34]. Besides Bax phosphorylation, it is shown that phosphorylation of Bad may inactivate its pro-apoptotic activity via 1μM nicotine exposure in A549 lung cancer cells thus increasing cell survival [35, 36]. NF-κB signaling pathway and nicotine may also have
important associations in terms of apoptosis inactivation. Zhang et al. has shown that nicotine prevents menadion-induced apoptosis in A549 lung cancer cells via activation of NF-κB [37]. Nicotine also suppresses opioid-induced apoptosis in human lung cancer cells [38]. According to another study nicotine alleviates oxidative stress, activates NF-kB and sensitizes cells to genotoxic/ xenobiotic stresses in HCT116 colon cancer cell line [39]. Furthermore, nicotine prevents apoptosis triggered by some apoptotic drugs like taxol and gemcitabin via increasing gene expression of apoptosis inhibitor XIAP (i.e. BIRC4) and Survivin (i.e. BIRC5) genes in non-small cell lung cancer (NSCLC) in a dose and time dependent manner [40]. Nicotine also
weakens and decreases apoptosis rate triggered by serum starvation [41]. Besides these
findings, nicotine unfavorably affects the cytotoxicity of DNA-damaging agents like cisplatin, UV, and gamma radiation in head and neck cancer cells. According to studies of Onoda et al. in these cells, nicotine does not affect the DNA damage repair mechanism but directly
interferes with the signaling of the death pathway, reducing the signaling of the JNK1 pathway [42].
1.2.5 Nicotine and Cell Proliferation
Nicotine has an effective role in stimulation of cell proliferation and growth via many diverse mechanisms and signaling pathways. In one study, Ye et al. have shown that nicotine promotes cell proliferation in SW1116 colon cancer cell lines via phosphorylation of (epidermal growth factor receptor) EGFR and c-Src followed by an increased in 5-LOX (lipoxygenase) expression [43]. Besides, nicotine suppresses the growth inhibitory effects of trans-retinoic acid (RA) by inhibiting RA receptor-β (RARβ) expression throughout its induction of TR3 expression in lung cancer cells according to the results of Chen et al [44]. Shin et al. has also shown the promoting activity of nicotine on gastric cancer cell proliferation and vascularization through sequential gene activation of ERK/COX-2/VEGF signaling pathway [45]. Another interesting
study was performed with mouse epithelial cells. Long-term exposure of these cells to nicotine disorders cell cycle restriction machinery and cell cycle check points via targeting Ras pathway and induces Cyclin D1 [46]. Nicotine has also a role in AKT pathway. Nicotine and NNK activates Akt via α3/α4 or α7 nAChRs thus lessens etoposite-, UV- or H2O2-induced apoptosis
through phosphorylation of GSK-3β, p70S6K, 4EBP-1, and FKHR [47]. Nicotine increases the proliferation of human small cell lung carcinoma SHP77 cells, indirectly increasing the
expression levels of bombesin-like peptides [48]. Nicotine and its nitrosated carcinogenic derivative NNK actively bind to α7-nicotinic acetylcholine receptor (nAChRα7), and this activates MAPK through PKC/Raf-1, leading to the cell proliferation and finally development of lung cancer [49]. Nicotine also promotes gastric cancer via cyclooxygenase-2 (COX-2) /c-myc/ODC sequential activation [50]. Besides these, nicotine persuades cell proliferation of pancreatic cancer cell line AR42J via activating p-ERK1/2 in independent manner of its
secretory response [51]. Also, rapid activation of ERK1/2 and Stat-3 by nicotine stimulates cell proliferation in bladder cancer [52]. Moreover, nicotine increases Rb-Raf1 complexes in human lung cancer cells lines via interaction with β-arrestin via nAChR α7 and depends on Src activity [53]. In one of the recent studies of Wong et al., it has been shown that β-adrenergic activation plays a regulatory role in the proliferation of colon cancer via promotion of nicotine [54]. They also imply that nicotine stimulates cell proliferation via nAChRα7 in human colon adenocarcinoma HT-29 cells [55]. Another recent study suggests that nicotine increases proliferation of lung cancer cells through induction of fibronectin and α5β1 integrins and these events refereed by nAChR-mediated signals that consist of ERK and PI3-K/mTOR pathways [56].
1.2.6 Nicotine and Microarray Studies
Saito et al. have shown that multiple MAPK signaling components, GABA receptors and protein phosphatases have been involved in nicotine-induced changes in brain [57]. Konu et al, have suggested that the genes belong to PKC, MAPK, NF-κB and ubiquitin/ proteasome
signaling pathways are affected by nicotine via their microarray studies in rat brains [58]. Konu et al. also suggest via microarray studies with PC12 cells (derived from a
pheochromocytoma of the rat adrenal medulla) that nicotine might lead to regulation of ribosomal and proteosomal protein subunits, many growth factors, and heat-shock proteins [59]. It is also worth noting that although there are such microarray studies performed with nicotine in neuronal cells, no microarray study exists for understanding the effects of nicotine on colon cancer cells.
1.3 Nicotinic Acetylcholine Receptors
1.3.1 General Information
Nicotinic acetylcholine receptors, also known as nAChRs or CHRNs, are cholinergic receptors that form ionotropic (i.e. ligand-gated) ion channels in the plasma membranes of definite neuronal cells. nAChRs are directly associated to an ion channel and do not activate a secondary messenger as some other receptor types [60]. nAChRs take their names from nicotine, agonist of cholinergic receptors as they can also be triggered by nicotine besides acetylcholine ligand [61]. Although nAChRs are mainly found in the central nervous system and the peripheral nervous system [60], current research show the expression of nAChRs in non-neuronal tissues [62].
1.3.2 Structure of nAChRs
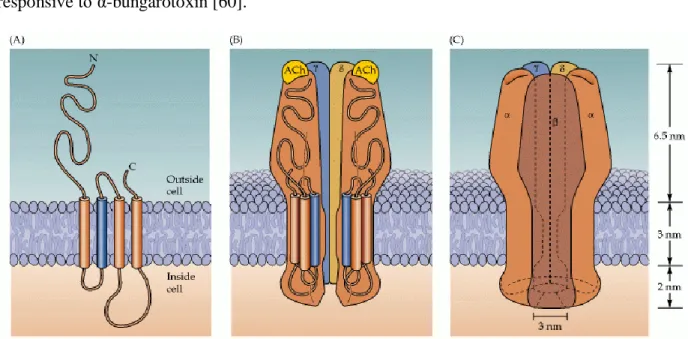
nAChRs, with a molecular mass of 290 kDa, form hetero-pentamers on the cell surface and they settle symmetrically around a central pore [60, 61, 63] (Figure 1.4). These receptors are clustered into two subtypes (muscle and neuronal type) according to their primary sites of expression. The muscle types are found in neuromuscular connections and they are either the embryonic form, composed of α1, β1, δ, and γ subunits in a 2:1:1:1 ratio, or the adult form composed of α1, β1, δ, and ε subunits in a 2:1:1:1 ratio [60, 61, 64]. The neuronal subtypes have diverse homomeric or heteromeric pentamers combinations of twelve different nicotinic receptor subunits: α2 -α10 and β2 -β4 like (α4)3(β2)2 [60]. In both of the subtypes, the subunits are similar to each other in terms
of hydrophobic regions. The neuronal subunits differ from the muscle ones in one way they are not responsive to α-bungarotoxin [60].
Figure 1.4: The structure of the nAChR receptor/channel. (A) Each receptor subunit crosses the membrane four times. The membrane-spanning domain that shapes the pore is shown in blue. (B) Five such subunits come together to create a pentamer structure containing twenty trans-membrane domains that surround a central pore. (C) The openings at either end of the channel are very large -ca. 3 nm in diameter; yet the narrowest area of the pore is approximately 0.6 nm in diameter (in comparison, the diameter of Na+ or K+ is less than 0.3 nm.) [60].
1.3.3 Function of nAChRs
1.3.3.1 General Functions of Nicotinic Acetylcholine Receptors
The existence of the loops on the extracellular regions of nAChRs preserves the binding site for the neuro-transmitter acetylcholine (ACh) which is the physiologically agonist of all nAChRs subunits [65, 66]. Long-exposure to acetylcholine might lead to stabilization of the receptor causing desensitization of the receptor [67, 68]. Aside from the agonistic or antagonistic binding site, diverse interaction sites are present on nAChRs for both non-competitive inhibitors and allosteric modulators [69].
1.3.3.2 Nicotine and Nicotinic Acetylcholine Receptors
Similar to ACh interactions with the receptor complex, nicotine binds as an agonist to the α subunits of nAChRs [70] (Figure 1.5). Nicotine interacts with nAChRα4β2 in higher affinity than it does with the nAChRα7 [71]. Interestingly, chronic nicotine exposure causes desensitization of nAChRα4β2, but not of nAChRα7 [72]. Desensitization is short-lived and removal of nicotine exposure re-establishes receptor affinity [73].
Figure 1.5: Nicotine and acetylcholine interaction with nAChRs. A) Depiction of nicotine and acetylcholine interaction with nicotinic receptor subunits (nAChR). B) Schematic representation of nAChRs structure [22].
Nicotine-receptor interaction guides a conformational change in the receptor and releases the gate on the intracellular side of the ion channel in the plasma membrane. Ion influx into the cell causes membrane depolarization [74, 75]. Following this initial depolarization voltage-activated Ca2+ channels gates open, resulting in an extra Ca2+ influx to the cells, which in turn leading to
deregulation of Ca2+ activated signaling cascades , and release of neurotransmitters. Accordingly,
activation of nACHRs might have a very critical role in cell division, self-renewal, differentiation, proliferation, senescence, apoptosis, and migration [76, 77].
CHAPTER 2. OBJECTIVES AND RATIONALE
Colon cancer is one of the leading causes of death in the world and early diagnosis provides better treatment opportunities. Nicotine, an addictive and modulatory molecule in tobacco has been associated with lung cancer initiation and progress yet the impact of nicotine-driven signaling on colorectal cancer cells have not been studied in detail and/or at the transcriptional profile level. Furthermore, it is apparent that serum levels in cell culture systems reflect changes in growth factors, and serum starvation models help us understand the cellular proliferation and apoptosis mechanisms in cancer cells. Previous studies are focused on nicotine’s effects in systems with serum ad libitum, however, there is indications that serum levels modify nicotine’s effects [46]. Moreover recent studies have shown that nicotine has a critical role in cell cycle proliferation, in apoptosis and cell invasion, yet mostly in lung cancers [40, 53, 78]. But there is no microarray study, which may help understanding the nicotinic signaling pathways in cancer cells of colon. Therefore, the aim of this study is to understand serum-dependent and –independent as well as dose- and time-specific actions of nicotine on colon cancer using molecular and biochemical methods as well as whole genome transcriptome profiling.
The following questions were asked in this study:
1) At what dose and time period does nicotine show its effect for cell proliferation? This question was addressed primarily by using MTT cell viability assay.
2) Do proliferative or apoptotic effects of nicotine differ with respect to levels of serum in cell growth media? This question was addressed by the following approaches a) MTT assays for cell proliferation b) Determination of cell cycle and apoptotic genes expression at protein levels c) Comparing the expression profiles of the nicotine treated cells with or
3) What cellular signaling pathways are involved in nicotine’s serum-dependent effects? This question was addressed by using gene lists obtained by gene set-enrichment analysis and network visualization methods.
CHAPTER 3. MATERIALS AND METHODS
3.1 MATERIALS
3.1.1 General chemicals
All laboratory chemicals were supplied by Sigma-Aldrich (St. Louis, MO, U.S.A), Farmitalia Carlo Erba (Milano, Italy) and Merck (Schucdarf, Germany), except Ethanol and methanol were from Riedel-de Haën (Germany). Agarose was obtained from Gibco (Carlsbad, CA, USA).
3.1.2 RNA Isolation, PCR and cDNA synthesis kits
The RNA isolation was performed using Promega RNA isolation kit, (Madison, USA; Z3100). RevertAid first strand cDNA synthesis kit (MBI Fermentas) and qRT-PCR kit, SYBR-Green (Finnzymes), were used to obtain cDNA and to amplify cDNA, respectively.
3.1.3 Oligonucleotides: The oligonucleotides used in quantitative Reverse Transcriptase-polymerase chain reaction (qRT-PCR) were obtained from Iontek Inc. (Istanbul, Turkey). The oligo sequences of the primers were shown on Table 3.1.
Table 3.1: The sequences of primers used for microarray verification experiment via qRT-PCR (F: Forward primer, R: Reverse primer)
Primer ID Sequence (5’ 3’) Product Length (bp) Temperature(oC)
XIAP (F): TCACTTGAGGTTCTGGTTGC 113 60
XIAP (R) CGCCTTAGCTGCTCTTCAGT
SURVIVIN (F) GTTGCGCTTTCCTTTCTGTC 141 60
3.1.4 Western Blotting materials
3.1.4.1 Kits and reagents: ECL plus western blotting reagent was supplied from Amersham (UK; RPN2132) and SuperSignal West Femto reagents was obtained from Perbio Perbio (UK; 34095). Protein size marker was obtained from MBI Fermantas (PageRuler Prestained, Cat No: SM0671). 3.1.4.2 Antibodies: Calnexin primary antibody (CL731, Sigma) and anti-mouse HRP conjugated secondary antibody (A0168, Sigma) were kindly provided by Mehmet Ozturk group. Pro-apoptotic gene Bax primary antibody 529, Santa Cruz) and cell-cycle protein antibody (Cyclin E (SC-481, Santa Cruz) were kindly provided by K. Can Akcali Group. Anti-rabbit HRP conjugated secondary antibody was obtained from Santa Cruz (USA). The primary antibodies were diluted into 1:200 to 1:5000 concentrations, while the secondary antibodies were diluted in blocking solution (1:5000, as recommended by the supplier).
3.1.4.3 Protein transfer materials: Immobilen P transfer (PVDF; Roche; Germany), and 3mm Whatman filter paper (Whatman International Ltd.; Madison, USA) were used for protein transfer. 3.1.5 Electrophoresis, photography, spectrophotometer and autoradiography: The films (KODAK; Rochester, USA) were developed using Hyperprocessor (Amsderdam, UK). The power supply Power-PAC300 and Power-PAC200 were from Bio Rad Laboratories (CA, USA).
Beckman Spectrophotometer Du640 (CA, USA) and Nanodrop ND-1000 Full-spectrum UV/Vis Spectrophotometer purchased from Thermo Fisher Scientific (Wilmington, DE, USA) were used for protein visualization, gel electrophoresis and nucleic acid measurements, respectively.
3.1.6 Tissue culture reagents and cell lines: Dulbecco’s modified Eagle’s Medium (DMEM), and trypsin were obtained from Biochrom (UK); fetal bovine serum and penicillin/streptomycin were supplied from HyClone (Logan, USA). SW620 Colon Adenocarcinoma cells (ATCC; CCL-227) were kindly provided by Assist. Prof. Dr. Sreeparna Banerjee, METU.
3.1.7 Microarrays: HG-U133 plus 2 microarray chips and reagents were supplied from Affymetrix (USA).
3.1.8 Nicotine: Liquid nicotine was supplied from Sigma (USA; 54-11-5).
3.1.9 Cell proliferation experiment kits and reagents: Vybrant MTT cell proliferation kit was obtained from Invitrogen (V13154, USA).
3.2 SOLUTIONS and MEDIA
3.2.1 General solutions
50X Tris-acetic acid-EDTA (TAE): 2 M Tris-acetate, 50 mM EDTA pH 8.5. Diluted to 1X for working solution.
10X PBS: 80 g NaCl, 2 g KCl, 14.4 g Na2HPO4 and 2.4 g KH2PO4 were dissolved in 800 ml dH2O and adjusted the pH 7.4 with HCl. ddH2O was added to complete the final volume 1 liter. 2 M NaCl: 58.44 gr NaCl in 500 ml ddH2O
10% SDS: 100gr SDS was dissolved n 900 ml ddH2O and heated to 68 0C to assist dissolution. Then, pH was adjusted to 7.2 and final volume was completed to 1lt by adding ddH2O.
3.2.2 Cell culture solutions:
Complete media: DMEM was supplemented with 10% fetal bovine serum and 1% penicillin /streptomycin mixture and stored at 4oC.
Serum starvation media: DMEM was supplemented with 0.1% fetal bovine serum, 1% penicillin /streptomycin mixture and stored at 4oC.
Cell freezing solution: 5% DMSO and 95% complete media were mixed.
1XPBS: 10X PBS was diluted to 1X PBS solution with dd-water and adjusted pH at 7.4. Then, it was autoclaved and filtered before use.
Media with nicotine: 2 μl Nicotine was dissolved in 1248 μl serum starved tissue culture medium to make 10mM Nicotine stock solution, prepared freshly. 100nM, 1μM, and 10 μM nicotine
solutions were prepared via serial dilution from 10mM Nicotine stock solution. All work was performed in dark and in a fume cupboard.
3.2.3 SDS (Sodium Deodecyl Sulfate)-PAGE (Polyacrylamide Gel Electrophoresis) solutions: 30% Acrylamide mix (1:29): Per 100 ml: 29 g acrylamide, 1 g bisacrylamide in double-distilled water, filtered, degassed, and stored at 4°C (stock solution). 5X SDS gel-loading buffer 3.8 ml double-distilled water, 1 ml of 0.5 M Tris-HCl, 0.8 ml glycerol, 1.6 ml of 10% SDS, 0.4 ml of 0.05% bromophenol-blue. Before use, ß-mercaptoethanol was freshly added to a final
concentration of 5% to reach 1% when mixed with protein samples.
10% Ammonium persulfate (APS): 0.1 g/ml solution in double distilled water (Prepared freshly). 1.5 M Tris-HCl, pH 8.8: 54.45 g Tris base (18.15 g/100 ml) ~150 ml distilled water. Adjust to pH 8.8 with 1 N HCl. Completed to 300 ml with distilled water and stored at 4° C.
1 M Tris-HCl, pH 6.8: 12.14 g Tris base ~ 60 ml distilled water. Adjust to pH 6.8 with 1 N HCl. Completed to 100 ml with distilled water and store at 4° C.
3.2.4 Western-blotting solutions:
Semi-dry transfer buffer per liter: 2.5 gr Glycine, 5.8 gr Tris base, 3.7 ml 10% SDS, 200 ml MeOH were dissolved in ddH2O to a final volume of 1 lt.
10X Tris-buffer saline (TBS) Per liter: 100 mM Tris-base, 1.5 M NaCl, pH 7.6 in double distilled water.
TBS-Tween (TBS-T): 0.5% Tween-20 solution in TBS. (Prepared freshly)
Blocking solution: 5% (w/v) non-fat milk, 0.5% Tween-20 in TBS. (Prepared freshly).
NP40 lysis buffer: 150 mM NaCl, 50 mM Tris.Cl at pH 8.0, 1% NP40 and 1X protease inhibitor mix wered mixed in dd H2O.
Bradford working solution: 10 mg Coomassie brilliant blue was dissolved in 5 ml 95% ethanol and 10 ml 85% phosphoric acid completed to a final volume of 1 lt. with ddH2O. Then, the
2X protein loading buffer: 50 Mm Tris. HCl at pH 6.8, 2 Mm EDTA at pH 6.8, 1% SDS, 10% glycerol and 0.02% Bromophenol blue solutions.
5X Running Buffer: 15 gr Tris.base, 72 gr Glycine and 5 gr SDS were dissolved in ddH2O to a final volume of 1 lt.
Resolving Gel Solution: 12% polyacrylamide gel (15 ml) was prepared:
4.9 ml of dH2O, 6.0 ml of 30% Acrylamide mix, 3.8 ml of 1.5 M Tris, pH=8.8, 150 μl of 10% SDS,
150 μl of 10% APS, and 6 μl of TEMED.
Stacking Gel Solution: 5% polyacrylamide gel (8 ml) was prepared:
5.5ml of dH20, 1.3 ml of 30% Acrylamide mix, 1 ml of 1.0 M Tris, pH=6.8, 80 μl of 10% SDS, 80
μl of 10% APS, and 8 ml of TEMED. 3.3 METHODS
3.3.1 Cell culture techniques:
3.3.1.1 Cell lines: SW620 Colon Adenocarcinoma cell line (ATCC; CCL-227) is a lymph node derived metastatic colon adenocarcinoma. They were originally isolated from the tissue of a 51-year-old Caucasian male (blood group A, Rh+) (www.lgcstandards-atcc.org). They are epithelial cells and strongly adherent to the plate.
3.3.1.2 Growth conditions of the cell lines: SW620 cells were grown up in DMEM supplemented with 10% fetal bovine serum (FBS) and 1% penicillin/streptomycin mixture. The cells were
incubated in the 37oC incubator with 5% CO2. The cells were seeded to new flasks (or plates) in
1:3- 1:5 ratio, every 2-4 days before reaching 90% confluence. The complete media were aspirated and cells were washed with 1X PBS for two times. Trypsin/EDTA solution was added to the flask to force cells to detach from the surfaces. The cells were dispersed by pipetting with the fresh media. Then, the cells were transferred to new flasks after counting with a hematocytometer. One day later, the media were replaced with fresh media. Media and 1X PBS were kept at +4oC,
trypsin/EDTA was kept at -20oC. All cell culture solutions were heated to 37oC and equipment was
cleaned with 70% ethanol before use.
3.3.1.3 Cryopreservation of cell lines: Cells were harvested by using trypsin/EDTA and
neutralized by adding fresh growth medium. The cells were precipitated by centrifuge at 1200 rpm for 3 minutes. The media/trypsin mixture was aspirated and the cells were resuspended in freezing media containing 5% DMSO in complete medium; resuspended cells in the freezing media were transferred into cryotubes; stored at -80oC overnight and then transferred to the liquid nitrogen
tank for long-term storage.
3.3.1.4 Thawing of the frozen cell lines: The cells were thawed rapidly at 37oC and mixed with 3
ml complete growth medium; centrifuged at 1200 rpm for 3 minutes and precipitated. After removal of supernatant via aspiration, the cells were resuspended with fresh growth medium and transferred in 75-t flasks to 37oC.
3.3.2 Nicotine treatment of the cells
3.3.2.1 Time and dose-dependent nicotine treatments: Cells were harvested as described in section 3.3.1.2. Harvested cells were counted under the light microscope with hematocytometers. For 48 hours treatment, 10,000 cells/ well; for 72 hours 5000 cells/well; for 5 and 7 days 3000 cells/well; for 15 days 1000 cells/well were seeded into the 96 well-plates. The cells were
incubated for 24 h to attach the surface of the plate. After 24 h, the medium was replaced with the starvation medium to induce quiescence. After 24 h quiescence, the cells were treated with
different levels of serum with or without different nicotine concentrations (cells Seeded 24h 0.1% FBS treatment for quiescence 24h cells treated with different conditions for 48h or 7 days). To determine the optimum dose, a nicotine dose curve was applied using 100ηM, 1μM and 10μM concentrations of freshly prepared nicotine (in the media). Nicotine concentrations were prepared in 10% FBS containing complete media or 0.1% FBS containing serum-deprived media.
After obtaining the quiescent cells, freshly prepared nicotine including media was applied to the cells for 48 and 72 hours experiments. For 5, 7 and 15 days experiments; first cells were incubated in the nicotine media for 3 days and then the media were changed with freshly prepared media with nicotine. The media were changed in between every 3 days.
3.3.2.2 Nicotine treatment to the cells for RNA and protein extraction: The exponentially growing cells were harvested and counted. 1x 10⁶ cells were seeded to the 75 cm2 flasks in
complete media and were incubated for 24 h for attachment to the plate. 24 hours later, complete media was replaced with the 0.1% FBS containing media for inducing quiescence. After another 24h, the media was replaced with the nicotine containing media (four conditions: complete media-control, 1 μM nicotine in complete media, 0.1% FBS media, and 1μM nicotine in 0.1% FBS containing media) and cells were incubated in the treatment medium for 48 h. Then, the cells were harvested via scrapper in the ice-cold 1X PBS. Later, cells were centrifuged at 1200 rpm for 3 min at 4 oC and the cell pellets were subjected to liquid nitrogen for snap-frozen. Then the pellets were
stored at -80oC for further steps. Each condition had three biological replicas. The protein assays
were performed only for two biological replicas.
3.3.3 MTT cell viability assay: Vybrant MTT cell proliferation kit was used to see the cell proliferation rates of SW620 cells under different nicotine concentration and the results were obtained by ELISA reader. Firstly, MTT-powder was suspended in ice-cold 1 ml of 1X PBS and solution was kept in the dark. Later, the media including nicotine (or control media) were removed. 100 μl of medium without serum was added to cells in each well and two wells were kept for empty (for blank reading). Next, 10 μl of MTT solution was added to the each well. The cells were incubated for 4 h at 37oC. Then, the media with MTT solution was removed and 100 μl ice-cold
DMSO was added to the wells and mixed by pipetting. After 10 min incubation, the plates were read in Elisa-reader at 540 nm wavelength, with 450 nm reference wavelength. During analysis, blank wells were used for background reading and calculation. In MTT cell proliferation assay, the
significance of each condition’s effect was compared with the control using ANOVA followed by Fisher’s multiple comparison tests.
3.3.4 Microarray analyses:
3.3.4.1 Obtaining raw data: Four different conditions (Complete media control (1 replicate), 1μM nicotine-treated complete media (1 replicate), 0.1% FBS containing media control (2 replicates, and 1μM nicotine-treated 0.1% FBS containing media (2 replicates) were used for microarray experiments. The samples were prepared and hybridized on Affymetrix U133 plus 2 GeneChips. 5μg RNA sample was used for each experiment (amplification/labeling/hybridization). Amplification, labeling and hybridizations were performed at the Genomics Core Facility of Bilkent University by the facility technician under the supervision Assoc. Prof. Dr. Işık Yuluğ according to manufacturer’s protocols. Affymetrix analysis software GCOS was used to perform the preliminary probe-level quantification of the microarray data.
3.3.4.2 Data normalization: The data were further normalized using the justRMA
normalization method by using the BrbArray Tools, 3.7 Version (http://linus.nci.nih.gov/BRB-ArrayTools.html). The default option of RMA (with background correction, quantile
normalization, and log transformation) was used to generate the normalized intensity for each probeset. The quality of microarray sets were tested via BRBArray Tools, Affy Data Quality Control utility (Figure 4.3).
3.3.4.3 Determination of differentially expressed genes: Identification of differentially expressed genes was determined by BRB-Array-Tools using Class Comparison utility. The Geneset enrichment analysis with KEGG option (BrbArrayTools > Class Comparison > Between Group of Arrays) was performed with a threshold p-value <= 0.05. The differentially expressed genes were selected for the following conditions: Effects of nicotine on SW620 cells grown in 0.1% FBS supplemented media in the presence or absence of nicotine. Effects of serum starvation
on SW620 cells was identified by subtracting 0.1% FBS treated cell expression profile from 10% FBS-treated cell expression profile (single replicate fold change).
3.3.4.4 Gene Ontology (GO) analyses: After determination of the differentially expressed genes, the GO ontology analysis was performed in order to see the effect of nicotine on the biological functions and determine which biological functions were altered via nicotine and what kind of genes were differentially expressed under nicotine exposure conditions. To perform the GO ontology analysis, Webgstalt (WEB-based GEne SeT AnaLysis Toolkit) were used
(bioinfo.vanderbilt.edu/webgestalt). When performing the gene ontology analyses,
hyper-geometric test were used with a p-value<0.05 and two genes were selected as a minimum number of genes. Level 4 and 5 were chosen for the biological level and molecular functions’ graphics. If the groups were significant according to selected criteria, the functions were written in red color. The graphs are shown in the Appendix A.
3.3.4.5 Cluster analysis: Cluster 3.0 software together with Java TreeView software were used to hierarchically cluster the targeted genes according to different conditions of our microarray
analyses. Upon median gene centering average linkage method of hierarchical clustering process was performed. During this process, both gene and array clustering were done, uncentered correlation was calculated to find the similarity.
3.3.4.6 Pathway Miner analysis: It is important to observe the interactions between genes and/or proteins to understand the biological system in a holistic manner. Pathway Miner is one of the freeware programs that allow for visualization of genes that have roles in the same pathway thus each node represents a gene and each edge represents a co-occurrence within a cellular signaling or metabolic pathway (http://www.biorag.org). Differentially expressed gene lists obtained from different comparisons were filtered based on fold-change and consistency between experiments criteria and visualized using Pathway Miner.
3.3.5 Microarray Verification- RNA experiments
3.3.5.1 Total RNA isolation: Total RNA isolation was performed directly by using Promega SV Total RNA isolation kit according to the manufacturer’s instructions. The RNA was eluted in a total volume of 50 μl RNAse free-H2O. The concentration of the isolated RNA and the ratio of
absorbance at 260 nm/280 nm were measured with the Nanodrop ND-1000 spectrophotometer. Isolated RNA samples were stored at -80oC. For microarray analyses, 5μg/8μl concentration of
RNAs were prepared. The integrity of isolated RNA samples for microarray chips was measured with the Agilent 2100 Bioanalyzer (Agilent Technologies, USA). The RNA integrity number (RIN) values and RNA concentrations were shown on Table 4.1.
3.3.5.2 cDNA synthesis: For qRT-PCR experiments 2μg RNA used to get cDNAs. RevertAid first strand cDNA synthesis kit was used for cDNA production according to the manufacturer’s
instructions.
3.3.5.3 Quantitative real time RT-PCR experiments: For qRT-PCR mastermix, 10μl SYBR-Green qRT-PCR kit, 8 μl dd-H2O, 0.5 μl 20 pmol forward primer, 0.5 μl 20 pmol reverse primer
and 1 μl cDNA sample were put into RT-PCR plates. 10μl of mineral-oil used to cover the surface of the mixture. Then the plate was sealed with the plastic wrap and was put into the iCycler analyzer.
3.3.5.4. Quantification of relative expression with respect to GAPDH: Threshold cycles were determined using iCycler visualization tools for target and GAPDH gene expression curves. Unmodified ΔΔCT method was used by using 2 as the efficiency. The formula of ΔΔCT method is:
ΔΔCT= (Avg. ΔCT, target - Avg. ΔCT,GAPDH), where ΔCT = (Avg. CT,target - Avg. CT,GAPDH) [79].
3.3.6 Protein preparation and Western Blot experiments:
3.3.6.1 Protein extraction: The cell pellet was lysated in the NP40 lysis buffer (explained in 3.2.4) and vortexed at every 5 min for half an hour and kept on ice during this period. Later lysates
were centrifuged at 13000 rpm for 30 min at +4oC, the supernatant, which contains the proteins,
was collected and stored at -80oC for quantification by Bradford assay and Western blot
experiments.
3.3.6.2 Quantification of protein concentrations: The concentration of cell lysed was detected by Bradford assay. 2 μl of protein samples were mixed with 98 μl of ddH2O and then 900 μl of Bradford working solution was added to the sample to finalize the volume to 1 ml. For the blank, 2 μl of NP40-lysis buffer was added to the 98 μl of ddH2O and then 900 μl of Bradford working solution was added to this mix. After 5 min of incubation, the protein concentrations were measured at OD595 λm versus blank solution. In order to calculate the protein concentrations, a
standard curve was generated by using different concentrations of BSA protein. 1 mg BSA was dissolved in 1 ml of ddH2O to make 1mg/ml BSA concentration. Then, 0, 1, 2, 4, 8, 16, and 32 μl of BSA added to 100, 99, 98, 96, 92, 84 and 68 µl of ddH2O, respectively and 900 μl of Bradford working solution was put into all of these samples. After 5 min of incubation, the OD595 λm values
of each samples were measured and the standard curve was prepared with these values. The
unknown concentrations of the samples were calculated by using this from the standard curve. The concentration data of the protein samples are given in Table 4.3.
3.3.6.3 Western blotting:
3.3.6.3.1 SDS polyacrylamide gel electrophoresis:
The gel apparatus was set and resolving and stacking gel solutions (explained at 3.2.4 part) were loaded. Equal amounts (50 μg/well) of proteins were mixed with 6X loading dye containing 1% β-mercaptoethanol and boiled in the water for 5 min to denature the proteins and break S-S bonds. Then, samples and Fermentas PageRuler Protein size marker were loaded on gel. Gels were run at 80 V during until the samples leave the stacking gel and 120 V when the samples were run at resolving gel in the 1X running buffer. The run was stopped just after loading dye leaves the gel.
3.3.6.3.2 Protein transfer to PVDF Membrane: Since all of our targeted proteins were smaller than 120 kDa, semi-dry transfer was performed. Whatman papers and PVDF membranes were cut in suitable sizes with gels. The membranes were incubated into 100% methanol for 30 seconds and then, immediately merged into ddH2O for 2 min. Later, whatman papers and membrane were
incubated into the semi-dry transfer buffer for 5 min. Then 2 whatman papers, PVDF membrane, gel, and another 2 whatman papers were put on top of each other into the tank. Then the system was set to 160mA and the proteins were run for 30 min.
3.3.6.3.3 Immunological detection of membrane transferred proteins: The membrane was incubated with 5% blocking solution for an hour on a slowly rotating platform to get rid of non-specific bindings. After blocking, the membrane was washed with 0.1% TBS-T three times for 5 min. The membrane was incubated overnight with primary antibody at +4oC on a slowly rotating
platform, or alternatively incubated at room temperature for 1 hour. After, the membrane was washed with 0.1% TBS-T three times for 5 min, the membrane was incubated with HRP-conjugated secondary antibody together with the primary for an hour at room temperature on a slowly rotating platform. Then, the membrane was washed three times with 0.1% TBS-T for 5 min. Then, the membrane was treated with ECL plus or FEMTO reagents for 5 min, according to the manufacturer’s instructions, and was wrapped with stretch film. The autoradiography was performed for various exposure times to obtain the different signal intensities of the labeled proteins.
CHAPTER 4. RESULTS
4.1 Determination of optimum time and dose of nicotine treatment
4.1.1 Nicotine treatment of the SW620 cells and its effect on cell proliferation
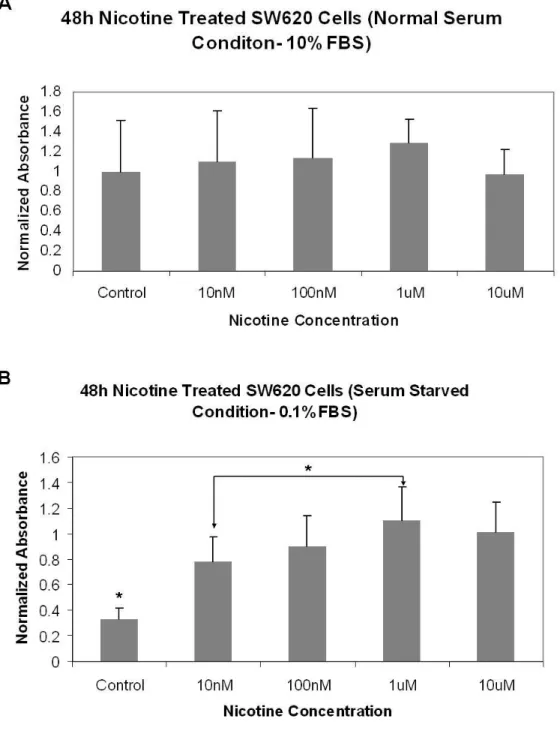
The effect of different nicotine concentrations (10ηM, 100ηM, 1µM, and 10µM) on SW620 cell proliferation activity was tested to determine the dose of nicotine and suitable time (48h and 7 days) course of the treatment while cells the cells were grown in 10% FBS or 0.1% FBS containing culture media. MTT cell proliferation assay was used to test for cell proliferation activity. Our findings indicated that SW620 cells were responsive to 0.1% FBS serum-starvation at 48 hours and 7 days by a reduction of 67% and ca. 99.9%, respectively when compared with physiological serum level (Figure 4.1 and Figure 4.2). Nicotine showed a different effect at 0.1% and 10% FBS serum levels (Two way ANOVA; P-value (serum) <0.001; P-value (dose) = 0.105).
One-Way ANOVA results demonstrated that nicotine at concentrations starting from 10ηM to 10µM consistently rescued the loss of cell proliferative activity while at 1µM concentration nicotine exhibited the highest rescue power (Figure 4.1B) under serum-starved conditions at 48 h. No effect of nicotine was observed under physiological serum levels (10% FBS) (Figure 4.1A). Similarly, cell proliferation activity differed significantly between the cells grown in 0.1% FBS and 10% FBS at day 7 (Two way ANOVA; P-value (serum) <0.001; P-value (dose) = 0.922).
Interestingly, nicotine at 1µM significantly inhibited the cell proliferative activity when compared with control at 10% FBS-treated cells, while other doses of nicotine did not affect the cell
proliferation ratio extensively at day 7 (Figure 4.2A). On the other hand, One-Way ANOVA implicated significant induction of cell proliferation in response to all doses of nicotine while
100ηM nicotine treated cells exhibited a more significant response (Figure 4.2B) under serum starved conditions.
Figure 4.1: MTT cell proliferation results for 48h nicotine treated quiescent SW620 colon
adenocarcinoma cells. A) MTT cell proliferation results for 48h nicotine treated quiescent SW620 colon adenocarcinoma cells under normal (10% FBS in media) growth conditions. One-Way ANOVA were performed to indicate the significance level (F-value = 0.36, DF = 4, P-value =
0.835). B) MTT cell proliferation results for 48 h nicotine-treated quiescent SW620 colon
adenocarcinoma cells under serum deprived (0.1% FBS in media) conditions. One-Way ANOVA findings followed by multiple comparisons were indicated with asterisks (F-value = 8.05, DF = 4, P-value = 0.001). Asterisk represents the significantly different sample from other samples. (Asterisk with arrows indicates that only samples that were shown by arrows are significantly different from each other.)
Figure 4.2: MTT cell proliferation results for 7 days nicotine treated quiescent SW620 colon adenocarcinoma cells. A) MTT cell proliferation results for 7 days nicotine treated quiescent SW620 colon adenocarcinoma cells under normal (10% FBS in media) serum conditions. (One-Way ANOVA; F-value =1.58, DF = 4, P-value = 0.230). B) MTT cell proliferation results for 7 days nicotine treated quiescent SW620 colon adenocarcinoma cells under serum deprived (0.1% FBS in media) conditions (One-Way ANOVA; F-value = 89.20, DF = 4, P-value < 0.001). (Asterisk represents the significantly different sample from other samples. Asterisk with arrows indicates that only samples that were shown by arrows are significantly different from each other.)
4.2 Microarray Experiments
4.2.1 Quality Control of RNA samples and microarray chips 4.2.1.1 Pre-hybridization quality control of the RNA samples
To investigate the acute effect of nicotine on the cells, 48 hour treatment time and 1µM nicotine dose were used for the microarray experiments to determine the gene expression profile of the cells. Accordingly, the RNA samples from the cells grown in 0.1% and 10% FBS containing media with or without 1µM nicotine addition were extracted as described in the Materials and Methods section (Table 4.1). Initially, RNA sample quality and quantity analyses were performed with Agilent 2000 Bioanalyzer and Nanodrop. The results showed that we have high quality RNA samples (Table 4.1).
4.2.1.2 Post-hybridization quality control of microarray results
Post-hybridization quality control analyses also showed that all samples had similar degradation slopes (Figure 4.3) and comparable background, 5’3’-GAPDH and ACTIN values as well as scaling factors (Table 4.2).
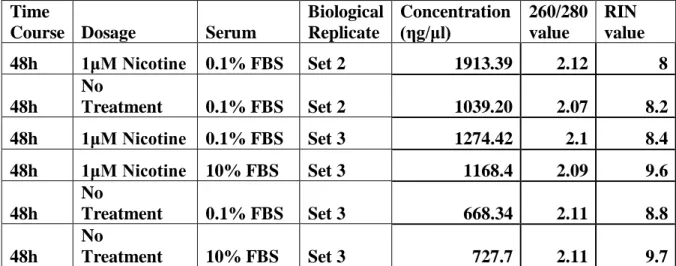
Table 4.1: The list of experimental conditions of the SW620 cells and the concentration and RIN values of the RNA samples that were prepared for microarray experiments.
Time
Course Dosage Serum
Biological Replicate Concentration (ηg/μl) 260/280 value RIN value 48h 1μM Nicotine 0.1% FBS Set 2 1913.39 2.12 8 48h No Treatment 0.1% FBS Set 2 1039.20 2.07 8.2 48h 1μM Nicotine 0.1% FBS Set 3 1274.42 2.1 8.4 48h 1μM Nicotine 10% FBS Set 3 1168.4 2.09 9.6 48h No Treatment 0.1% FBS Set 3 668.34 2.11 8.8 48h No Treatment 10% FBS Set 3 727.7 2.11 9.7 A
![Table 1.1: The stages of the colorectal cancer [15].](https://thumb-eu.123doks.com/thumbv2/9libnet/5844979.119837/21.893.101.787.888.1109/table-stages-colorectal-cancer.webp)