Effect of Discharge Fluctuation on Water Quality Variables from the
Yeşilırmak River
Ahmet KURUNÇ1 Kadri YÜREKLİ1 Fazlı ÖZTÜRK2 Geliş Tarihi: 03.01.2005
Abstract: In this study, streamflow and water quality variables including specific conductivity (EC), water temperature, Na+, K+, Ca2++Mg2+, CO
32-, HCO3-, Cl-, SO42- B, sodium adsorption rate (SAR), hardness and total salt (TS),
relationships and hysteresis diagrams were investigated to determine the major processes affecting water quality in the Yeşilırmak River. The base-flow water discharge was observed between July and February whereas March April and May represent a peak as a result of seasonal rainfall, snowmelt and run-off. The results indicate that most variables exhibit clockwise hysteresis with high values during the base-flow and lower values during the high discharge. There is a negative relationship between discharge and water quality variables including EC, Na+, K+, Ca2++Mg2+, HCO
3-, Cl-,
SO42-, SAR, hardness and TS. However, no relationship was obtained between discharge and water temperature, pH,
CO32- and B. Among the water quality variables EC, Ca2++Mg2+, HCO3-, SO42-, hardness and TS exhibit an open
clockwise loop whereas pH, Na+, K+, Cl- CO
32-, SAR and B exhibit a complex loop. Water temperature was the only
variable that exhibits counterclockwise loop.
Key Words: Streamflow, water quality variables, hysteresis, Yeşilırmak River
Debideki Değişimin Yeşilırmak Nehri Su Kalitesi Parametrelerine Etkisi
Öz: Bu çalışmada Yeşilırmak Nehri sularının kalitesini etkileyen esas süreçleri belirlemek amacıyla debi ile su sıcaklığı, Na+, K+, Ca2++Mg2+, CO
32-, HCO3-, Cl-, SO42- B, sodyum adsorpsiyon oranı (SAR), su sertliği ve toplam tuz (TS)
gibi değişik su kalitesi parametreleri arasındaki ilişki ve histerisis diyagramları incelenmektedir. Mevsimsel yağışlar, kar erimesi ve yüzey akış nedeniyle Mart, Nisan ve Mayıs ayları debinin en fazla olduğu dönemi temsil ederken en düşük akım Haziran ve Şubat ayları arasında gözlemlenmiştir. Çalışma sonuçlarına göre su kalitesi parametrelerinin çoğunluğu debinin düşük olduğu dönemlerde yüksek, debinin yüksek olduğu dönemlerde ise düşük değerlere sahip olup saat yelkovanı yönünde histerisisler sergilemektedir. Debi ile EC, Na+, K+, Ca2++Mg2+, HCO
3-, Cl-, SO42-, SAR, su sertliği
ve TS arasında ters yönde bir ilişki bulunmuştur. Buna karşın, debi ile su sıcaklığı, pH, CO32- ve B arasında bir ilişki
bulunamamıştır. Su kalitesi parametrelerinden pH, Na+, K+, Cl- CO
32-, SAR ve B karmaşık bir döngüye sahipken EC,
Ca2++Mg2+, HCO
3-, SO42-, su sertliği ve TS saat yelkovanı yönünde bir döngü göstermektedir. Yalnızca su sıcaklığı saat
yelkovanının tersi yönde bir döngü göstermektedir.
Anahtar Kelimeler: Debi, su kalitesi parametreleri, histerisis, Yeşilırmak Nehri
1 Gaziosmanpaşa Üniv. Ziraat Fak. Tarımsal Yapılar ve Sulama Bölümü-Tokat 2 Ankara Üniv. Ziraat Fak. Tarımsal Yapılar ve Sulama Bölümü-Ankara
Introduction
The discharge volume of a river is a major factor in understanding the river system. In many rivers, flow will change with time by as much as several orders of magnitude. Since the concentrations of most dissolved constituents in streams decrease during periods of high streamflow and increase during base flow (Anderson et al. 1997, House et al. 1998, Besser and Leib 1999), it is important to characterize seasonal concentration patterns of water quality variables over an entire annual cycle. An understanding of when constituent concentrations are highest, improves the ability of scientist to evaluate the potential changes to the health of aquatic ecosystems and/or usage of water for other purposes. Several years of sample collection often are needed to adequately characterize an annual water-quality cycle because wet, dry, and normal years may have dissimilar water-quality patterns (Leib et al. 2003).
Graphs can communicate complex ideas with clarity, precision and efficiency. They reveal patterns in sets of
data and are often more illustrative than statistical computations. The general objective in graph construction is to concentrate a large amount of quantitative information in a small space so that a comprehensive overview of that information is readily available to the viewer. If discharge is plotted on a time series graph, flood peaks will dominate the discharge scale but will be infrequent on the time scale. Similar features may exist for the concentration of one or more variables in a river, such as suspended sediment concentration. The relationship between concentration of a variable and river discharge can be clearly demonstrated in a plot in which concentration is plotted against flow (Whitfield and Whitley 1986, Whitfield and Clark 1992). A pattern measured in many streams is a tendency for water during a rising stage to have a considerably higher concentration than water passing a sampling point at an equal flow rate after peak discharge has passed (Hem 1985). This condition is referred to as “hysteresis”. The concentration- flow pairs are plotted in the order in which they are
observed and the points are connected in the same order. The hysteresis diagram, showing each data point, indicates that the concentration of a variable can be different when stream discharge is decreasing from what it is at times of increasing discharge.
The present study examines 18 years of water quality and streamflow records from the Yeşilırmak River at Durucasu and describes the processes, which control the quality, and assesses the presence of trend in the record.
Materials and Methods
The Yeşilırmak Basin is one of the twenty-six major basins in Turkey. The water of the river is mostly used for irrigation in addition to drinking, swimming, fishing, wildlife habitat, etc. The river in the basin originates north of Sivas, flows approximately 519 km and reaches to the Black Sea. It drains an area of 38,730 km2, which is about 5% of Turkey’s surface area. The basin of the river is bounded 39º 30' and 41º 21' N, and 34º 40' and 39º 48' E. The land rises from an altitude of the sea level to 2800 m. In terms of land use, there are about 39% forest regime, 39% cropland and 19% pasture land in the basin. The basin is located on the north Anatolia fault line that is one of the most effective faults in the world and is formed under hercynian, alpine orogeny and epiorogeny movement. Therefore, the rock formations on the basin have a broken and curled structure. The rock formation as sandstone, claystone, andesite, volcanic bressica and tuff are common on the area (Anonim 1970).
The headwaters of the river and most of its tributaries originate in the mountains that form the eastern and southern boundaries of the basin. The major tributaries to the Yeşilırmak River are Kelkit, Çekerek, Çorum Çat and Tersakan Streams (Figure 1). Durucasu water quality monitoring station is located about 33 km downstream of city of Amasya. The coordinates of the water quality monitoring station is 40º 44' 40'' N and 36º 06' 43'' E. The drainage area of the monitoring station is about 21,650 km2. Figure 1 shows the location of the Durucasu monitoring station in Yeşilırmak Basin.
The General Directorate of Electric Power Research Survey and Development Administration (EIE) measures
Figure 1. Location map of the monitoring station
water flow (Q) in m3/s, and water quality variables including specific conductivity (EC) in µS cm-1,
temperature (T) in oC, sodium (Na+), potassium (K+), calcium+magnesium (Ca2++Mg2+), carbonates (CO
32-),
bicarbonates (HCO3-), chlorides (Cl-), sulfates (SO42-) and
boron (B) in mg L-1 and pH. In addition to these water
quality variables, calculated sodium adsorption rate (SAR), hardness in FrSo, and total salt (TS) in mg L-1 are also
used in this study. The records for these variables available for the analysis as presented in this paper are on a monthly basis for the period 1970–2001. Since there are many missing values between 1970-1983, the data were examined only for the period 1984 to 2001 (Anonymous 1996).
Time series plots for values of discharge and water quality variables including water temperature, pH, EC, Na+, K+, Ca2++Mg2+, CO32-, HCO3-, Cl-, SO42-, SAR,
hardness and TS from the Yeşilırmak River at Durucasu over 18-year from 1984 to 2001 were prepared. Also trend lines were included in these plots in order to visual examination of trends for each variable. In addition to these plots, the following non-parametric test (Spearman’s Rho test) is applied to decide whether trend exists in the monthly data. The Spearman’s Rho test recommended by Gibbons (1997) is given as,
Di = Ui – Vi (1)
1)
(n
*
n
D
*
6
1
R
2 2 i sp=
−
−
∑
(2) 1/2 2 sp sp cal)
R
(1
2)
(n
*
R
t
⎥
⎥
⎦
⎤
⎢
⎢
⎣
⎡
−
−
=
(3)Where; Di is the difference between rank of ith observation
in the original time series data (Ui) and rank of ith
observation in the time series data arranged in the ascended order (Vi), Rsp is the rank order correlation
coefficient, n is the number of observations and tcal is the
calculated t value. To determine whether there is a trend, the calculated tcal valuein Equation 3 should be compared
to the t-critical value (±1.960) from the tables. If the tcal
value lies within the 5% significance interval, the data has no trend. The value of the correlation coefficient of rank (Equation 2) is always between –1 and +1. The sign of Rsp
indicates the sign of the slope of the relationship, and the absolute value indicates the strength of the relationship (Gibbons 1997).
Water-quality profiles and hydrographs of discharge for each month averaged over study period were plotted to illustrate seasonal increases or decreases in concentration and to show variation of water quality variables with discharge. Also hysteresis diagrams were prepared to determine the dominant processes affecting the concentrations of the water quality. In order to present relationships between water quality variables and discharge from the Yeşilırmak River at Durucasu, monthly values averaged over 18-year (1984-2001) of each water
quality variables and discharge were used. Similarly, for the hysteresis diagrams, monthly values averaged over 18-year for each of the examined water quality variables were plotted against discharge of the corresponding monthly values averaged over 18-year.
Results and Discussion
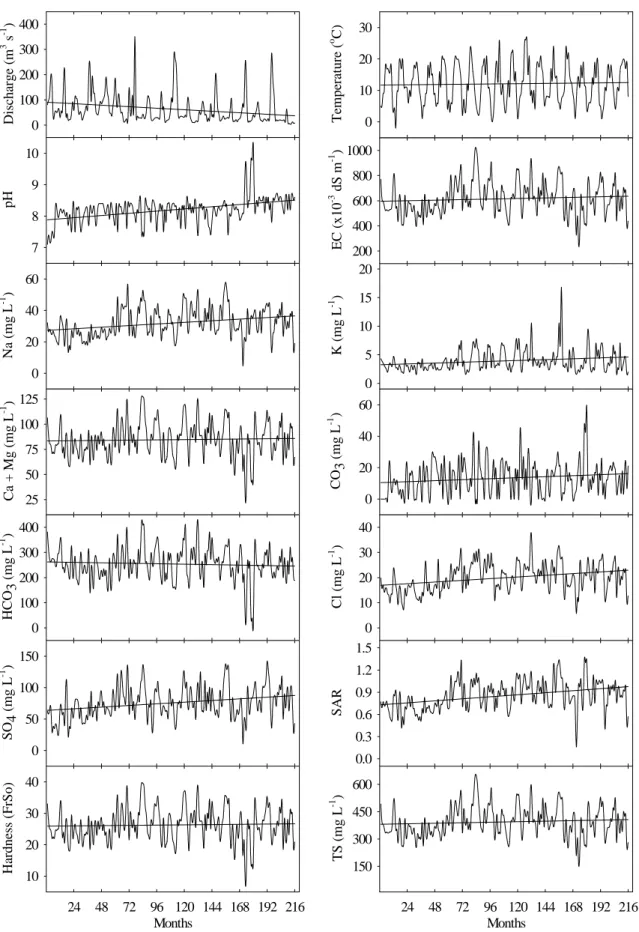
Time series of monthly measured values of selected water quality variables at Durucasu water quality monitoring station of the Yeşilırmak River during 18-year period from 1984 to 2001 are presented in Figure 2. The following observations can be stated (Figure 2): many water quality variables showed striking seasonal variations, however, none of these variations seems to be uniform. The reasons for these variations may depend on discharge and seasonality. The magnitudes of the fluctuations in EC, Na+, Ca2++Mg2+, HCO
3-, SO42-, and TS
were much greater than those of concentrations of K+ and Cl- and calculated SAR values. Considering the study
period of 18-year, values of EC and concentrations of Ca2++Mg2+, HCO
3- and TS were relatively stable whereas
there were rather slow increase in concentrations of K+ and relatively high increase in concentrations of Na+, Cl
-and SO42- and calculated SAR values (Kurunç et al. 2005).
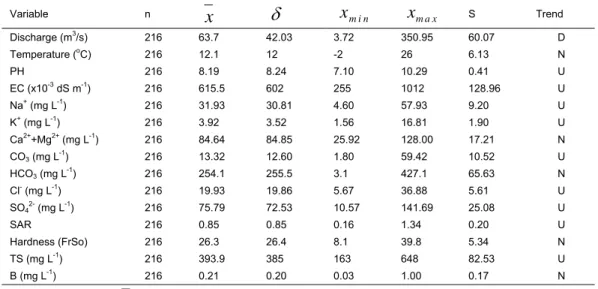
A summary of water-quality and streamflow data for the monitoring station is presented in Table 1. Minimum, maximum, median, and mean values for discharge, water temperature, pH, EC, Na+, K+, Ca2++Mg2+, CO32-, HCO3-,
Cl-, SO42-, SAR, hardness, TS and B were calculated for
the station. The ratio of the highest to lowest concentration was very large for HCO3- (140:1) followed by SO4
2-(13.4:1), Na+ (12.6:1), K+ (10.8:1) and SAR (8.6:1). There was low ratio for Cl- (6.5:1) and Ca2++Mg2+ (4.9:1). The dominant cation and anion in the water of Yeşilırmak River at Durucasu was Ca2++Mg2+ and HCO
3-, respectively.
Trend analysis is important for determining which portion of a water-quality data set is representative of current conditions. Considering the results of Spearman’s Rho test, if a trend was detected for time series of discharge and water quality variables, the direction of trend is given as upward (U) or downward (D) in Table 1. Considering the study period of 18-year, an increased trend was observed for the all water quality variables except water temperature, Ca2++Mg2+, HCO
3-, hardness
and B (no trends), whereas streamflow showed a decreased trend.
The measured values of water quality variables in phase with discharge are shown in Figure 3 for each month averaged over 18-year from 1984 to 2001. Examination of hydrograph in Figure 3 showed that discharge revealed a peak during March April and May. This peak was a result of snowmelt and seasonal rainfall. The plot also revealed a base-flow water discharge between July and February. Among water quality variables, EC, Na+, K+, Ca2++Mg2+, HCO3-, Cl-, SO42-,
SAR, hardness, and TS showed a strong seasonal pattern, with a peak occurring between November and February during the lowest discharge. In general, low values of these variables were seen in April and May
during the period of highest discharge. Although EC, Na+, Ca2++Mg2+, HCO
3-, Cl-, SO42-, hardness and TS also
peaked in June, recovery to maximum levels was slower than November-February peaks. Sodium adsorption rate also showed a secondary peak between July and August. A different pattern was observed for pH, CO32- and B. In
general, the lowest values for these variables were observed in March and July, whereas the primary peak was obtained during September and October. As it was expected, the seasonal pattern of water temperature was low during November and March whereas high in June, July and August (Figure 3). In general, there is a negative relationship between the values of all water quality variables (except water temperature, pH, CO32- and B) and
discharge. That is, as discharge increased the values and concentration of these variables decreased. Major ions from most of the rivers studied by Whitfield and Whitley (1986) exhibited negative relationship with discharge. They claimed that snowmelt and surface run-off, which cause high discharge, dilute groundwater during freshet and, as a result, ion concentration decreases.
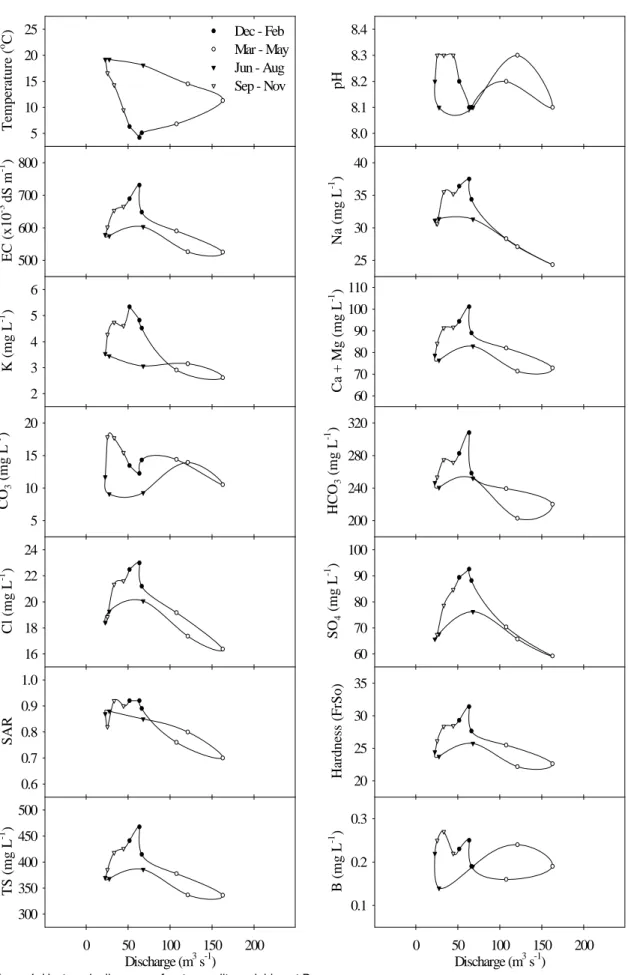
As well as suggesting the major processing affecting water chemistry, hysteresis diagrams clearly display the relationship between variables and discharge. Three patterns of hysteresis diagrams were observed. They are open clockwise loops, open counterclockwise loops and complex loops. The hysteresis diagrams for all the analyzed water quality variables were presented in Figure 4 and summarized in Table 2. Williams (1989) stated that if peaks in the major ion concentrations occurred before the discharge peaks, an open clockwise loop is the case. Visual inspection of the hysteresis diagrams for most of the water quality variables including EC, Ca2++Mg2+, HCO3-, SO42-, hardness and TS did indeed show this
clockwise loop. Whitfield and Clark (1992) obtained similar hysteresis loops for the major ions. The clockwise hysteresis diagram shows that ion concentration is higher in the pre-freshet period than in the post-freshet period. This is most probably due to greatest amount of dilution occurred during the post-freshet period. Although Na+, K+, Cl- and SAR showed similar seasonal pattern with EC,
Ca2++Mg2+, HCO3-, SO42-, hardness and TS, which were
exhibited clockwise rotations, a complex pattern in hysteresis diagrams was observed for these four variables. The fact that one finds variables which exhibit different patterns in one system suggest that the mechanisms which control these variables are different from those that control other variables (Whitfield and Clark 1992). Water temperature was the only variable that exhibit counterclockwise loop (Figure 4 and Table 2).
Conclusion
The result of the hydrologic processes active in the watershed affects the water chemistry of rivers. These seasonal processes cause the variation in water quality parameters. There is significant seasonal variation in the Yeşilırmak watershed. The base-flow water discharge was observed between July and February whereas March April and May represent the high-flow as a result of snowmelt and run-off. Major water quality variables exhibit a negative relationship to discharge, and the pattern of
Dis ch arg e ( m 3 s -1 ) 0 100 200 300 400 T em p era tur e ( o C) 0 10 20 30 pH 7 8 9 10 Na (m g L -1 ) 0 20 40 60 K (mg L -1 ) 0 5 10 15 20 Ca + Mg (mg L -1 ) 25 50 75 100 125 CO 3 (mg L -1 ) 0 20 40 60 HC O3 (mg L -1 ) 0 100 200 300 400 Cl ( m g L -1 ) 0 10 20 30 40 SO 4 (mg L -1 ) 0 50 100 150 SA R 0.0 0.3 0.6 0.9 1.2 1.5 Months 24 48 72 96 120 144 168 192 216 H ard ness ( F rS o ) 10 20 30 40 Months 24 48 72 96 120 144 168 192 216 TS (mg L -1 ) 150 300 450 600 EC (x 10 -3 dS m -1 ) 200 400 600 800 1000
50 100 150 200 250 T ( oC) 5 10 15 20 25 Discharge Temperature 50 100 150 200 250 pH 8.0 8.1 8.2 8.3 8.4 Discharge pH Months 1 2 3 4 5 6 7 8 9 10 11 12 50 100 150 200 250 TS ( m g L -1 ) 300 350 400 450 500 Discharge Total salt Months 1 2 3 4 5 6 7 8 9 10 11 12 50 100 150 200 250 B (m g L -1 ) 0.1 0.2 0.3 Discharge Boron 50 100 150 200 250 EC (x 10 -3 dS m -1 ) 500 600 700 800 Discharge Electirical Conductivity 50 100 150 200 250 Na (m g L -1 ) 25 30 35 40 Discharge Sodium 50 100 150 200 250 K (mg L -1 ) 2 3 4 5 6 Discharge Potassium 50 100 150 200 250 Ca + M g ( m g L -1 ) 60 70 80 90 100 110 Discharge Calcıum + Magnesium D i s c h a r g e ( m 3 s -1 ) 50 100 150 200 250 CO 3 (m g L -1 ) 5 10 15 20 Discharge Carbonate D i s c h a r g e ( m 3 s -1 ) 50 100 150 200 250 HC O3 (m g L -1 ) 200 240 280 320 Discharge Bicarbonate 50 100 150 200 250 Cl ( m g L -1 ) 16 18 20 22 24 Discharge Chloride 50 100 150 200 250 SO 4 (m g L -1 ) 60 70 80 90 100 Discharge Sulphate 50 100 150 200 250 SA R 0.6 0.7 0.8 0.9 1.0 Discharge Sodium Ad. Ratio
50 100 150 200 250 Hardne ss (FrS o) 20 25 30 35 Discharge Hardness
T em p erat ur e ( o C) 5 10 15 20 25 Dec - Feb Mar - May Jun - Aug Sep - Nov pH 8.0 8.1 8.2 8.3 8.4 Discharge (m3 s-1) 0 50 100 150 200 TS ( m g L -1 ) 300 350 400 450 500 Discharge (m3 s-1) 0 50 100 150 200 B ( m g L -1 ) 0.1 0.2 0.3 EC ( x1 0 -3 dS m -1 ) 500 600 700 800 Na (m g L -1 ) 25 30 35 40 K (mg L -1 ) 2 3 4 5 6 Ca + M g ( m g L -1 ) 60 70 80 90 100 110 CO 3 (m g L -1 ) 5 10 15 20 HC O3 (m g L -1 ) 200 240 280 320 Cl ( m g L -1 ) 16 18 20 22 24 SO 4 (m g L -1 ) 60 70 80 90 100 SA R 0.6 0.7 0.8 0.9 1.0 Hardn es s (FrS o) 20 25 30 35
Table 1. Statistical parameters of the time series of monthly values for water quality variables and discharge at Durucasu Variable n
x
δ
x
minx
max S Trend Discharge (m3/s) 216 63.7 42.03 3.72 350.95 60.07 D Temperature (oC) 216 12.1 12 -2 26 6.13 N PH 216 8.19 8.24 7.10 10.29 0.41 U EC (x10-3 dS m-1) 216 615.5 602 255 1012 128.96 U Na+ (mg L-1) 216 31.93 30.81 4.60 57.93 9.20 U K+ (mg L-1) 216 3.92 3.52 1.56 16.81 1.90 U Ca2++Mg2+ (mg L-1) 216 84.64 84.85 25.92 128.00 17.21 N CO3 (mg L-1) 216 13.32 12.60 1.80 59.42 10.52 U HCO3 (mg L-1) 216 254.1 255.5 3.1 427.1 65.63 N Cl- (mg L-1) 216 19.93 19.86 5.67 36.88 5.61 U SO42- (mg L-1) 216 75.79 72.53 10.57 141.69 25.08 U SAR 216 0.85 0.85 0.16 1.34 0.20 U Hardness (FrSo) 216 26.3 26.4 8.1 39.8 5.34 N TS (mg L-1) 216 393.9 385 163 648 82.53 U B (mg L-1) 216 0.21 0.20 0.03 1.00 0.17 NNotes: n: sample size,
x
: mean,δ
: median, : minimum value, : maximum value, : standard deviation, D: downward trend, N: no trend, U: upward trendn i m
x
x
maxs
Table 2. Patterns of hysteresis in water quality variable-discharge relationship at Durucasu
Relationship to
discharge Clockwise clockwise Counter- pattern No Positive Negative EC Ca2++Mg2+ TS HCO3 SO -4 2-Hardness Na+ K+ Cl -SAR None Temperature PH CO3 2-B
hysteresis shows a differential snowmelt dilution between in spring and summer. Water temperature, pH, CO32- and
B were independent of discharge. A complex pattern was observed for pH, CO32- and B. Water temperature was the
only variable that exhibits counterclockwise loop. Most of water quality variables showed an increased trend whereas streamflow has a decreased trend.
References
Anderson, S. P., W. E. Dietrich, R. Torres, D. R. Montgomery and K. Loague. 1997. Concentration discharge relationships in runoff from a steep, unchannaeled catchment. Water Resources Research 33 (1): 211–225.
Anonymous, 1996. Water Quality Data for Surface Waters in Turkey, The General Directorate of Electric Power Research Survey and Development Administration (EIE) 96-4, ISBN 975-7566-54-3.
Anonim, 1970. Yeşilırmak Havzası Toprakları. Topraksu Genel Müdürlüğü Yayın No: 241, Ankara.
Besser, J. M. and K. J. Leib. 1999. Modelling frequency of occurrence of toxic concentrations of zinc and copper in the Upper Animas River Ed. D. W. Morganwalp, H.T. Buxton, U.S. Geological Survey Toxic Substances Hydrology program-Proceedings of the Technical Meeting, Charleston, S. C., March 8–12, 1999: U.S. Geological Survey Water-Resources Investigations Report 99–4018A, p. 75–81.
Gibbons, J. D. 1997. Nonparametric Methods for Quantitative Analysis. American Sciences Press, Inc., 537 p., Ohio – USA.
Hem, J. D. 1985. Study and Interpretation of the Chemical Characteristics of Natural Water: U.S. Geological Survey Water-Supply Paper 2254, 263 p.
House, W. A. and M. S. Warwick. 1998. Hysteresis of the solute concentrations/discharge relationships in rivers during storms. Water Research 32 (8): 2279-2290.
Kurunç, A., K. Yürekli and E. Yurtseven. 2005. Determination of sudden changes in time series of Yeşilırmak River-Durucasu water quality records. Journal of Applied Sciences 5 (1): 122-126.
Leib, K. J., M. A. Mast and W. G. Wright. 2003. Using Water-Quality Profiles to Characterize Seasonal Water Water-Quality and Loading in the Upper Animas River Basin, Southwestern Colorado. U.S. Geological Survey Water-Resources Investigations Report 02–4230, 46 p.
Whitfield, P. H. and M. J. R. Clark. 1992. Patterns in Water Quality in the Rocky Mountains of British Columbia. Ed. J.H.M. Willison, S. Bondrup-Neilsen, C. Drysdale, T.B. Herman, N. W. P. Munro and T. L. Pollock, Science and the Management of Protected Areas, p. 391-409. Elsevier, New York.
Whitfield, P. H. and W. G. Whitley. 1986. Water Quality-Discharge Relationships in the Yukon River Basin, Canada. Cold Regions Hydrology Symposium. American Water Resources Association 149-156.
Williams, G. P. 1989. Sediment concentration versus water discharge during single hydrologic events in rivers. Journal of Hydrology 111 (1): 89-106.
İletişim adresi: Ahmet KURUNÇ
Gaziosmanpaşa Üniversitesi Ziraat Fakültesi
Tarımsal Yapılar ve Sulama Bölümü 60250 Taşlıçiftlik-Tokat Tel: 0 356 252 14 79 (ext:2245)