TARIM BİLİMLERİ DERGİSİ 2005, 11 (1) 110-114
Chloride Estimation in Ground Water From Electrical Conductivity
Measurement
Hamid Zare ABYANEH1 A. H. NAZEMI2 M. R. NEYSHABORI2 K. MOHAMMADI3 G. H. MAJZOOBI1
Geliş Tarihi: 06.12.2004
Abstract:Salinity assessment of ground waters for the irrigation purpose often includes measurement of chloride ion, constitute that in large concentrations is toxic to plant. Since the measurement of electrical conductivity is much easier than determining chloride ion, the aim of this study was to develop an empirical relationship between chloride ion concentration and electrical conductivity of ground waters for western of Iran. Large numbers of water samples, 1063 laboratory and 2252 field data, were collected over about 66000 Km2 areas in west of Iran. Electrical conductivity (EC)
was measured with a conductivity cell and Cl- concentration by titration with AgNO
3 solution. The data were grouped
into various groups based on crop tolerance to salinity and consequently to EC. Linear, polynomial and power regression models were tested. Using data for all 3315 samples, all three models were highly significant and explained 99% of the variability in observed Cl- values. Other models for different groups of data also developed and it was
concluded that there is a good agreement and correlation between EC and Cl- concentration in water samples except
for EC<3 dSm-1.
Key Words:Chloride estimation, electrical conductivity, groundwater, linear, polynomial and power regression
Tuzlu Sularda Elektiriksel İletkenlik Ölçümünden Klor Tahmini
Öz: Sulamada yüksek konsantrasyonlarda bitki üzerinde toksik etki oluşturan tuzluluk değerlendirmesi, elektriksel
iletkenlik ve klor iyon ölçümlerini içermektedir. Elektriksel iletkenlik ölçümü klor belirlenmesinden daha kolay olduğu için bu çalışmanın amacı, İran’ın batısındaki yer altı sularında klor iyon konsantrasyonu ile elektriksel iletkenlik arasındaki deneysel ilişkiyi belirlemektir. Su örneklerinin büyük miktarı (1063 laboratuvar ve 2252 tarla örneği) İran’ın batısındaki 66000 km2’lik alandan toplanmıştır. Elektiriksel iletkenlik bir iletkenlik hücresiyle, Cl- iyonu konsantrasyonu da AgNO
3
çözeltisi ile titrimetrik olarak belirlenmiştir. Elde edilen veriler bitkinin tuza toleransına göre EC değerleri dikkate alınarak gruplandırılmıştır. Bunlara linear, polinominal ve power regresyon modelleri uygulanmıştır. Uygulamada 3315 örneğe ait değerlerin hepsi kullanılmıştır. Uygulanan her 3 regresyon modelinde EC değeri ile Cı- değerleri arasında oldukça
önemli düzeyde (%99) ilişki bulunmuştur. Aynı zamanda farklı grupların verileri için diğer modeller geliştirilmiştir. Sonuç olarak EC değeri 3 dsm-1 den küçük olanlar dışında EC ile su örneklerindeki Cl- konsantrasyonu arasında iyi bir
uyumluluk ve korelasyon olduğu kanısına varılmıştır.
Anahtar Kelimeler: Klor tahmini, elektriksel iletkenlik, yeraltı suyu, doğrusal, çok terimli ve güç regresyon modelleri
1 College of Agriculture, Bu-Ali Sina University, Hamadan-Iran 2 College of Agriculture, University of Tabriz Tabriz-Iran 3 College of Agriculture Tarbiat Modares University, Tehran-Iran
Introduction
In many countries, groundwater is one of the major water resources for domestic and agricultural uses. Aquifers and the contained ground water are inherently susceptible to salinization from irrigation and evaporation especially in arid and semi-arid regions. Desalinization is prohibitively costly and often impractical. In this context and in recognition of the need for effective and efficient methods for protecting ground water resources, it is necessary to have easy ways to monitor the quality of water.
Major source of groundwater pollutions are agricultural activities, seepage through landfills and waste deposits (Kinzelbach 1986). Electrical conductivity (EC) is usually a representation of salinity and it can be measured with a simple device. Chloride ion (Cl) is an important element among dissolved solids which can limit plant growth, decrease yields and reduce quality of drinking water. Chloride is highly soluble and remains in the soil solution, while other ions such as sulphate and bicarbonate combine with calcium and magnesium, where
present, to form calcium sulphate and calcium carbonate, which are sparingly soluble compounds.
Measurement of EC is fast and inexpensive. On the other hand, Cl- concentration typically is measured by titration of aqueous samples using standard AgNO3
solution. Chloride analysis thus is time consuming and expensive, compared to EC measurement (Hajrasuliha 1991). Since Cl- is a major constitute of saline waters and soils, and it directly affects EC, therefore, a close correlation between EC and Cl is expected.
Based on the study of large numbers of solute solutions, irrigation waters, and soil extracts, a linear relationship between the logarithm of the equivalent concentration and the logarithm of specific conductance has been reported by Marion and Babcock (1977). Maas (1986) suggested that if Cl- were the predominant anion in a soil solution, the Cl- concentration in molm-3 would be approximately equal to 10 times the ECe measured in
Observations of Cl- concentration and EC for many
saline waters throughout central part of Iran reported by Hajrasuliha, (1991) suggested the possibility of a generalized empirical relationship between these two factors. Therefore, it is conceivable that the Cl
-concentration can simply be estimated from EC measurement. The reliable predictions of the solute transport within flow systems have largely based on the Cl measurements (Ursino et al. 2001, Volker et al. 2002). A relatively accurate relationship between EC and Cl would be helpful in estimating the temporal and spatial solute distribution in groundwater which is quite valuable in water pollution management.
The objective of this paper is to analyze and develop a relationship between chloride concentration and EC, as a prediction tool, for ground waters in a cold semi-arid region located in western Iran.
Materials and Methods
Two data set consisting of the simultaneous measurement of Cl- and EC were used for this research.
The first set containing 1212 and 1040 water samples have been taken from 120 and 100 tube wells during 1996-2003, at Hamadan and East Azarbaijan provinces, respectively (Anonymous 2003a, b). Hamadan Province has 19000 km2 area, average elevation of 1850 m above sea level and 350 mm of annual precipitation and those are 47000 km2, 2450 m and 230 mm for East Azarbaijan Province, respectively. Both areas are classified as cold semi-arid climate. EC values of the water samples ranged from 0.15 to 28 dSm-1 depending on the location of wells and time of sampling.
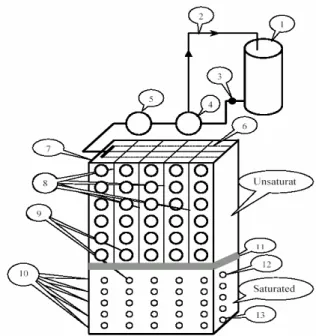
The second data set was sampled during laboratory experiment. Figure 1 depicts the physical model used in this study. Two experiments were carried out with two different soils. Table 1 shows the physical properties of the soils and Figure 2 is the particle size distribution curves. Soil No. 1 had a fine sandy texture with a uniformity coefficient of 1.67, while soil No. 2 was a coarse sand with uniformity coefficient of 3.97, implying that soil No. 1 is more uniform than soil No. 2. The size distribution effect is well reflected in saturated hydraulic conductivity (Ks) and
saturation percentage (SP). Soil 1 has lower Ks and higher
SP as compared to soil 2. (Table1).
Sodium chloride solutions 35 dSm-1 was evenly introduced to the soil surface through porous tubes, and then soil solution samples were taken at specified time intervals from saturated and unsaturated zones. 1063 samples with wide range of EC and chloride concentration were taken. Chloride content was measured by titration with AgNO3 solution and all EC values automatically were
adjusted to 25oC.
Three different models, linear, polynomial and power regression, were used to describe Cl concentration as a
b
ax
y
=
+
(1)c
...
bx
ax
y
=
n+
n−1+
+
(2) bax
y
=
(3)The analyses were carried out separately for two following cases: 1) all 3315 data set obtained from field and laboratory, 2) data grouped into two parts with EC≤3 and EC>3 dSm-1 which below 3 dSm-1, salinity has no
effect on crop growth (Johnson et al., 1957), and 3) data for EC<18.7 and EC<21 were used. These thresholds are the crop tolerance to salinity for wheat and barley which can grow and yield satisfactory (Ayers and Westcot 1985). Above these thresholds, there won't be any economical yield. These two crops are the major cultivations in two studied provinces.
Results and Discussion
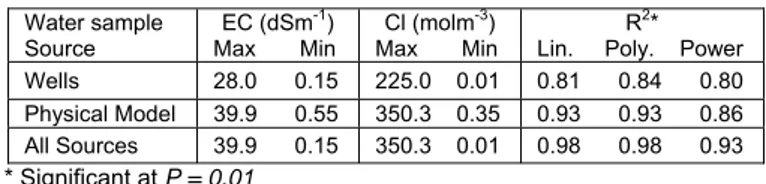
Three models, linear, polynomial, and power function, were fitted on all three data categories. Models coefficients and regression coefficients (R2) between EC and Cl are presented in Table 2. Figure 3 showes the developed models using all data between 0.15 to 39.9 dSm-1. The polynomial equation could better predict the Cl
from measured EC but all models were within 1% significance. Figure 3 also shows the fitted models using data collected from field and laboratory experiment, separately. Again, polynomial model had better results for both cases.
Figure 1. Sketch of the flow container for studying chloride movement. In this figure: 1) Flow tank 2) By pass 3) Foot valve 4) pump 5) Volume control 6) Porous tubes 7) Box 8) Dividing plates 9) Soil sampling port and water outlet
112 TARIM BİLİMLERİ DERGİSİ 2005, Cilt 11, Sayı 1
Table 1. Physical characteristics of soils used in experiment Soil No. Soil Texture D10 mm D30 mm D60 Mm Ks mday-1 ECdSme -1 EC dSm-1
ρ
b Mgm-3 SP % 1 2 Sand Sand 0.14 0.12 0.18 0.185 0.185 0.21 7.402 15.163 0.226 0.107 0.59 1.39 1.568 1.696 43.62 37.59 Dz = The particle diameter which z percent of the particles have diameters lower than thatKs = Saturated hydraulic conductivity
ρ
b= Dry Bulk density SP = Saturation PercentageECe = Electrical conductivity of the soil saturation extract, from extract 1:10 (Soil: Water)
EC = Electrical conductivity of saturated zone of the model
Figure 2. Particle size distribution curves for two sandy soils
In second attempt of finding the relationship between EC and Cl, data were grouped into EC≤3 andEC>3 dSm-1. When data obtained from laboratory experiment were
results. Maximum R
used, for EC≤3 all three models failed to show a good
or third case, data with EC>18.7 wereremoved and three
able 2. Maximum and minimum EC and Cl- concentration and
R2*
Lin. P Power
2 in this case was 0.25. But when all
data were used, the R2 for polynomial model reached 0.87. For data with EC above 3 dSm-1, in all cases
models could produce relatively good relationships (Table 3).
F
models were fitted on remaining data. Then, based on barley tolerance to salinity, data with EC<21 were considered for new model fitting. In these case, all three models had about the same r-value, irrespective of the data source but power function had the highest value of R2 (Figure 4 and Table 3).
T
regression coefficients in different cases. Water sample EC (dSm
Source
-1) Cl (molm
Max Min
-3)
Max Min oly. Wells 28.0 0.15 225.0 0.01 0.81 0.84 0.80 Physical Model 39.9 0.55 350.3 0.35 0.93 0.93 0.86 All Sources 39.9 0.15 350.3 0.01 0.98 0.98 0.93 * Significant at P = 0.01
-Figure 4. Chloride concentration versus EC for EC<21(wheat) and EC<18.7 (barley)
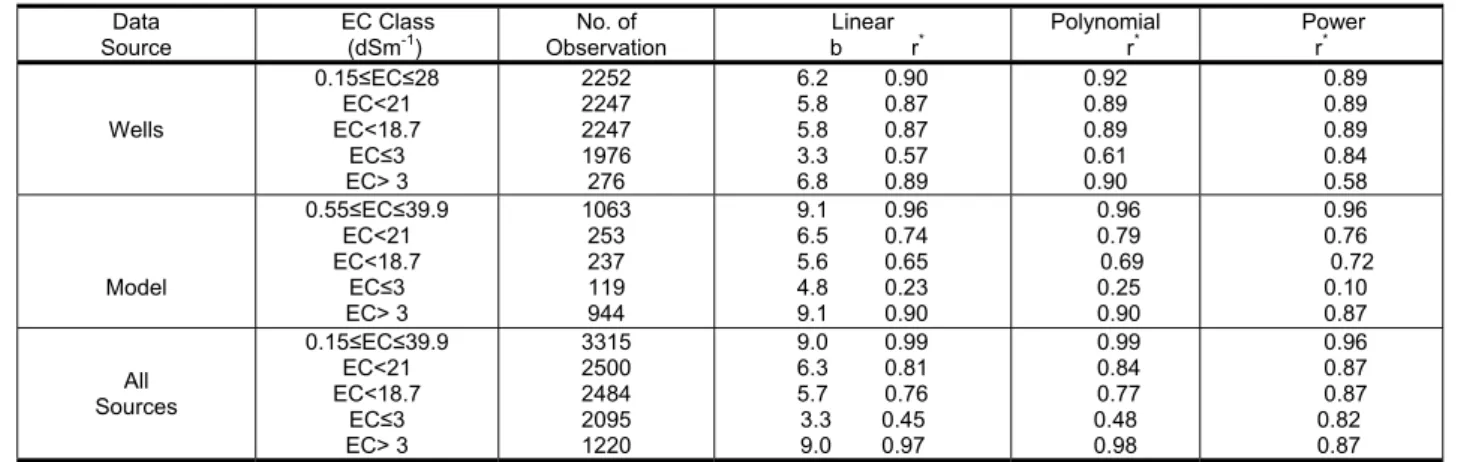
rrelation coefficient (r) of linear, polynomial and power regressions for various groups of water samples
Source Ob on Polynomial P er
Table 3. Co
Data EC Class
(dSm-1) servatiNo. of b rLinear * r* row*
W 0.1 E 0 ells 5≤EC≤28 EC<21 C<18.7 EC≤3 EC> 3 2252 2247 2247 1976 276 6.2 0.90 5.8 0.87 5.8 0.87 3.3 0.57 6.8 0.89 0.92 0.89 0.89 0.61 .90 0.89 0.89 0.89 0.84 0.58 Model 0.5 .9 E 5≤EC≤39 EC<21 C<18.7 EC≤3 EC> 3 1063 253 237 119 944 9.1 0.96 6.5 0.74 5.6 0.65 4.8 0.23 9.1 0.90 0.96 0.79 0.69 0.25 0.90 0.96 0.76 0.72 0.10 0.87 All Sources 0.1 .9 E EC> 3 1220 9.0 0.97 0.98 0.87 5≤EC≤39 EC<21 C<18.7 EC≤3 3315 2500 2484 2095 9.0 0.99 6.3 0.81 5.7 0.76 3.3 0.45 0.99 0.84 0.77 0.48 0.96 0.87 0.87 0.82 * Significant at P = 0.01 onclusion
te the chloride ion in ground waters in western Iran.
Anon Bulletin, East
Anon s
Ayers
nd Drainage Paper, No. 29. Rev. 1, FAO, Hajra
ctivity of saturated soil John
ments of different plant species. Plant Soil, 8: 337-353.
C
Variety of models and data were used to develop a reliable relationship between EC and Chloride. Referring to table 3 and Fig.4, it is evident that at high ranges of salinity (EC>3 dSm-1), the most accurate estimate of Cl- from the EC can be made by either
using a linear or polynomial model with r value of 0.99. At EC≤3 dSm-1 particularly from the irrigation water
quality aspect, only power regression model would led to a confident estimate of Cl-. Overall, for a wide range
of EC (0.15 to 40 dSm-1) encountered in this study with 3315 pair wise of EC and Cl- data, the power function
may be recommended. Therefore, with a relatively accurate
and inexpensive way, it is possible to estima
References
umous. 2003a. Groundwater Quality Analyses Azarbaijan Regional Water Authority, Tabriz.
ymous. 2003b. Hamadan Groundwater Quality Analyse Bulletin, Hamadan Provincial Water Authority, Hamadan. , R. S., D. W. Westcot, 1985. Water quality for agriculture, FAO Irrigation a
Rome, 174 pp.
suliha, S., D. K. Cassel and Y. Rezainejad, 1991. Estimation of chloride ion concentration in saline soils from measurement of electrical condu
extracts. Geoderma, 49: 117-127.
son, C. M., P. R. Stout, T. C. Broyer and A. B. Carlton, 1957. Comparative chloride require
114 TARIM BİLİMLERİ DERGİSİ 2005, Cilt 11, Sayı 1
inzelbach, W. 1986. Groundwater Modeling. Elsevier Publishers. Maas
on). Potash and Phosphate Institute. Atlanta, GA, pp.4-20.
Mario
eous soil suspensions. Soil Sci. Soc. Am. J., 41: 724-728.
Ursin
tank experiment. J. Water Resour. Res., 37 (2): 201-208.
Volke
rs. J. Mathematics and Computers in Simulating 59: 35-44.
ss:
ege of Agriculture ence
amadan 65174-Iran K
, E. V. 1986. Physiological response of plants to chloride. In: Chloride and cropproduction. (Eds.: T.L. Jacks
n, G. M., K. L. Babcock, 1977. The solubilities of carbonates and phosphates in calcar
a, N., T. Gimmi and H. Fluhler, 2001. Combined effects of heterogeneity, anisotropy, and saturation on steady state flow and transport: A laboratory sand
r, R. E., Q. Zhang and D. A. Lockington, 2002. Numerical modeling of contaminant transport in coastal aquife
Correspendence addre
Hamid Zare ABYANEH University of Bu-Ali Sina Coll Department of Soil Sci H