.. ,-" .~
-".- ~'':.-
.. ~""
.,
~ ,', i,
:.:....-" '...
D
D
-.:;:' ,.,.. .r
L
i\;
i
Ji.
i
,~
i
-1
d
"-
--.J
,
\
> - - ",
--
• > " -< , . "CLUSTERING EFFECT ON COMPETETlVE
ADV ANT AGE in SMEs: DOES IT REALL Y GIVE AN
ADVANTAGE?
Yıldız
Y. GUZEY
International Trade and Finance Department, ızmir University, Turkey [email protected]
Ozlem TASSEVEN
Department of Economics and Finance. Dogus University, Turkey [email protected]
Hilmi ELIFOGLU
Department of Accounting & Taxation, St. Johns University, USA [email protected]
Ahu GUZEL
Business Department. ıZmir University. Turkey ahu.guze/@izmir.edu.tr
N. Can OKAY
University of Portsmouth, UK
nejaı[email protected]
ABSTRACT
According to Michael Porıer's Diamond Model. a business cluster is defined as
geographic coocentratian of inter ~connected companies and institutions working in a
comman induslIy. In addition. clusters encompass an arıay of coUaborating and
compctiog services and providers that creale a specialized infrastructure. which supports
the cluster's indusıry.
The economic cluster model. represenlS a synergy. a dynamic relationship and a
network betwecn not only the companies that comprise a cluster but also the successful partnering of the stakeholders. Today in all over the World. successful clusters have
established a greater competitive advanıage and wealth creation for their regions when
regions are considering fostering clusıer developmenı as building blocks of regional
economjes.
Researcb is planned and performed for undersıanrnng ı1ıe clustering in SMEs Induslrial Esıate in Istanbul if iı gives a competilive advanıage lo ı1ıe Clusıer members or not. lt is performed ıo deıermine and saıisfy ı1ıe lack of knowledge abouı ı1ıe smail
and memum enıerprises' issues, technologic sysıems. production quality standards.
capacily usage ratios, inıeractions with other firms, habits of following the technologic improvements and clusıering effeers on the members.
Key Words: Clusıers, SMEs. Cluslering
JEL
Classilidation: MI9ı.
INTRODUCTION
Clusıers are geographic concenıraıions of interconneeted companies and institutions in a particular field. They exlend downsıream lo channels and cuslomers and laterally no
manufacıures of complemenıary products and lo companies in indusıries related by
skills. technologies. or common inputs (Rosenteld, 1991). Percepting clusıer as a term
significanıly increased by Michael Porter's sturnes .
. Rosenfeld (1995) and Audretsch (1998) mention thaı Poner's clusıers determine the
foUowing;
i. Relaıed firms with each other; for exaınple SMEs ai Egyplian Bazaar. Theyare selling familiar producrs (iewerly. spice and giftware.eıc.)
2. Dislribution channels, cusıomers, suppliers and the firms which are expecting benefiıs from same seclors ~uch as technology producers.
3. Relaled instiıutions abouı a seclor. For exaraple: colleges, organizations,
educalion and standarized firms.
Clusıers are the key organizaıional unil for understanding and improving the
performance of regional coUeclion of unrelaıed firms (Tracy & Clark, 2(03). Firms clusıer ıogether within a region because each firm benefits from being located near other
similar or relaled firms. The fırms in a cluster have common competitive sırengths and needs. Given the POpularily of the clusıer approach, iı is valuable ıo undersıand wbaı
clusıers are. why they exisı. how lO idenlify them, how they malter for regional
economic developmenı. and how to use cluster analysis in policyand praclice. Clusters
represenı a fundamenta! organizing frarnework for undersıanding regional econcmies
and for developing eeonomic sıraıegies (Hirst&Thompson. 1996).
Clusıers occur in many Iypes of induslries. in both larger and smailer fields, and
even in some local businesses, such as restaurants, car dealers, and antique shops. They are presenı in large and smail economies, in rural and urban areas, and ai several geographic levels. Clusıers vary in size, breadth, and sıate of development. Crag (2002)
and Poner (1998) argue thaı some clusıers 'consisı primari1y of small- and mernum-sized firms.
2. CLUSTER THEORY
According to Newland "The theoretical appraachs about Business Clusters are striking in their variety" (Newland. 2(03). A wide set of argumenlS drawn up"n to
esıablish what advanıages rely on spatial concentration and to determine the balance
between compelition and cooperalion that generates the advanıages (perry, 2(05).
There are five main approaches about clustering;
• Agglomeralion Theory: (Marshall; 1890-1927): Agglomeration Theory explains
that fums cluster to sbare a "commons"of business services, labour pool and to enable indivjdual specialization. Theory vjewed Business Clusters as coUectjons of atomistic businesses, connected through market relations rather than deljberate collaboration (perry, 2(05). The sources of agglomeratjon economy allow finns wjthin the same industry to gain from their mutual presence close to each other. Cluster membershjp benefjlS helped smail firms located in clusters substitude for the jnternal scale advanıages obtained by large finns. Reduced jnformation costs are the key feature of Marshall's economjes (MeCann, 2(01). When finns are
locaıed together, it suggests that there is relatively easy access to represenıatives
of other finns of interests '(Perry, 2(05).
• Transacıjan Coasts and Ihe "Californian School": According to Transactian
Coasts and the Califamian school, business cluster formation js rela!ed wjth
market conditions that increase the uncertarıity faced by indivjdua! businesses and risk. In response for market candilion, praduclion chains have ıended to .. disjntegrate" among jndepended businesses connected through transactions.
• Flexible Specializalion: This theory assumes, cluster members gain from the transfer of indusıry intelligence outside formal transaction. Firms in a cluster are
expected to become interdependent through the tlexibility of indivudual fımıs boundaries.
• Innovative milieux and the GREMI research group: lnnovative miljeux and
the GREMI research group argues that clustering suppons a collective leaming process operating through slcilled labour mobilily, customer-supplier interactjon and jııformal "cafeteria effeclS".
• Instiluljonal and evolutionary economics: Theory asssumes that the wjsdom of
clustering comes from where busjness and intitutional dependencjes lock a
particular business community into a common response.
From the other approaches, there are three underıying processes are identified and
presenı: trust. localized learnjng and externalization.
2.ı. Dinıensions of Clustering
Ooe key to undersıandiog clusters js to recognjze that there are multiple dimensjoos to cluster relationshjps, including geography, socjal disıance, technology, and
production tlows. Not
au
clusters operate in all dimensions. Clustering is about proxjmjty; the underlying ratianale is that businesses that are closer to one anather haveadvantages that are unavailable to businesses that are farıher away. Some fırms that are close to one another perfonn differently from otherwise similar peers located elsewhere (Crang&Martin. i 99 i; Benner 2(02) ..
There are three dimensions of clusters:
• Life cycle (existing, enıerging, and potenti.l): There is general agreemenı that
clusıers exhibit a life cycle. wbich draws from "product lifecycle" and "industry life cycle" theories. The cluster tife cycle also includes the possibility thaı clusıers
may reinvent or redefine themselves as markets and technology change (Sadowski, B.M .. Maitland, C. & van Dongen, 2(02).
• Linkages (buyer-supplier or labour pool): Most fırms buy inputs (raw maıerials. services, components) from other firıns.
• Geography (regional Or statewide): Characterizing the dimensions of clustering.
as with defining clusıers in the fırst place, is not an exact science (Sanıarelü, E. & D'Altri,2(03).
2,2, Clusters and COOlpctitive Ady.otage Reı.tions
In order to continue. their existence enterprises must have c'ompetitive advantage
ag.inst their competitors, A1though • number of states and regions are using the cluster model to analyze their economies and organize key industries. only a few begin to show fundamental changes in the provision of economic services based on clusters (Rosenfeld 2(03). There are three advanıages that can be used in clustering strategies (Sternberg, 1991 Stoneman, & Toivanen, 1997 and Rosenfeld 1995).
• Cost Adyantage: In ciustering structures, its easier to get customers. lts more effective and cheaper to use 'common utitities such as (transportation,
communication, energy, cleaning, security etc)
• Variety Advantage: ReJationships and caITelalive competılıon pressure tum
enterprises to find new products and services in order to strengthen their abilitics. • Resouree Ady.ntage: Easier labour foree, easier financing, easier goods and
services, easier capital and finally easicr information and technology, Porter (1998) state that f.ctors attrdcting clusters are;
• Labour PooI: One of the reasons for SMEs to make ciustering structure is to at!ain labour pool easily.
• Supplier Speci.lization: if SMEs find any poıential customers about a specific subject, they can spend their money develop specialization.
• Information Knowledge: Labour forces that are focusing on same economical
intenıions and problems, provide shared information knowledge.
• Entrepreneurship: Entrepreneurship is the key element of economical
improvement.
• Path Dependency: Economical opporıunities appear on a specific region, are the
• Culture: When we analyıe c1uster fırms, the most important componem is social
intercourse between SMEs. it is not only about relationship between employee and employers. it is also related with customers.
• LocaJ Demand: Consumers demand LS also effeclive for clusters.
Clusters can make compeblive advantages by combining those factors together.
Competitive .dvantage grows out of the value a firm is able to create for its buyer and
this can be diagnosed through the value chain. Sternberg, (1991) Roseofeld, (1991.
1995) .tate that innovation is seen to be central in creating a competitive advantage by perceiving or discovering new and better ways to compete in an industry and bringing them to market.
2.3. Types of business c1usters generally based on different kinds of knowledge
• Techno c1usters - These types of c1usters are generally new tecbnology-oriented,
well adapted to the knowledge-based economy, and generally have coUaboralive networks with University or research centers elC.
• Historic knowhow-based c1usters - Historic knowhow-based c1usters are based
on more tradilional activities than other types of c1usters that maintain their
advantage in know-how as an core competeney over the years or over the cemuries (for example; Granbazaar).
• Factor Endowrnent c1usters are based on comparative advantage and have
geographical position. Their comparalive advantage generally related with their
location. For example: Some Fish companies located near the seaside or wine
production c1usters located same sunny region. Like Italy, Sicilya, France and San Francisco Napa Valiey.
3. LIGHTING SECTOR
3.1. Definition and Content of the Lighting
Lighling is an element that steps forward with it's both decorative and functional fcature. Light was used in street lamps in 18. Century then it staned to be used in spaces. With the fast development of the technologyand crealivities of designers made Iighting an important decoration element, beyand the lighting need. The aim of lighting; is not obtaining a certain Iighting leve!. it became providing the ideal and correct visual
condilions. Today, Iighting firms, with the develaping designs are not only producing
and selling lamps or ampoules but a1so they are creating decorative solutions by
designing projects that are suitable for every space. 3.2. Lighting Sector in Turkey
In 1990 Turkey's expon was 13.8 millian dollars. import 12.52 million dollars and foreign trade volume was at 26.3 million dollars leve!. With the crisis of 1994 import reduced to i 1.6 million dollars leve!. export rised to 20.9 million dollars leve!. However. between the years of 1996-2000 import was one step forward than export. Af ter the
came into prominence with it's exporter identity, In 2002 and 2003 the increase trend in
export went on, Turkish Iigting sector which is developed in recent years. multipled the
lighting a1ternatives of the architects projecıs in international market and on the other
hand, it staıted to export it' s producıs to foreign marl<ets, The number of fums.
manufacturing in accordance with the international quality standards is rising every day in Turkey,
Table 1. Production Va1ues According to Year Years Production Values (TL)
2000 4.%9,199
2001 6,552.975
2002 12,918,373
2003 19.035,189
2004 18,939.798
In 2000, our yearıy manufacturing arnount of 4,9 millian TL showed four times
increase in a short period of 4 years, This sector became ready to be a very impoıtant and fast developing sector with high income and added value,
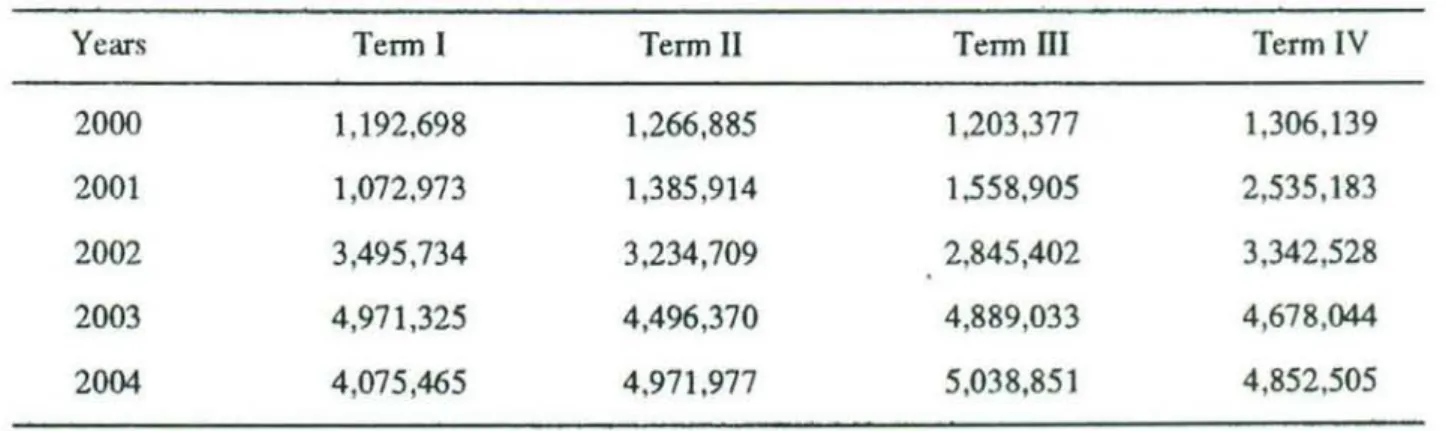
Tablc 2. Production ofLighting Equipment'i Accorcting to Tenns (TL)
Years Tenn i Term LI Term HI Term LV
2000 1,192,698 1.266.885 1,203,377 1.306, \39
2001 1,072,973 1,385,914 1,558,905 2,535.183
2002 3,495,734 3.234,709 2,845.402 3,342,528
2003 4.971,325 4,4%.370 4,889,033 4,678.044
2004 4,075,465 4,971.977 5.038,851 4,852.505
3,3, Seclor and Employmenl
The number of the people that Iighting equipmenıs sector emplay in our country is
nearly 10,000, Considering that actual manufacturing fınns start production in full
capacity, it is expected that they will emplay nearly 20,000 people,
4.RESEARCH
This research is planned and performed to investigate whether the clusıering in Şişhane & Küçükköy Lighting Industrial Estate gives a competitive advantage to the
enterprises in Şişhane and Küçükköy or not. Scope of research is plaııned as the smail
Table 3. Researeh Hypothesİ.'i
Procuremenı method of ıhe eompanies of their raw materials - input & benefiting from clusler
members.
Procurement method of the companies of their raw materials - input & having advanıage of proeuring
raw materials - input of the cluster.
Sales method of the produets & input & having advantage of procuring raw materials - inpuı of the
cluster.
Saks method of the produets & insufficieney of warehousing areas.
Company strattgics & rdationship among dusler membas.
Cooperation opportunities wilh other companies and partnership with eluster memben.
Cooperalion opportunities with other companies and opportunities of duster members to have
eooperation and advantage.
Having advantage in proeuremenı of the goods-raw materia! & sufficieney of carriage/transport/
infraslruclure.
To Feel Lueky because of location & opportunities of duster members lo have eooperation and advantage.
99 Smail and medium enterprises that are in Şişhane & Küçükköy Ligbting Industrial Estate are sampled. The samples are chosen randomly from all sectors. Basic
ıenns used in the analysis are as follows:
Enterprises that employed (I -20) people are; SMALL
Enterprises that employed (21-101) people are: MEDIUM Enterprises that employed (lOI-more) people are; LARGE.
Face to face interview method is used in the analyses. In research. there are 47
questions that are open-ended and multiple-choices. We have made faee to face
interview for the application of questionnaires with 99 fmns and have evaluaıed the
results using SPSS Program. Research is perfonned
io
deıennine and satisfy the lack ofknowledge about the small and medium enterprises in dusıer, dustering, cost
advanıages, interactions with other finns and dustering effects on business functions.
4.1.
Data
AnalysisSurvey sheets were coded and numbered, filed and ıagged with the finns' deıails. All
quesıionnaires have been evaluaıed. For ıesting research hypothesis given in Table 3,
ebi Square -Fisher & Yates- techniques are used.
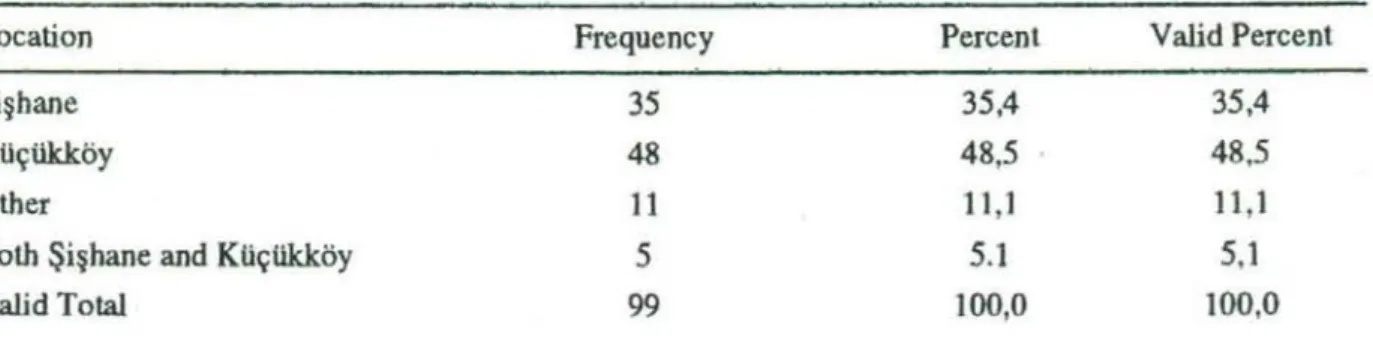
Table 4. Researeh Sile Deseription
Location Frequency Pereent Valid Percent
Şişhane 35 35,4 35,4
KUçtlkköy 48 48,5 48.5
Other 11 i I, i II. i
BoUı Şişhane and KUçtlkköy 5 S.I 5.1
Age of Owner Frequency Percent Valid Percent Cumulative Pertenı, <1961 32 32.3 32,7 32.7 1961-1970 47 47.5 48.0 80.6 1971-1980 17 17.2 17.3 98.0 >1980 2 2.0 2.0 100.0 Missing Sysıem i 1,0 100.0 Toıal 99 100.0
Frequency Percenı Valid Pereenı
Lamp shade manufacıurers 2 2.0 2.0
üghting -Lighting ıools manufaclurcrs 2 2.0 2.0
üghting - Painting indusıry 2 2.0 2.0
Lighting - Lighting gJa~:c; 3 3.0 3.0
Lighing - Decoralion 2 2,0 2,0
üghting - Electriciıy industry 4 4.0 4,0
Lighling - SIı:c! indusrty 6 6, i 6.1
Lighting - Fumiture 1.0 1,0
Lighting - Advertisi.ng industry i 1.0 1.0
Ughting. Chande1i,ers Crystaı parıs manufacturers 2 2,0 2.0
Lighı.ing 63 63.6 63,6
Lighting glass manufacturing 1.0 1.0
Dc.coraıion 1.0 1.0
Ekctiricily industry 1,0 1.0
Sandblasting 1.0 1.0
Steel industry 3 3.0 3.0
Chandelic:rs Cry5tal parts manufacturers 4 4.0 4.0
Valid Total 99 100 100
Enıerprises' Time oflncorporation Frequency Pereeni Valid P!!reenl Cumulative
Distribution Percenı
1961-199 16 16.2 16.2 16,2
1991-2000 44 44.4 44.4 44.4
2001-2009 39 39.4 39.4 100.0
Valid Total 99 100.0 100,0
Enıerprises' Incorporatars Frequency Pereenı VaHd Pereeni Cumulative
P!!rcenl By me 50 50.5 50.5 50.5 With my partner.; 30 30.3 30.3 80.8 By my fath!!r 15 15.2 15.2 96,0 Took over 4 4.0 4.0 100.0 Valid Total 99 100.0 100.0
The Busin!!ss Main Activily Frequency PeTC!!nl Valid Pereeni Cumulative
Subject When it Wa~ rml Percenl
E.~tablished
Same 78 78.8 78.8 78.8
Other 21 21,2 21.2 100.0
Legal Stnıctu.res Frequency Percent Valid Percc;:nl Cumwative Pereeni
Joint lilock company 2 2,0 2,0 2,0
Limiıed partnc;:rship 61 61,6 61,6 63,6
PersonaJ Property 36 36,4 36.4 100,0
Valid Total 99 100,0 100,0
Cıased Areas(Ml) Frequency Percent Valid Percent Cumu1ativle
Plercenl <100 mL 6 6,1 6,1 6,1 lOO-199m' 32 32,3 32,3 38.4 200-299m' 20 20,2 20,2 58,6 300-399m' 18 18,2 18.2 76,8 >399m2 23 23.2 23.2 100.0 Valid Total 99 100.0 100.0
Closed An~a'l' Suffıciency(M2) Frequency Pereent Valid Percent Cumu1ative
Pereenı y" 70 70,7 71,4 71.4 No 28 28,3 28,6 100.0 Total 98 99,0 100,0 Missing System i 1.0 V<tlid Total 99 100,0
Business Eitpansion Frequency Percent Valid Percent Cumwative
PereenI
No 71 71.7 72.4 72.4
At the same place i i ii, i 11.2 83,7
At differenl plaee 16 16.2 16,3 100,0
Total 98 99.0 100,0
Missing System i 1.0
VaHd Total 99 ıoo,o
Employees' Numbe~ Working Frequency Perelent Valid Percent Cumulative
In Produetion Percent No workers 12 12,1 12, i 12, i 1-9 perlion(li) 32 32.3 32.3 44.4 10- 19 42 42,4 42.4 86,9 20-29 i i 11.1 i i , i 98.0 >29 2 2.0 2,0 100,0 Valid Total 99 100.0 100.0
Employeeli' Numbers Working Frequency Percent Valid Percent Cumulative
In Other Dc;:parbnenı'i Percent
No workc;:rs 5 5, i 5, i 5.1
1-3 person(s) 48 48,5 48,5 53,5
4-6 36 36.4 36.4 89,9
>6 10 ıo,1 10. i 100,0
Enteıprise.~' Average Capacitics Frequency Percent Valid Pereeni Cumulative
In La.~ı Three Months Percent
<:40% 4 4,0 4,0 4,0
40%-59% 39 39.4 39.4 43,4
60%-79% 50 50,5 50,5 93.9
>79% 6 6,1 6,1 100,0
Valid Toı.ı 99 100,0 100,0
Enterprises' Suppliers Frequency Percenl Valid Percenl Cumwative
Percenl
From Wholı!;saJer 16 16,2 16,2 16,2
From producer 73 73,7 73,7 89,9
DireetJy import LO LO, i 10,1 100,0
Valid Toı.ı 99 100,0 100,0
[)eseriptian of ProdUC15 Frequency Percenl Valid Percenl Cumulative
PereenI
Semi·finished producl 18 18,2 18,2 18,2
Finished producı 81 81,8 81,8 100,0
Valid Toı.ı 99 100,0 100,0
Cuslomer Frequency Percenl Valid Cumulative
Percen! Percenl
To Retailers 1,0 1,0 1,0
Wholesaler.; ID 10,1 i O, i 11, i
Factories i 1,0 1,0 12, i
Retailers i Wholesalers 51 51,5 51,5 63,6
Wholesalers i Dealcr 2 2.0 2,0 65,7
Retailers i W.saler.; i Dea1ers 5 5,1 5, i 70,7
Rctailers i W.saJers i Factories 3 3,0 3,0 73,7
Rctailcrs i W.saJers i Export comp. 6 6,1 6,1 79,8
Retailers i W.salers i Directly Export LO 10.1 LO, i 89,9
W,sa1crs i Exp. Comp./ Directly Ex. 1,0 i ,O 90,9
Ret.ailers i W.salers i Dea1ers i D. Rx. 3 3,0 3,0 93,9
Retailers /W.salers i Exp. com, i D. Exp. 5 5,1 5,1 99,0
Retailers /w .salersIDealers /Exp.comp /D.Exp. i 1,0 1,0 100,0
Toı.ı 99 100,0 100,0
Technology Usage Frequency Percenl Valid Percent Cumwative
Percent
Modem 45 45.5 45,5 45.5
Traditional 54 54,5 54,5 100,0
Valid Toı.ı 99 100,0 100,0
Technology Renovations of Frequency Pertent Valid Pereeni eumulative
Enterprises Percent Ye, 32 32,3 32,7 32,7 PartiaUy 47 47,5 48,0 80,6 No 19 19.2 19.4 100,0 Toı.ı 98 99,0 100,0 Missing System i 1.0 Valid Total 99 100,0
When the smail and medium enterprises in Şişhane & Küçükköy Lighting lndustrial
Estate are c1assifıed;
As can be seen in Table 4 from 99 respondem SMEs, it is found that;
• 63,6% of the enterprises are operating in lighting business.
• 6.1 % of the enterprises are operating in both üghting business and steel indusıry
(supply indusıry of Iighting equipments),
• 4% of the enterprises are operating in "Chandcliers Crystal parts manufacturing"
business,
• 4% of the enterprises are operating in both Iighting and electricity indusıry
(bulb-cable ete.).
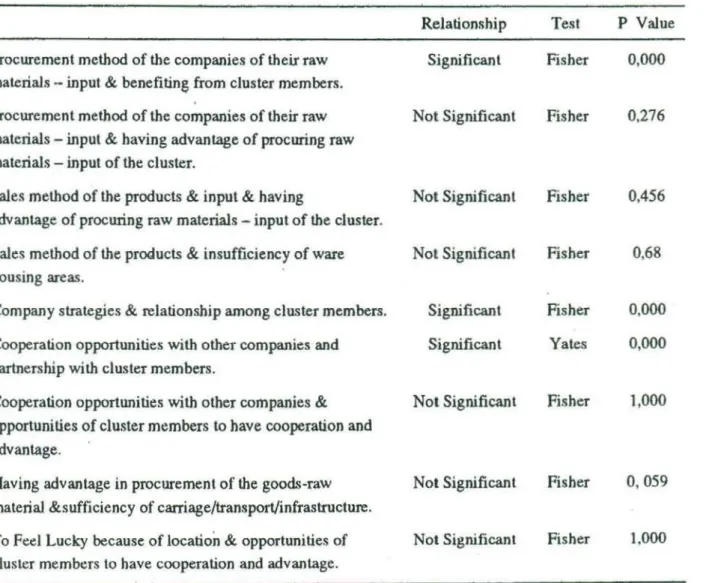
Table S. The Results of Hypolhesis Tesls
Relationship Tes. P Value
ProcuremenI method of the companİes of theit raw Significant Fisher 0.000
material., - input & benefiting from clusler members.
Procurement method of the companies of theİr raw Not Significant Fistıer 0.276
materiaJs - input & having advantage of procuring raw
materiaıs - input of the cluııler.
Sales method of the producls & input & having Not Significanl fisher 0.456
advantage of procuring raw materials - input of the cluııler.
Sa1es method of the products & insufficiency of ware Not Significant Fisher 0,68
housing areas.
Company strategies & relationship among clusler members. Significant Fistıer 0.000
Cooperation opportunities wilh other companies and Signiticant Yates 0,000
partnersrup with cluster members.
Cooperalion opportunilies with other companies & Not Significant Fisher 1,000
opportunities of cluster members to have cooperation and advantage.
Having advantage in procurement of Uıe goods-raw Noı Significant Fisher 0.059
material &sufficiency of carriage/transportjinfrastructure.
To F~el Lucky because of location & opporlunities of Not Significant Fisher 1.000
clusl~r memlx.:rs lo have cooperation and advantage.
According to Chi-square test results as giveo in Table 5. we fınd out tlıat there is a
statistically significant relationship between technique of production. raw materials and
inputs & benefıting from c1uster members. We obtained that there is a statistically
significant relationship between cooperation opporıunities witlı other companies &
partnership with c1uster members. Also. it is found that there is a relationship between
5. CONCLUSION
In summary, survey targets the clusturing, structural characteristics and what kind of
competitive advantages Iighting firms are getting from Şişhane & Küçükköy Lighting
IndustriaJ Estate.
The results showes that the enterprises are mostly located in Küçükköy (48.5%).
most of the owners were bom between the years 1961-1970 (47.5%). the enterprises are
mostly operating in only lighting sector (63,6%), the firms generaJ1y opened between
1991-2000 (44,4%), mostly have established own business (50,5%), legaJ structure of
firm is limited partnership with 61,6%, And business activity area is mostly between
100-199 m2 (32,3%), mostly do not think expanding their business (71,7%), most firms
have 10-19 employers in production with 42.4% and 1-3 employers in other
departments with 48,5%, the average capacity of enterprises in last 3 months is between
60%-79% (50,5%), most of enterprises are supplying from producers (73,7%). most of
enterprises seli their products to "Retailers / WholesaJers" (51.5%), most of enterprises
believe that being together with another Iighting enterprises is an advantage (97%), all
of the enterprises rçach their target customer easily.
By this research we aimed to find a relationship between competitive advantage and
cluster membership. As a results of the hypothesis tested; it is found, that there is a
relationship between technique of production, raw materials and inputs& benefiting
from cluster members, Cooperation opportunities with other companies & partnership
with cluster members, company strategies &relationship among cluster members.
Existence of raw materiaJ suppliers at Şişhane and Küçükköy and being closer of these
supp1iers to the enterprises give advantage to them in tenns of saving time and money.
(Transportation and Stock cost can be minimized so profıtability can be maximized).
Enterprises follow st yle and trend innovations from each other and they determine their
manufacturing new product and growing decisions according to the leaders of the
sector. The firms making use of other firms around their company by not only raw
material and product technuque but also directing their customers to the other firms
around.
As Porter (1998) stated, cluster is a system of interconnected firms whose vaJue as a
whole is greater than the sum of its parts. Smail and medium enterprises in Şişhane &
Küçükköy Lighting lndustrial Estate are also working together as one company for
developing and helping each others.
REFERENCES
Audretsch. D.B. (1998). "Agglomeration and the Location of Innovative Activity". Oxford Review of
Economic Policy. 14(2): 18-29.
Cragg, P.B. (2002). "Benchmarking Information Technology Practices in Smail Firms". European
Journal of Information System s, 11:267-282, Development Quarterly 5. November, 242 356. Crang. P. and Martin. R. (1991) "Mrs Thatcher's vision of the "New Britain" and the Other Sides of the
"Cambridge Phenomenon'·. Environnıenı and Planning: Society and Space 9: 91-116. Hirst, P. and Thomson. (1996), Globa1iı.ation in Question. Canıbridge: Poliıy Press.
MeCann, P. (l997)"How Deeply Embedded is Silicen Glen? A cautionary note",Regioııal Studies 31
(7): 695-703.
Newlandş, D. (2003) "Compdilio~nd Cooperation in Industrial Clustl!J'!i: the Implications for Pubüc poücy". Europea1l Planııiııg Studies 11(5): 521·32.
Pery, M. (1995) "Industry Structures, Network!!. and Joint Action Group!!.", Regional Studies 29(3):
208-17.
Porter. M.E. (1998), "Clusters and lhe New Economics of Competition". Harvard Business Review. November-Oecember.
Rosenfeld. S.A. (1991). "Over Aehievers: Business Clusters that Work, Prospeeı!!. for Reglonal Development". Chapel Hill, Ne: Regional Technology Sltategic!s.lnc. 1991.
Rosenfeld, S.A. (1995), "Industrial-Strength Strategies: Business Clu.~lers and PubLic Policy". The Aspen ln.~titute for Humanistic Studies, Washington, OC, 1995,
Rosenfdd, S. (2003). "Expandlng Opportunjties: Cluster Strategies that Reach Mon: People and More Places", European Platınitıg Studies 11(4): 359-77.
Sadowski, S.M .. Maitland. C. & Van Dongen, 1. (2002), "Strategic use of the Inl~rnet by Sma1J-and
Medium-Siıed Companies: an Exploratory Study". Information ECOnbmy and Policy. 14:
75-93.
Santarclli. E. and DaJlri. S. (2003), "The Diffusion of e-commerce Among SME. .. : Theoretical lmplications and Empiricaı Evidenee". Smail Business Economics, 21 :273;283.
Skrnbcrg, E. (1991), The SectoraJ Cluster in Economic Development Policy: Lessons from Rochester and Buffa1o. New York, Economic Policy: Lessons from Rochester and Suffalo, New York. Stoneman, P. & Toivanen O. (1997), "The Diffu.~ion of Multiple Technologies: An Empirica1 Study".
Economics ollnnovaıiotl and New Technology. 5: )-18.
Tracy, P. & Clark, G.L. (2003), "A11iances, Network.'> and Competitive Slrategy: Rethinking Clusters of Innovalion", Growth & Change, 34(1).