Full Terms & Conditions of access and use can be found at
https://www.tandfonline.com/action/journalInformation?journalCode=lanl20
Analytical Letters
ISSN: 0003-2719 (Print) 1532-236X (Online) Journal homepage: https://www.tandfonline.com/loi/lanl20
Trace Elemental Analysis of Allium Species by
Inductively Coupled Plasma-Mass Spectrometry
(ICP-MS) with Multivariate Chemometrics
Elif Varhan Oral, Özge Tokul-Ölmez, İsmail Yener, Mehmet Firat, Zeki Tunay,
Pınar Terzioğlu, Fırat Aydin, Mehmet Öztürk & Abdulselam Ertaş
To cite this article: Elif Varhan Oral, Özge Tokul-Ölmez, İsmail Yener, Mehmet Firat, Zeki Tunay, Pınar Terzioğlu, Fırat Aydin, Mehmet Öztürk & Abdulselam Ertaş (2019) Trace Elemental Analysis of Allium Species by Inductively Coupled Plasma-Mass Spectrometry (ICP-MS) with Multivariate Chemometrics, Analytical Letters, 52:2, 320-336, DOI: 10.1080/00032719.2018.1460376
To link to this article: https://doi.org/10.1080/00032719.2018.1460376
Published online: 09 May 2018.
Submit your article to this journal
Article views: 415
View related articles
View Crossmark data
Citing articles: 3 View citing articles
~ Tll~lorf,J,;t1,caC:rlklj1 ~
..
[?1.111
tl1
[? [? CrossMark~
[?ANALYTICAL LETTERS
https://doi.org/10.1080/00032719.2018.1460376
ENVIRONMENTAL ANALYSIS
Trace Elemental Analysis of Allium Species by Inductively
Coupled Plasma-Mass Spectrometry (ICP-MS) with
Multivariate Chemometrics
Elif Varhan Orala, Özge Tokul-Ölmezb, İsmail Yenera, Mehmet Firatc, Zeki Tunayd,
Pınar Terzioğlue, Fırat Aydinf, Mehmet Öztürkb, and Abdulselam Ertaşg
aDepartment of Analytical Chemistry, Faculty of Pharmacy, Dicle University, Diyarbakır, Turkey; bDepartment of
Chemistry, Faculty of Science, Muğla Sıtkı Koçman University, Mugla, Turkey; cDepartment of Biology, Faculty
of Education, Yüzüncü Yıl University, Van, Turkey; dScience and Technology Application and Research Center,
Dicle University, Diyarbakir, Turkey; eDepartment of Chemistry and Chemical Processing Technologies, Mugla
Vocational School, Muğla Sıtkı Koçman University, Mugla, Turkey; fDepartment of Chemistry, Faculty of
Science, Dicle University, Diyarbakır, Turkey; gDepartment of Pharmacognosy, Faculty of Pharmacy, Dicle
University, Diyarbakır, Turkey
ABSTRACT
Aerial parts and roots of the 12 Allium species collected from five localities of Turkey were studied for trace elements (Ag, As, Cd, Co, Cr, Cu, Ni, Pb, Se, Tl, V, and Zn) using inductively coupled plasma mass spectrometry (ICP-MS). A tomato leaves certified reference material was used to characterize the accuracy and precision of the analysis. Each Allium species contained Se (315–2740 µg/kg), Tl (2.75–71 µg/kg), V (77–6790 µg/kg), and Zn (3.73–26.6 mg/kg) which can meet the necessary daily intake of these minerals. In addition, chemometric analyses were performed using correlation analysis, principal compo-nent analysis, and hierarchical cluster analysis to determine the association of 12 trace elements in the Allium species. Using chemometrics, the distribution of elements between aerial parts and roots, and geographic collection localities of Allium species were also examined. This study is important the consumers because of the wide consumption of Allium species. This report is the first detailed characterization of the metal content of Allium species.
ARTICLE HISTORY
Received 27 November 2017 Accepted 29 March 2018
KEYWORDS
Allium species; hierarchical
cluster analysis; inductively coupled plasma mass spectrometry; principal component analysis; trace elements
Introduction
The Allium genus belonging to Amaryllidaceae family is represented by more than 800 species around the world, 179 of which grow naturally in Turkey (Guner et al. 2012). Garlic (A. sativum), leek (A.ampeloprasum), and onion (A. cepa) are well-known Allium species. Generally, Allium genus is native to the Northern Hemisphere. Most of the garlic smelling Allium species are in the Eastern Europe and Western Asia (Guner et al. 2012). Various types of onion and garlic have been used medicinally and also consumed as food since ancient times.
CONTACT Elif Varhan Oral [email protected] Department of Analytical Chemistry, Faculty of Pharmacy, Dicle University, Diyarbakır 21280, Turkey.
Color versions of one or more of the figures in the article can be found online at www.tandfonline.com/lanl. Portions of this paper were presented at the Third International Conference on New Trends in Chemometrics and Applications 25–28 May 2016, Side-Antalya, Turkey.
© 2018 Taylor & Francis
~
Taylor&
Francis~ Taylor&FrancisGroup
In general, the leaves and bulbs of some of the Allium species are cultured for consumption (Özçelik 1992; Ozyurt et al. 2013; Devi et al. 2014). The whole parts of Allium species are used for the preparation of cheese (Özçelik 1992), and the leaves and roots are used in meals, pilaf, and soups (Baytop 1999; Devi et al. 2014; Fırat
2015a, 2015b). Due to the edibility, scientists have been interested in search Allium
species for years. These scientific studies revealed that onion and garlic possessed various biological and pharmacological activities. Therefore, the extracts obtained from different Allium species are used in modern medicine (Shirshova et al. 2013). In particular, onions and garlic have potential health benefits against many diseases (Fırat 2015a, 2015b). To the best of our knowledge, Allium species minimize or stop the progress of cancer, respiratory tract, gastroenterological, asthma, joint pains, rheumatism, liver failure diseases due to their antibiotic, and antiseptic and antioxidant properties (Corzo-Martinez et al. 2007).
Trace elements are necessary for the human diet. The medicinal plants are valuable sources of the elements which have different roles in biological systems (Basgel and Erdemoglu 2006; Negi et al. 2012). They play important roles in the formation of bioactive pharmaceuticals in the living organisms. The elemental composition of medicinal plants and foods should be well defined since medicinal plants can be contaminated easily during cultivation (Wesolowski and Konieczynski 2003; Basgel and Erdemoglu 2006). The connection of trace elements and living organisms is mainly plants. Therefore, the level of these elements in medicinal plants is very important and affected by the geochemical conditions of the soil and the accumulation ability of plant for these elements.
Bioavailability of the trace elements depends on their form of accumulation in plant such as ionic or non-ionic form and this term is important for metal toxicity in living organisms (Basgel and Erdemoglu 2006). Excessive concentrations of elements such as chromium, copper, cobalt, iron, and zinc lead to metal toxicity (Abugassa et al. 2008). Heavy metals such as cadmium, lead, and mercury are toxic even at low concentrations (Tokalioglu 2012). There are various reasons for the heavy metal accumulation in plants. The cadmium and lead concentrations in plants growing near industrialized cities are high due to the environmental pollution. Accordingly, high levels of arsenic and other heavy metals may be related to the over-application of fertilizers and pesticides (Matos-Reyes et al. 2010; Giacomino et al. 2015). Macro- and micro-environmental variables of soil and climate may change the elemental compositions of the same species (Wesolowski and Konieczynski 2003). Considering these facts, it is important to examine the trace element composition of medicinal plants and foods (Nookabkaew et al. 2006; Abugassa et al. 2008).
To determine the trace element composition in plants, many techniques have been used such as graphite furnace atomic absorption spectrometry (Kalicanin and Velimirovic,
2013), flame atomic absorptions spectrometry (Shen et al. 2015; Basgel and Erdemoglu
2006; Choudhury and Garg 2007; Tokalioglu 2012; Pereira and Dantas 2016; Yildiz et al.
2016), inductively coupled plasma optical emission spectrometry, (Basgel and Erdemoglu
2006; Pytlakowska et al. 2012; Szymczycha-Madeja et al. 2013; Froes et al. 2014; Szymczy-cha-Madeja et al. 2015) and inductively coupled plasma mass spectrometry (ICP-MS) (Filipiak-Szok et al. 2015; Tokalioglu 2012; Bora et al. 2015; Milani et al. 2015; Hwang et al. 2016; Nho et al. 2017; Voica et al. 2017) and X-ray fluorescence spectrometry (Vassileva and Hoenig 2001; Sun et al. 2004). Among the techniques, ICP-MS is effective
and widely used due to its excellent precision, accuracy and wide dynamic range in determining multiple elements at trace levels.
The aim of the present study is to determine silver (Ag), arsenic (As), cadmium (Cd), cobalt (Co), chromium (Cr), copper (Cu), nickel (Ni), lead (Pb), selenium (Se), thallium (Tl), vanadium (V), and zinc (Zn) by ICP-MS technique in different tissues of 12 Allium species, which were collected from Hakkari, Van, Şırnak, Malatya, and Adıyaman, Turkey technique. Chemometric analyses were performed using principal component analyses (PCA) and hierarchical cluster analyses (HCA) to evaluate the relationship between the selected metals and the different parts of Allium species with the collection locations. The results of this study provide a better understanding of the trace element content of Allium species and facilitate the identification of plants for further investigations.
Materials and methods
Collection and preparation of plant samples
The trace elemental composition (Ag, As, Cd, Co, Cr, Cu, Ni, Pb, Se, Tl, V, and Zn) of aerial parts and roots of the 12 Allium species collected from five regions of Turkey (Hakkari, Van, Şırnak, Malatya, and Adıyaman) were studied by ICP-MS.
The samples were washed with tap water, then ultrapure deionized water and dried at 70°C for 48 h. The dried samples were powdered using a blender (Basgel and Erdemoglu
2006; Tokalioglu 2012; Pereira and Dantas 2016).
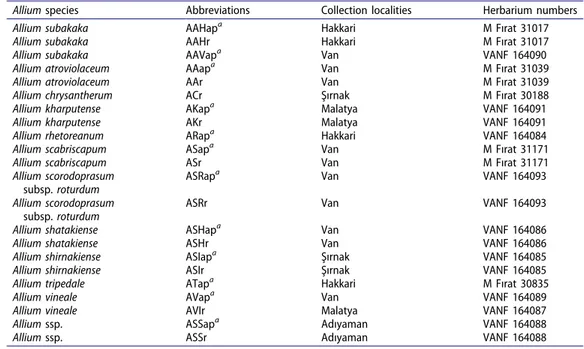
The species, notations, and provenance of the Allium species are given in Table 1. The aerial parts and roots were coded as A (Allium sp.), ap (aerial parts) and r (roots), respectively.
Table 1. List of species, abbreviations, collection locations, and herbarium numbers of the Allium species.
Allium species Abbreviations Collection localities Herbarium numbers
Allium subakaka AAHapa Hakkari M Fırat 31017
Allium subakaka AAHr Hakkari M Fırat 31017
Allium subakaka AAVapa Van VANF 164090
Allium atroviolaceum AAapa Van M Fırat 31039
Allium atroviolaceum AAr Van M Fırat 31039
Allium chrysantherum ACr Şırnak M Fırat 30188
Allium kharputense AKapa Malatya VANF 164091
Allium kharputense AKr Malatya VANF 164091
Allium rhetoreanum ARapa Hakkari VANF 164084
Allium scabriscapum ASapa Van M Fırat 31171
Allium scabriscapum ASr Van M Fırat 31171
Allium scorodoprasum
subsp. roturdum
ASRapa Van VANF 164093
Allium scorodoprasum
subsp. roturdum
ASRr Van VANF 164093
Allium shatakiense ASHapa Van VANF 164086
Allium shatakiense ASHr Van VANF 164086
Allium shirnakiense ASIapa Şırnak VANF 164085
Allium shirnakiense ASIr Şırnak VANF 164085
Allium tripedale ATapa Hakkari M Fırat 30835
Allium vineale AVapa Van VANF 164089
Allium vineale AVIr Malatya VANF 164087
Allium ssp. ASSapa Adıyaman VANF 164088
Allium ssp. ASSr Adıyaman VANF 164088
aap: aerial parts and r: roots.
Reagents
Ultrapure deionized water (18.2 MΩ cm−1) was used in all experiments. Nitric acid (Merck, Darmstadt, Germany) and hydrogen peroxide (Merck, Darmstadt, Germany) with analytical purity were used in the digestion process. Internal and calibration standards were obtained from Agilent Technologies (USA).
In the ICP-MS measurements, high purity solutions of 45Sc for Co, Cr, Cu, Ni and V;
72
Ge for As, Se and Zn; 115In for Ag; and 209Bi for Cd, Pb and Tl were used as the mixed internal standards (200 µg/L). The calibration standard solutions (0–100 µg/L) were prepared by appropriate dilution of the stock mixed standards (10 mg/L).
Digestion of the samples
The powdered samples (200 mg) were digested with concentrated HNO3 (6 mL) and H2O2
(2 mL) using a microwave system. After completion of the process, the cooled and digested samples were transferred from polytetrafluorethylene tubes to volumetric flasks and diluted to 25 mL with ultrapure deionized water. During the experiments, all glassware and equipment were carefully cleaned starting with 2–4% HNO3 and ending with repeated
rinsing with ultrapure deionized water to prevent contamination (Basgel and Erdemoglu
2006). Three blank solutions were also prepared. The same digestion process was applied to the CRM NIST1573a tomato leaves in order to determine the accuracy and precision of the method.
Instrumentation
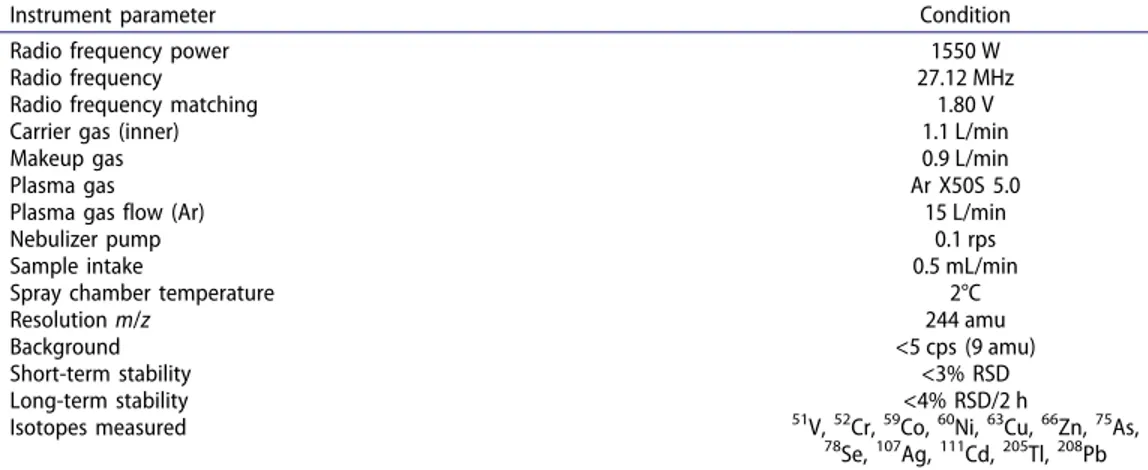
An Agilent 7700X ICP-MS (Tokyo, Japan) was used for the determination of Ag, As, Cd, Co, Cr, Cu, Ni, Pb, Se, Tl, V, and Zn in the samples. The operating conditions for the ICP-MS are shown in Table 2. High purity argon was used as a carrier, makeup, and plasma gas. Helium was used to eliminate interferences. Digestion procedure of the samples prior to analysis was carried out in a Milestone Start D microwave digestion system (Denmark). The operation conditions of the microwave digestion system are given in Table 3.
Table 2. Optimum ICP-MS operating conditions for the analysis of Allium species (Bora et al. 2015).
Instrument parameter Condition
Radio frequency power 1550 W
Radio frequency 27.12 MHz
Radio frequency matching 1.80 V
Carrier gas (inner) 1.1 L/min
Makeup gas 0.9 L/min
Plasma gas Ar X50S 5.0
Plasma gas flow (Ar) 15 L/min
Nebulizer pump 0.1 rps
Sample intake 0.5 mL/min
Spray chamber temperature 2°C
Resolution m/z 244 amu
Background <5 cps (9 amu)
Short-term stability <3% RSD
Long-term stability <4% RSD/2 h
Isotopes measured 51V, 52Cr, 59Co, 60Ni, 63Cu, 66Zn, 75As,
78
Performance parameters
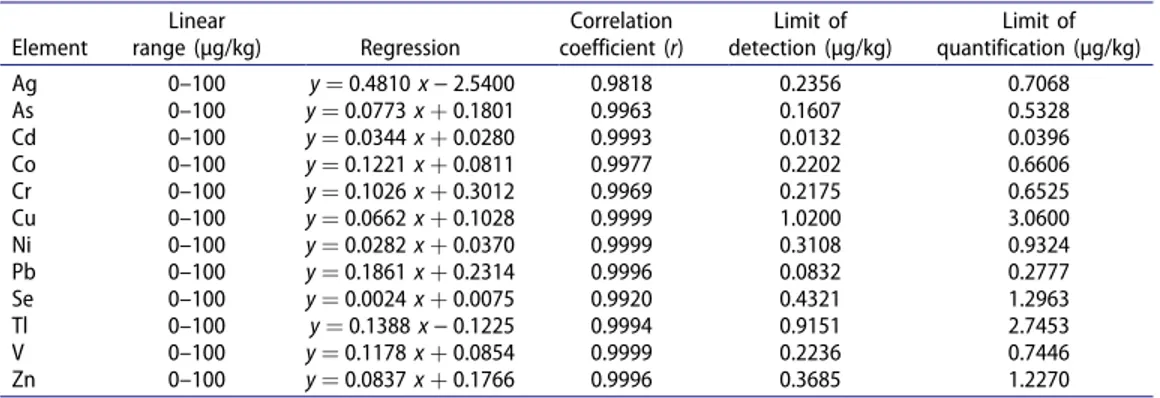
The linear range, regression correlation coefficient (r2), limits of quantification (LOQ) and limits of detection (LOD) values, which belong to the calibration curve drawn under the optimum operating conditions for 12 elements, are given in Table 4. The linearity was evaluated to be acceptable for r2 values that were higher than 0.99. The limits of detection and quantification for the metals were calculated using standard deviation (σblank) of 12
independent blank solutions and the slope (m) of the calibration graph to obtain LOD or LOQ ¼ a �rblank
m ð1Þ
where a is equal to 3 for the LOD and 10 for the LOQ. The accuracy and precision of the method were evaluated using certified reference material CRM NIST1573a tomato leaves (National Institute of Standards and Technology, NIST, Gaithersburg, MD, USA). The analytical results for CRM NIST1573a tomato leaves are given in Table 5.
Statistical analysis
Common chemometric techniques include PCA and the HCA. PCA is a multivariate data analysis method that provides the relationship between the samples and the interaction between the variables. This technique reveals new relationships and is used to make predictions which cannot be characterized as ordinary results (Diraman and Dibeklioglu
2009). Based on a large number of variables on a given sample system, PCA-based methods can cluster and classify the mentioned samples into various groups. Principal component analysis was applied to clear classification of the analyzed trace elements of plant samples belonging to same species.
Table 3. Microwave operating conditions for the digestion of Allium species (Bora et al. 2015).
Step Time (min) T1 (°C) T2 (°C) P (bar) Power (W)
1 15 200 110 45 1200
2 15 200 110 45 1200
Table 4. Analytical parameters of the ICP-MS method (Bora et al. 2015). Element Linear range (µg/kg) Regression Correlation coefficient (r) Limit of detection (µg/kg) Limit of quantification (µg/kg) Ag 0–100 y ¼ 0.4810 x − 2.5400 0.9818 0.2356 0.7068 As 0–100 y ¼ 0.0773 x þ 0.1801 0.9963 0.1607 0.5328 Cd 0–100 y ¼ 0.0344 x þ 0.0280 0.9993 0.0132 0.0396 Co 0–100 y ¼ 0.1221 x þ 0.0811 0.9977 0.2202 0.6606 Cr 0–100 y ¼ 0.1026 x þ 0.3012 0.9969 0.2175 0.6525 Cu 0–100 y ¼ 0.0662 x þ 0.1028 0.9999 1.0200 3.0600 Ni 0–100 y ¼ 0.0282 x þ 0.0370 0.9999 0.3108 0.9324 Pb 0–100 y ¼ 0.1861 x þ 0.2314 0.9996 0.0832 0.2777 Se 0–100 y ¼ 0.0024 x þ 0.0075 0.9920 0.4321 1.2963 Tl 0–100 y ¼ 0.1388 x − 0.1225 0.9994 0.9151 2.7453 V 0–100 y ¼ 0.1178 x þ 0.0854 0.9999 0.2236 0.7446 Zn 0–100 y ¼ 0.0837 x þ 0.1766 0.9996 0.3685 1.2270
Values expressed are means � standard deviation of three parallel measurements (p < 0.05).
Cluster (CA) technique gives information about the classification of the samples. HCA is a method which classifies the samples in a given sample set and the variables defining those samples by their similarities.
Minitab 16.2.1. statistical software (MINITAB Inc., 2010) was used for statistical analysis of the data. Among the methods of multivariate data analysis, PCA and HCA were used on experimental measurements of the trace element components of the Allium species. The chemometric analysis was applied to discriminate and classify parts and geographic origins of 12 Allium species according to trace element concentrations. The main goal while per-forming PCA and HA methods to the entire data set was to examine similarities between the Allium species and trace element concentrations.
Results and discussion
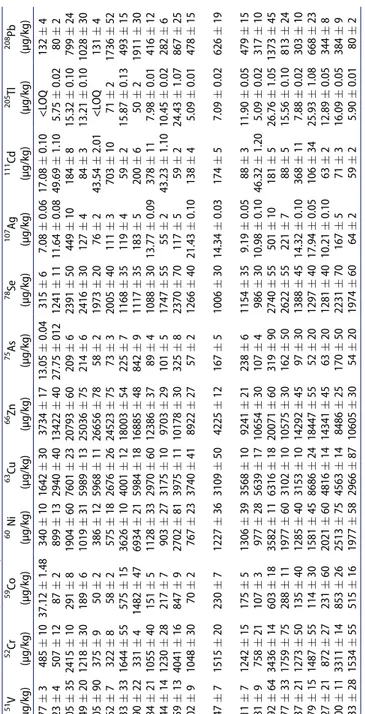
The trace elements concentrations of Allium species are presented in Table 6. The results exhibited that the concentrations of studied metals (Ag, As, Cd, Co, Cr, Cu, Ni, Pb, Se, Tl, V, and Zn) varied depending on the parts of Allium species (aerial parts or root), and the collection localities. Cu and Zn concentrations were relatively high in all species while Tl existed at the lowest concentrations.
The concentrations of Ag and Se metals in aerial parts and roots of A. kharputense (AKap, AKr) and A. shatakiense (ASHap, ASHr) were at the same level. Moreover, the levels of Se and Tl were same in the aerial parts and roots of A. shirnakiense (ASIap, ASIr). The Ag, Cd and Tl levels were similar in A. scorodoprasum subsp. roturdum samples (ASRap, ASRr). The levels of other elements differed from part to part.
Arsenic can be commonly found in food. Medicinal plants, vegetables, pulses, and cereals generally represent the source of arsenic intake. The level of human exposure is considered part of the health protection programs because of its toxicity (d’Amato et al.
2004; Sanz et al. 2005; Matos-Reyes et al. 2007). Therefore, it is important to monitor arsenic available in foods (Matos-Reyes et al. 2010). As can be seen from Table 6, the con-centration of arsenic was between 13 and 325 µg/kg in the Allium species. Matos-Reyes et al. (2010) found 39 and 83 µg/kg of arsenic in onion and garlic, respectively. Choudhury and Garg (2007) determined arsenic to be in the ranges of 55.1–111.0 µg/kg in the medicinal plant Murraya koenigii, which is grown in different cities of India.
The cadmium concentrations of samples varied between 17 and 703 µg/kg. The World Health Organization (WHO) reported the permissible level for Cd in edible plants to be Table 5. Accuracy assessment by the analysis of the tomato leaves certified reference material (CRM NIST1573a) (Bora et al. 2015).
Elements Certified (mg/kg) Found (mg/kg)
Fortified recovery (%) As 0.122 � 0.004 0.127 � 0.005 104 Cr 1.99 � 0.06 2.01 � 0.08 101 Cd 1.52 � 0.04 1.49 � 0.04 98 Co 0.57 � 0.02 0.56 � 0.06 98 Cu 4.70 � 0.14 4.76 � 0.08 101 Ni 1.59 � 0.07 1.57 � 0.11 99 Se 0.054 � 0.003 0.051 � 0.003 94 V 0.835 � 0.010 0.826 � 0.008 99 Zn 30.9 � 0.7 31.3 � 0.2 101
Table 6. Trace element concentrations of Allium species by ICP-MS. a Allium species Abbreviations 51V (µg/kg) 52Cr (µg/kg) 59Co (µg/kg) 60 Ni (µg/kg) 63Cu (µg/kg) 66Zn (µg/kg) 75As (µg/kg) 78Se (µg/kg) 107 Ag (µg/kg) 111 Cd (µg/kg) 205 Tl (µg/kg) 208 Pb (µg/kg) A. subakaka AAHap 77 � 3 485 � 10 37.12 � 1.48 340 � 10 1642 � 30 3734 � 17 13.05 � 0.04 315 � 6 7.08 � 0.06 17.08 � 0.10 <LOQ 132 � 4 A. subakaka AAHr 123 � 4 507 � 12 87 � 2 899 � 13 2940 � 40 13422 � 40 27.75 � 012 1241 � 11 11.64 � 0.08 49.69 � 1.10 5.75 � 0.02 80 � 2 A. subakaka AAVap 1405 � 35 2415 � 10 291 � 8 1904 � 60 7601 � 23 20793 � 60 209 � 6 2391 � 50 449 � 10 184 � 8 15.32 � 0.10 799 � 24 A. atroviolaceum AAap 949 � 20 1218 � 30 189 � 6 1019 � 31 5989 � 13 25036 � 75 214 � 6 2416 � 30 127 � 4 84 � 3 13.21 � 0.10 1028 � 30 A. atroviolaceum AAr 305 � 90 375 � 9 50 � 2 386 � 12 5968 � 11 26656 � 78 58 � 2 1973 � 20 76 � 2 43.54 � 2.01 <LOQ 131 � 4 A. chrysantherum ACr 162 � 7 322 � 8 58 � 2 575 � 18 2676 � 26 24523 � 75 73 � 3 2005 � 40 111 � 3 703 � 10 71 � 2 1736 � 52 A. kharputense AKap 2333 � 33 1644 � 55 575 � 15 3626 � 10 4001 � 12 18003 � 54 225 � 7 1168 � 35 119 � 4 59 � 2 15.87 � 0.13 493 � 15 A. kharputense AKr 6790 � 22 331 � 4 1482 � 47 6934 � 21 5984 � 18 16885 � 48 842 � 9 1117 � 35 183 � 5 200 � 6 50 � 2 1911 � 30 A. rhetoreanum ARap 684 � 21 1055 � 40 151 � 5 1128 � 33 2970 � 60 12386 � 37 89 � 4 1088 � 30 13.77 � 0.09 378 � 11 7.98 � 0.01 416 � 12 A. scabriscapum ASap 944 � 14 1230 � 28 217 � 7 903 � 27 3175 � 10 9703 � 29 101 � 5 1747 � 55 55 � 2 43.23 � 1.10 10.45 � 0.02 282 � 6 A. scabriscapum ASr 4359 � 13 4041 � 16 847 � 9 2702 � 81 3975 � 11 10178 � 30 325 � 8 2370 � 70 117 � 5 59 � 2 24.43 � 1.07 867 � 25 A. scorodoprasum subsp. roturdum ASRap 302 � 9 1048 � 30 70 � 2 767 � 23 3740 � 41 8922 � 27 57 � 2 1266 � 40 21.43 � 0.10 138 � 4 5.09 � 0.01 478 � 15 A. scorodoprasum subsp. roturdum ASRr 947 � 7 1515 � 20 230 � 7 1227 � 36 3109 � 50 4225 � 12 167 � 5 1006 � 30 14.34 � 0.03 174 � 5 7.09 � 0.02 626 � 19 A. shatakiense ASHap 811 � 7 1242 � 15 175 � 5 1306 � 39 3568 � 10 9241 � 21 238 � 6 1154 � 35 9.19 � 0.05 88 � 3 11.90 � 0.05 479 � 15 A. shatakiense ASHr 381 � 9 758 � 21 107 � 3 977 � 28 5639 � 17 10654 � 30 107 � 4 986 � 30 10.98 � 0.10 46.32 � 1.20 5.09 � 0.02 317 � 10 A. shirnakiense ASIap 2592 � 64 3436 � 14 603 � 18 3582 � 11 6316 � 18 20071 � 60 319 � 90 2740 � 55 501 � 10 181 � 5 26.76 � 1.05 1373 � 45 A. shirnakiense ASIr 1277 � 33 1759 � 75 288 � 11 1977 � 60 3102 � 10 10575 � 30 162 � 50 2622 � 55 221 � 7 88 � 5 15.56 � 0.10 813 � 24 A. tripedale ATap 637 � 21 1273 � 50 135 � 40 1285 � 40 3153 � 10 14292 � 45 97 � 30 1388 � 45 14.32 � 0.10 368 � 11 7.88 � 0.02 303 � 10 A. vineale AVap 479 � 15 1487 � 55 114 � 30 1581 � 45 8686 � 24 18447 � 55 52 � 20 1297 � 40 17.94 � 0.05 106 � 34 25.93 � 1.08 668 � 23 A. vineale AVIr 627 � 21 872 � 27 231 � 60 2021 � 60 4816 � 14 14341 � 45 63 � 20 1281 � 40 10.21 � 0.10 63 � 2 12.89 � 0.05 344 � 8 Allium sp. ASSap 3400 � 11 3311 � 14 853 � 26 2513 � 75 4563 � 14 8486 � 25 170 � 50 2231 � 70 167 � 5 71 � 3 16.09 � 0.05 384 � 9 Allium sp. ASSr 1433 � 28 1534 � 55 515 � 16 1977 � 58 2966 � 87 10605 � 30 54 � 20 1974 � 60 64 � 2 59 � 2 5.90 � 0.01 80 � 2 a Values expressed are means � standard deviation of three parallel measurements (p < 0.05). 7
200 µg/kg (Dubale et al. 2015; WHO 2007). The Cd levels of all the samples, except ATap, ARap, and ACta, were below the WHO limits. The Cd content was also detected to be 200 µg/kg in Allium cepa grown in two places in Africa (Bvenura and Afolayan 2012).
Another essential element, chromium serves as a cofactor in insulin synthesis and cholesterol. In this study, the concentration of Cr was found in the ranges of 322–4044 µg/kg in the Allium species. Between the Allium groups, the concentration of Cr was the highest in ASr (4044 µg/kg) and the concentration of the Cr was lowest in ACr (322 µg/kg) samples. Camargo et al. (2010), determined Cr to be 15.3–39.4 mg/kg in 10 Allium sativum L. species grown in Argentina.
In the raw herbal plant materials, the toxicity limits for lead, arsenic, chromium, and cadmium were reported to be 10.0, 5.0, 2.0, and 0.3 ppm, respectively (WHO 2007; Pereira and Dantas 2016).
Plants require nutrients including trace elements that are found in the soil (Taha et al.
2013). Zinc is one of the basic elements necessary for plant growth. Among the Allium species, the Zn concentrations were comparatively high. Similar result was obtained in the study of Razic et al. 2003 for the purple coneflower (Echinacea purpurea). Zinc in the Allium species was in the range of 3.73–26.66 mg/kg. The highest Zn concentration was encountered in AAr (26.66 mg/kg), while the lowest was in AAHap (3.73 mg/kg). The WHO has established the permissible level for Zn in edible plants as 27.40 mg/kg (WHO 2007). The Zn concentrations of the studied Allium species were below the permiss-ible level. In recent studies, the Zn levels were in the range of 46.34–89.88 mg/kg in onions growing in South Africa (Bvenura and Afolayan 2012), 439–957 mg/kg in Allium sativum L. growing in Argentina (Camargo et al. 2010), and 0.92–1.53 mg/kg in A. cepa L. from Tenerife (Galdon et al. 2008).
Hitherto, there has been no cobalt level criteria established in medicinal plants (Dubale et al. 2015). The concentration of Co varied from 37 to 853 µg/kg in Allium species. The highest concentration was determined in ASSap (853 µg/kg), while the lowest in AAHap (37 µg/kg). Camargo et al. (2010) determined Co to be 0.216–2.490 mg/kg in Allium sati-vum L. from Argentina.
Copper is a micronutrient element for plants. Excessive concentrations are toxic (Tarakci and Temiz 2009; Brun et al. 2001) and harmful to human health. Furthermore, it can decrease hypertension and enhance the infertility effects of lead (Vitali et al.
2008). The Cu concentration of the tested Allium species were 1.64–8.69 mg/kg. The high-est concentration of Cu was in AVap (8.69 mg/kg) and the lowhigh-est in AAHap (1.64 mg/kg). Bvenura and Afolayan (2012) found Cu to be 7.56–9.24 mg/kg in onions (A. cepa) from South Africa. Galdon et al. (2008) determined Cu to be 0.25–0.41 mg/kg in the A. cepa. The WHO established the permissible level for Cu in edible plants to be 3 mg/kg (WHO 2007). The Cu concentration of the Allium species, except AAHap, AHHr, ACr and Arap, exceeded these limits.
The cadmium concentrations of Allium species ranged from 17 to 703 µg/kg. The WHO has assigned the permissible level for Cd in edible plants to be 200 µg/kg (Dubale et al.
2015; WHO 2007). The Cd levels of all samples, except ATap, ARap, and ACta, were below the WHO limit. Bvenura and Afolayan (2012) determined Cd to be 0.20 mg/kg in A. cepa from two African locations (Bvenura and Afolayan 2012; Tokalioglu 2012).
Lead is a highly toxic heavy metal which causes various health problems including anemia, chills, diarrhea, headache, behavior disorders, and mental retardation (Singh
et al. 2008; Oymak et al. 2009; Liu et al. 2010; Terzioglu et al. 2017). The Pb concentrations of samples varied between 0.08 and 1.74 mg/kg. The Pb concentrations of all Allium spe-cies, except ASIap and AAap, were below the WHO limit (10 mg/kg) for Pb (Dubale et al.
2015; WHO 2007).
The WHO has provided reported the permissible level for Ni in edible plants to be 1.63 mg/kg (WHO 2007). However, there are not any established WHO limits for Ni in medicinal plants. Nickel-induced toxicity in humans is rare since the Ni absorption in the body is very low. The Ni concentrations of studied Allium species varied between 0.34 and 3.63 mg/kg.
Selenium is essential trace element necessary for people and animals. It has antioxidant, anti-inflammatory, and immunological properties and also protective effects against toxic elements, cancer, and heart problems (Al-Saleh 2000; Chope et al. 2016). The Se concen-trations of Allium species varied between 0.32 and 2.74 mg/kg.
Thallium is more toxic than mercury, lead, and cadmium. It can be harmful to living organisms even at very low levels (Leonard and Gerber 1997; Nriagu 1998). The intake of 20–60 mg of thallium per kilogram human body weight can be fatal. In this study, the samples had low thallium concentrations (2–71 µg/kg).
Vanadium has both positive and negative health effects. Its compounds lead to hypoglycemia by lowering blood sugar for people, while they can be evaluated as an antineoplastic agent against human cancer (Evangelou 2002). There is not any study in the literature conducted on the determination of V and Ag elements in garlic species. V and Ag have been examined in the Allium species for the first time. The V and Ag concentrations of samples were 0.77–4.36 mg/kg and 7–501 µg/kg, respectively.
In the raw herbal plant materials, the toxicity limits for lead, arsenic, chromium, and cadmium have been reported to be 10.0, 5.0, 2.0, and 0.3 ppm, respectively (Pereira and Dantas 2016; WHO 2007).
The magnitude of heavy metal accumulation determined in different tissues of Allium species was arranged as Zn > Cu > Cr > Pb > Cd. Our results were in agreement with those of Ali and Al-Qahtani (2012) who reported the concentration of heavy metals (Fe, Mn, Cu, Zn, Pb, Cd, and Hg) in various vegetables (turnips, carrot, onions, potatoes, parsley, jews mallow, spinach, arugula, cabbage, cucumber, tomato, wheat, rice, beans, haricot, kidney bean) collected from main cities (Damamm, Jazan, Riyadh, and Tabouk) of Kingdom of Saudi Arabia. Also, Singh et al. (2012) reported a similar arrangement for heavy metal content (Zn > Cu > Pb > Ni > Cd) of different vegetables.
The variations in concentrations of the elements are partly due to the differences in the anatomy of the specific part of the plant, as well as to the chemical composition of the soil in the different localities (Razic et al. 2003). Absorption and accumulation of trace elements in plant tissue are based on several factors (Sharma et al. 2007). Nevertheless, the uptake and transfer of trace elements may be altered depending on the properties of the element and type of plant (Chauhan and Kumar 2015).
Correlation analysis
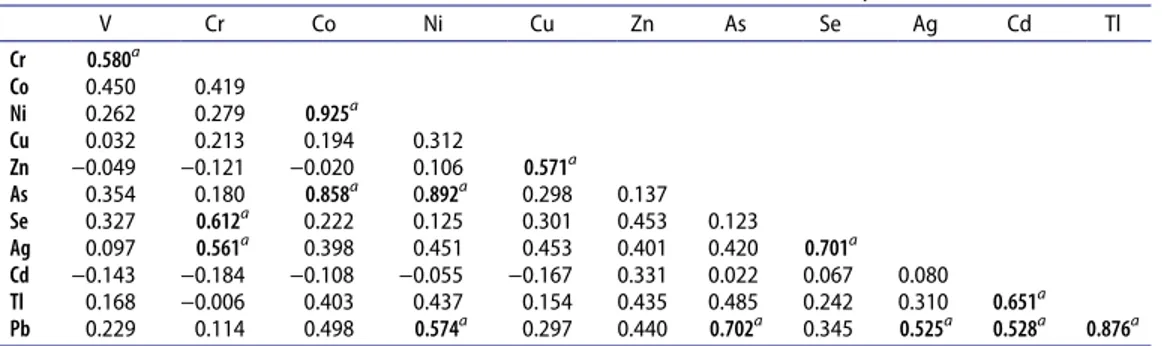
Pearson correlation coefficients for 12 trace elements are given in Table 7. The positive and negative correlation coefficients between two metals indicate the positive and negative cor-relations, respectively. The positive correlation can be explained by a direct relationship of
variables in which both variables increase or decrease together. If the value of correlation coefficients of two variables is near �1, it indicates a high level of correlation between the variables. However, a value near 0 signifies actually no correlation between two variables (Karadas and Kara 2012). Ag, As, Se, and Pb had positive correlations with all elements given in Table 7. Moreover, Tl has positive correlation with all elements except Cr. Also Ni and Cu have the positive correlation with all elements except Cd.
Correlation coefficient values higher than 0.5 were evaluated for the discussion of the results. Ni has very high positive correlation with As and Co, while a moderate positive correlation was observed with Pb. Tl has a high positive correlation with Pb and moderate positive correlation with Cd. Co was positively correlated to As. Ag has a high correlation with Se and lower correlation with Cr. Arsenic has a high correlation with Pb.
The correlation analysis can be summarized with three groups as Group 1 (Ni, As, Co, Pb, and Tl), Group 2 (Se, Ag, and Cr), and Group 3 (As, Pb, and Cd). The groups were formed according to the strongly correlated elements. The high correlation of Pb-As and Pb-Cd reflect that the Allium species may be affected by the industrial activities and traffic.
Principal component analysis
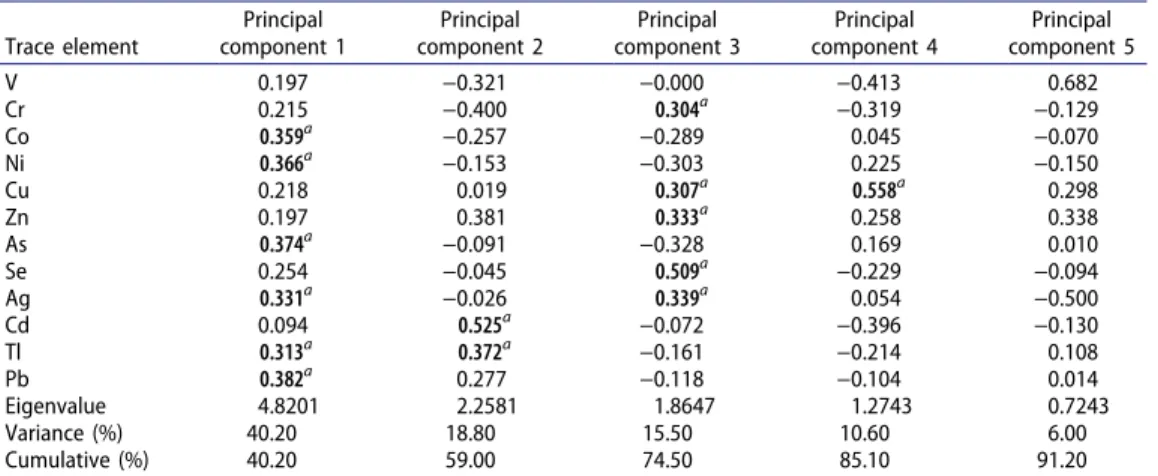
Table 8 shows the PCA results which were calculated using the concentrations of 12 trace
elements of the Allium species collected from different localities. As a result of PCA calcu-lations, four principal components were formed according to the extracted components with eigenvalues higher than 1. According to the PCA results of the Allium species, the first four principal components explained 85.10% of the total variation of all data. The first principal component (PC1) accounted for 40.20%, the second principal component (PC2) for 18.80%, the third principal component (PC3) for 15.50% and the fourth principal component for 10.60% of the total variation of the data. The values in bold type in Table 8
were more important than the others in explaining the principal components. The Co, Ni, As, Ag, Tl, and Pb were the dominant variables for the first principal component, Cd and Tl were dominant for the second principal component, Se, Ag, Zn, Cu, and Cr were domi-nant for the third principal component, and Cu was domidomi-nant for the fourth principal component.
Table 9 shows the score values of the first four principal components belonging to each
sample. It can be said that among the loading values of the first principal component, Co, Ni, As, Ag, Tl, and Pb were the dominant elements. The highest concentrations of those Table 7. Correlation matrix of trace element concentrations in the Allium species.
V Cr Co Ni Cu Zn As Se Ag Cd Tl Cr 0.580a Co 0.450 0.419 Ni 0.262 0.279 0.925a Cu 0.032 0.213 0.194 0.312 Zn −0.049 −0.121 −0.020 0.106 0.571a As 0.354 0.180 0.858a 0.892a 0.298 0.137 Se 0.327 0.612a 0.222 0.125 0.301 0.453 0.123 Ag 0.097 0.561a 0.398 0.451 0.453 0.401 0.420 0.701a Cd −0.143 −0.184 −0.108 −0.055 −0.167 0.331 0.022 0.067 0.080 Tl 0.168 −0.006 0.403 0.437 0.154 0.435 0.485 0.242 0.310 0.651a Pb 0.229 0.114 0.498 0.574a 0.297 0.440 0.702a 0.345 0.525a 0.528a 0.876a a
metals were in AKr, ASIap, ASr, and AAVap, while the lowest concentrations of the same metals were in AAHap and AAHr. It can be interpreted that while the concentrations of the Cd and Tl metals were the highest in the ACr for the second principal component and low-est for ASr. For AAVap, the concentrations of Se, Ag, Zn, Cu, and Cr belonging to the third principal component were the highest as indicated by the bold font.
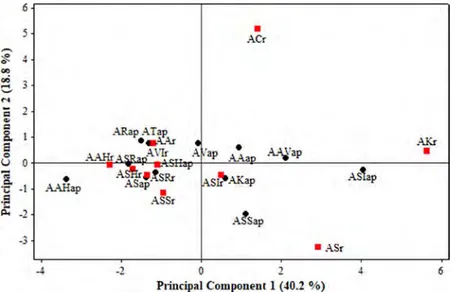
The score plot of the first two principal components (PC1 and PC2) for different tissues of the Allium species is given in Figure 1. It was clear from the score plot of the analyzed metals in the aerial tissue and roots of the Allium species that the metal Table 8. Contribution of trace elements to the four main principal components.
Trace element Principal component 1 Principal component 2 Principal component 3 Principal component 4 Principal component 5 V 0.197 −0.321 −0.000 −0.413 0.682 Cr 0.215 −0.400 0.304a −0.319 −0.129 Co 0.359a −0.257 −0.289 0.045 −0.070 Ni 0.366a −0.153 −0.303 0.225 −0.150 Cu 0.218 0.019 0.307a 0.558a 0.298 Zn 0.197 0.381 0.333a 0.258 0.338 As 0.374a −0.091 −0.328 0.169 0.010 Se 0.254 −0.045 0.509a −0.229 −0.094 Ag 0.331a −0.026 0.339a 0.054 −0.500 Cd 0.094 0.525a −0.072 −0.396 −0.130 Tl 0.313a 0.372a −0.161 −0.214 0.108 Pb 0.382a 0.277 −0.118 −0.104 0.014 Eigenvalue 4.8201 2.2581 1.8647 1.2743 0.7243 Variance (%) 40.20 18.80 15.50 10.60 6.00 Cumulative (%) 40.20 59.00 74.50 85.10 91.20
aLarger number indicates a more significant contribution of that trace elements to the separation along the principal
component (PC) axes. The bold values are the major contributors to each principal component.
Table 9. Score values of the trace elements in Allium species.
Samples Principal component 1 Principal component 2 Principal component 3 Principal component 4
AAHap −3.37403b −0.59010 −1.44363 −0.21237 AAHr −2.29744b −0.05012 −0.18056 0.25518 AAVap 2.10097a 0.20903 2.52613a 0.86668 AAap 0.94406 0.59922 1.59816 0.49171 AAr −1.20713 0.76944 1.81695 1.51705 ACr 1.40711 5.22046a −0.18588 −2.41233 AKap 0.59613 −0.55607 −0.74044 0.81750 AKr 5.63807a 0.47374 −4.04038 1.76213 ARap −1.51235 0.88564 −0.64365 −0.73528 ASap −1.37394 −0.54974 0.05065 −0.24717 ASr 2.91553a −3.21570b 0.10709 −2.72716 ASRap −1.81890 −0.00455 −0.21770 −0.15390 ASRr −1.36563 −0.44930 −1.15428 −0.57546 ASHap −1.14014 −0.32525 −0.86311 0.07364 ASHr −1.70840 −0.21764 −0.22088 1.04279 ASIap 4.03340a −0.22378 1.92665 0.10811 ASIr 0.50009 −0.44903 0.75387 −0.71458 ATap −1.31807 0.79188 −0.21393 −0.69492 AVap −0.07672 0.77403 0.85428 1.52972 AVIr −1.09498 −0.02686 −0.22403 0.77461 ASSap 1.10934 −1.93818 0.42993 −0.52022 ASSr −0.95697 −1.12712 0.06477 −0.24575 a
Bold numbers indicate the samples containing highest concentration of dominant trace elements shown in Table 7.
bItalic numbers indicate the samples containing the lowest concentration of dominant trace elements shown in Table 7.
concentrations in the roots showed similarities and were lower. Therefore, the aerial tissue and roots formed two groups. When the score (Figure 1) and the loading plots (Figure 2) were evaluated together, it is seen that ACr differed in terms of high Cd concentration. On the other hand, AKr was distinguished from the others because of the high concentrations of Pb, Cu, Ag, and Se. The ASr sample was separated due to high concentrations of Cr and V.
Figure 1. Score plot of the first two principal components (first principal component and second principal component) for aerial parts (•) and roots (♦) of the Allium species. AAHap, Arap, and ATap are aerial and AAHr roots from Hakkari; AAVap, AAap, ASap, ASRap, ASHap, and AVap are aerial and AAr, ASr, ASRr, and ASHr roots from Van; ASIap are aerial and ACr and ASIr roots from Şırnak; AKap are aerial and AKr and AVIr roots from Malatya; and ASSap are aerial and ASSr roots from Adıyaman.
Figure 2. Principal component 1 and principal component 2 loading plot of the Allium species. M 6 s
=
.,
2=
8.a
0 U 0i
·- I-
~
.. ii: -2 -3 0.50 -~ 0 00 oci 0.25 C M=
..
=
8. a 0 u 0.00 ;;"'"
·c -0.25-
~
p,, -0.50•
AAHap 0.0•
ACr ARap ATap·
-
~~
•
•
AKr A .. .\Hr _,. ~o __ A \/Ir A 1ap AA.an A ... ~ ap•
- _sf!µ-, --~,ap A •-~SRr ,\$~ --\Kap ASap•
ASSr AfSap • ASr -2 0 1 6 Principal Cowpouenl 1 (.t0.2 %) Cd Pb 0.1 0.2 0.3 o.~ACr, ASlap, and ASlr are in the right part of the score plot with higher metal concen-trations. It is remarkable that the concentration of Cd was high in the ACr, while V and Cr were high in ASlr, and As and Ni were high in ASlap. The samples collected from the Hak-kari and Van provinces were mainly situated in the left side of the score plot. Therefore, the metal concentrations of samples, especially roots, from those provinces were lower than for the other samples. Among the samples from Malatya, AKr, and AKap differed from the AVlr sample from Malatya. While the sample ASSr from Adıyaman was in the same region as the other root samples, the aerial tissue of this sample (ASSap) was in the right lower area of the score plot. Higher concentrations of Cr and V were determined in ASSap compared to in ASSr.
Different patterns in the trace element concentrations between different plant tissues have been reported in the earlier studies (Mestek et al. 2007; Tinkov et al. 2016; Tozser et al. 2017). These factors include the type of soil, forms of metals in the soil and growth stage of species (Tozser et al. 2017). Antagonistic and synergistic interactions between trace elements can influence their absorption and translocation (Madejon et al. 2004).
Cluster analysis
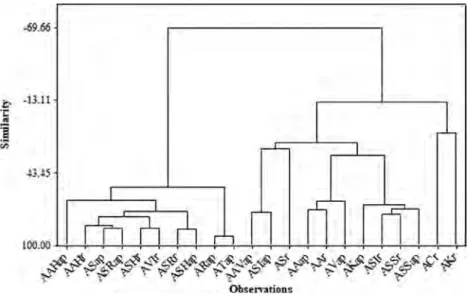
The dendogram of the cluster analysis (HCA) which was applied to the principal component score matrix is presented in Figure 3. This methodology was used in order to determine the similarities of samples belonging to the Allium species divided into aerial parts and roots. The cluster analysis was performed to compare the distributions of trace elements (Ag, As, Cd, Cr, Co, Cu, Ni, Pb, Se, Tl, V, and Zn) in all samples. The cluster analyses data were also compared with those of the PCA data. The data obtained for 12 trace elements in the Allium species were evaluated using cluster analysis. The
Figure 3. Dendograms obtained by the Euclidean distance and the Ward Linkage method. AAHap, Arap, and ATap are aerial and AAHr roots from Hakkari; AAVap, AAap, ASap, ASRap, ASHap, and AVap are aerial and AAr, ASr, ASRr, and ASHr roots from Van; ASIap are aerial and ACr and ASIr roots from Şırnak; AKap are aerial and AKr and AVIr roots from Malatya; and ASSap are aerial and ASSr roots from Adıyaman. ANALYTICAL LETTERS 13 -69.66 J·. 5 100.00 ...,____.--;----.--.---.---.---_,___,___,__.,;_.:-.:-... - - - - ' - ' - - - I . - ' - '
#:..:i-~t~#,<.#~~#,,r.,_-@.
~~~S.,s,~-if'~,@.#":J~~~..,_~~f<-#
~ 't"'l"' ~ \'"'?",,...,
~ 'r-~ 'i"" ( .... 'i?"- '?" t" .,p-Obs~ati.oD.S
measurement and classification method were based on squared Euclidean distance and Ward method, respectively. Four groups were obtained from HCA analysis:
Group 1: AAHap, AAHr, ASap, ASRap, ASHr, AVIr, ASRr, ASHap, ARap, ATap (samples from Hakkari, Van, Malatya).
Group 2: AAVap, ASIap, ASr, AAap, AAr, AVap, AKap, ASIr, ASSr, ASSap (samples from Van, Şırnak, Malatya, Adıyaman).
Group 3: ACr (sample from Şırnak). Group 4: AKr (sample from Malatya).
Conclusion
This study is important for consumers because the Allium species are widely consumed and the metal concentrations have not been studied in detail to date. The results obtained in this study provide knowledge about the relationship between the levels of metals in Allium species that were collected from various localities of Turkey. The evaluation of the results of ICP-MS analysis showed that all tested Allium species are suitable for medicinal or nutritional purposes because the toxic metal concentrations (As and Pb) of all Allium species found below the WHO limits for edible plants. However, the Cd concentrations of the ATap, ARap, and ACr were higher in comparison to the limit (300 µg/kg) established by the WHO. The Cr concentration of the AAVap, ASr, ASIap, and ASSap were also higher than the WHO limit (2 mg/kg). These results demonstrate the importance of the dose-controlled use of the stated Allium species. It should be emphasized that Allium species are valuable sources of nutritive elements which should be consumed for recommended daily intakes. PCA and HCA calculations using metal concentrations of the Allium species revealed that there is a relationship between the Allium species based on these parameters. The Allium species were classified into four groups by HCA.
References
Abugassa, I., A. Bashir, K. Doubali, R. Etwir, M. Abu-Enawel, and S. Abugassa. 2008. Characteriza-tion of trace elements in medicinal herbs by instrumental neutron activaCharacteriza-tion analysis. Journal of
Radioanalytical and Nuclear Chemistry 278 (3):559–63.
Ali, M. H. H., and K. M. Al-Qahtani. 2012. Assessment of some heavy metals in vegetables, cereals and fruits in Saudi Arabian markets. Egyptian Journal of Aquatic Research 38:31–37.
Al-Saleh, I. 2000. Selenium status in Saudi Arabia. Journal of Trace Elements in Medicine and Biology 14 (3):154–60.
d’Amato, M., G. Forte, and S. Caroli. 2004. Identification and quantification of major species of arsenic in rice. Journal of AOAC International 87:113–21.
Basgel, S., and S. B. Erdemoglu. 2006. Determination of mineral and trace elements in some medicinal herbs and their infusions consumed in Turkey. Science of the Total Environment 359 (1–3):82–89.
Baytop, T. 1999. Türkiye’ de Bitkilerle Tedavi; Geçmiste ve Bugün, 480. İstanbul: Nobel Tıp Kitapevleri Ltd. Sti.
Bora, T., C. Aksoy, Z. Tunay, and F. Aydin. 2015. Determination of trace elements in illicit spice samples by using ICP-MS. Microchemical Journal 123:179–84.
Brun, L. A., J. Maillet, P. Hinsinger, and M. Pepin. 2001. Evaluation of copper availability to plants in copper-contaminated vineyard soils. Environmental Pollution 111 (2):293–302.
Bvenura, C., and A. J. Afolayan. 2012. Heavy metal contamination of vegetables cultivated in home gardens in the Eastern Cape. South African Journal of Science 108 (9–10):57–62.
Camargo, A. B., S. Resnizky, E. J. Marchevsky, and J. M. Luco. 2010. Use of the Argentinean garlic (Allium sativum L.) germplasm mineral profile for determining geographic origin. Journal of Food
Composition and Analysis 23 (6):586–91.
Chauhan, R. P., and A. Kumar. 2015. Soil to plant transfer of alpha activity in potato plants: impact of phosphate fertilizers. Journal of Environmental Health Science & Engineering 13:45.
Chope, M., M. Szczyglowska, P. Konieczka, and J. Namiesnik. 2016. Methods of selenium supplementation: Bioavailability and determination of selenium compounds. Critical Reviews in
Food Science and Nutrition 56 (1):36–55.
Choudhury, R. P., and A. N. Garg. 2007. Variation in essential, trace and toxic elemental contents in Murraya koenigii - A spice and medicinal herb from different Indian states. Food Chemistry 104 (4):1454–63.
Corzo-Martinez, M., N. Corzo, and M. Villamiel. 2007. Biological properties of onions and garlic.
Trends in Food Science and Technology 18 (12):609–25.
Del Mastro, A. M., A. Londonio, R. J. Rebagliati, M. Pereyra, L. Dawidowski, D. Gomez, and P. Smichowski. 2015. Plasma-based techniques applied to the determination of 17 elements in partitioned top soils. Microchemical Journal 123:224–29.
Diraman, H., and H. Dibeklioglu. 2009. Chemometric Characterization and Classification of Selected Freshwater and Marine Fishes from Turkey Based on their Fatty Acid Profiles. J. Am Oil Chem
Soc. 86:235–46.
Dubale, A. A., B. S. Chandravanshi, and K. F. Gebremariam. 2015. Levels of major and trace metals in the leaves and infusions of Croton Macrostachyus. Bulletin of the Chemical Society of Ethiopia 29 (1):11–26.
Evangelou A. M. 2002. Vanadium in cancer treatment. Critical Reviews in Oncology/Hematology 42:249–65.
Filipiak-Szok, A., M. Kurzawa, M. Cichosz, and E. Szlyk. 2015. Elemental analysis of medicinal herbs and dietary supplements. Analytical Letters 48 (16):2626–38.
Fırat, M. 2015a. Allium gabardaghense (Amaryllidaceae), a new species from Şırnak, Turkey, 15. Van: Weşanên Sîtav.
Fırat, M. 2015b. The ethnobotanical usage of some East Anatolian (Turkey) Allium L. species. Manas
Journal of Agriculture and Life Science MJAL 5 (1):80–86.
Froes, R. E. S., W. B. Neto, M. A. Beinner, C. C. Nascentes, and J. B. B. da Silva. 2014. Determination of inorganic elements in teas using inductively coupled plasma optical emission spectrometry and classification with exploratory analysis. Food Analytical Methods 7 (3):540–46.
Galdon, B. R., R. O. Gonzalez, E. R. Rodriguez, and C. D. Romero 2008. Comparison of mineral and trace element contents in onion cultivars (Allium cepa L.). Journal of the Science of Food and
Agriculture 88 (9):1554–61.
Giacomino, A., O. Abollino, C. Casanova, C. La Gioia, E. Magi, and M. Malandrino. 2015. Determination of the total and bioaccessible contents of essential and potentially toxic elements in ayurvedic formulations purchased from different commercial channels. Microchemical Journal 120:6–17.
Guner, A., S. Aslan, T. Ekim, M. Vural, and M. T. Babaç. (eds.) 2012. Türkiye Bitkiler Listesi
(Damarlı Bitkiler). İstanbul: Nezahat Gökyiğit Botanik Bahçesive Flora Araştırmaları Derneği
yayını.
Hwang, In M., J. S. Yang, S. H. Kim, N. Jamila, N. Khan, K. S. Kim, and H. Y. Seo. 2016. Elemental analysis of sea, rock, and bamboo salts by inductively coupled plasma-optical emission and mass spectrometry. Analytical Letters 49 (17):2807–21
Kalicanin, B., and D. Velimirovic. 2013. The content of lead in herbal drugs and tea samples. Central
European Journal of Biology 8 (2):178–85.
Karadas, C., and D. Kara. 2012. Chemometric approach to evaluate trace metal concentrations in some spices and herbs. Food Chemistry 130 (1):196–202.
Leonard, A., and G. B. Gerber. 1997. Mutagenicity, carcinogenicity and teratogenicity of thallium compounds. Mutation Research 387:47–53
Liu, P., C. N. Wang, X. Y. Song, and Y. N. Wu. 2010. Dietary intake of lead and cadmium by children and adults - Result calculated from dietary recall and available lead/cadmium level in food in ANALYTICAL LETTERS 15
comparison to result from food duplicate diet method. International Journal of Hygiene and
Environmental Health 213 (6):450–57.
Madejon, P., T. Maranon, J. M. Murillo, and B. Robinson. 2004. White poplar (Populus alba) as a biomonitor of trace elements in contaminated riparian forests. Environmental Pollution 132:145–55.
Matos-Reyes, M. N., M. L. Cervera, R. C. Campos, and M. de la Guardia. 2007. Determination of arsenite, arsenate, monomethylarsonic acid, dimethylarsinic acid in cereals by hybride generation atomic fluorescence spectrometry. Spectrochimica Acta Part B 62:1078–82.
Matos-Reyes, M. N., M. L. Cervera, R. C. Campos, and M. de la Guardia. 2010. Total content of As, Sb, Se, Te and Bi in Spanish vegetables, cereals and pulses and estimation of the contribution of these foods to the Mediterranean daily intake of trace elements. Food Chemistry 122 (1):188–94.
Mestek, O., J. Polak, M. Jurıcek, P. Karvankova, R. Koplık, J. Santrucek, and M. Kodıcek. 2007. Trace element distribution and species fractionation in Brassica napus plant. Applied Organometallic
Chemistry 21:468–74.
Milani, R. F., M. A. Morgano, E. S. Saron, F. F. Silva, and S. Cadore. 2015. Evaluation of direct analysis for trace elements in tea and herbal beverages by ICP-MS. Journal of the Brazilian
Chemical Society 26 (6):1211–17.
Negi, J. S., V. K. Bisht, A. K. Bhandari, and R. C. Sundriyal. 2012. Determination of mineral contents of Digitalis purpurea L. and Digitalis lanata Ehrh. Journal of Soil Science and Plant Nutrition 12 (3):463–69.
Nho, E. Y., N. Jamila, N. Khan, Y. M. Dang, G. H. Lee, Y. M. Park, J. Y. Choi, K. S. Kim. 2017. Determination of metals in fruits of cucurbitaceae species from South Korea, to characterize potential effects on human health. Analytical Letters 51 (5):686–701.
Nookabkaew, S., N. Rangkadilok, and J. Satayavivad. 2006. Determination of trace elements in herbal tea products and their infusions consumed in Thailand. Journal of Agricultural and Food
Chemistry 54 (18):6939–44.
Nriagu, J. O. 1998. History, production and uses of thallium. Advances in Environmental Science and
Technology 29:1–6.
Oymak, T., S. Tokalioglu, V. Yilmaz, S. Kartal, and D. Aydin. 2009. Determination of lead and cadmium in food samples by the coprecipitation method. Food Chemistry 113 (4):1314–17. Özçelik, H. 1992. On the herbal cheese from East Anatolia (Turkey). Journal of Economic Botany
(Bronx, NY: New York Botanical Garden) 48:214–17.
Ozyurt, D., B. Goc, B. Demirata, and R. Apak. 2013. Effect of oven and microwave heating on the total antioxidant capacity of dietary onions grown in Turkey. International Journal of Food
Properties 16:3, 536–48.
Pereira, J. B., and K. G. F. Dantas. 2016. Evaluation of inorganic elements in cat’s claw teas using ICP OES and GF AAS. Food Chemistry 196:331–37.
Pytlakowska, K., A. Kita, P. Janoska, M. Polowniak, and V. Kozik. 2012. Multi-element analysis of mineral and trace elements in medicinal herbs and their infusions. Food Chemistry 135 (2):494–501.
Razic, S., A. Onjia, and B. Potkonjak. 2003. Trace elements analysis of Echinacea purpurea-herbal medicinal. Journal of Pharmaceutical and Biomedical Analysis 33:845–50.
Sanz, E., R. Muños-Oliva, and C. Camara. 2005. A rapid and novel alternative to concentional sample treatment for arsenic speciation in rice using enzymatic ultrasonic probe. Analytica
Chimica Acta 535:227–35.
Sharma, R. K., M. Agrawal, and F. Marshall. 2007. Heavy metal contamination of soil and vegetables in suburban areas of Varanasi, India. Ecotoxicology and Environmental Safety 66:258–66. Shen, Y., C. B. Zheng, X. M. Jiang, X. Wu, and X. D. Hou. 2015. Integration of hydride generation
and photochemical vapor generation for multi-element analysis of traditional Chinese medicine by ICP-OES. Microchemical Journal 123:164–9.
Shirshova, T. I., I. V. Beshlei, V. P. Deryagina, N. I. Ryzhova, and N. V. Matistov. 2013. Chemical composition of Allium schoenoprasum leaves and inhibitory effect of their extract on tumor growth in mice. Pharmaceutical Chemistry Journal 46 (11):672–75.
Singh, C. K., J. N. Sahu, K. K. Mahalik, C. R. Mohanty, B. R. Mohan, and B. C. Meikap. 2008. Studies on the removal of Pb(II) from wastewater by activated carbon developed from Tamarind wood activated with sulphuric acid. Journal of Hazardous Materials 153 (1–2):221–28.
Singh, S., M. Zacharias, S. Kalpana, and S. Mishra. 2012. Heavy metals accumulation and distribution pattern in different vegetable crops. Journal of Environmental Chemistry and Ecotoxicology 4 (10):170–7.
Sun, H. W., F. X. Qiao, R. Suo, L. X. Li, and S. X. Liang. 2004. Simultaneous determination of trace arsenic(III), antimony(III), total arsenic and antimony in Chinese medicinal herbs by hydride generation-double channel atomic fluorescence spectrometry. Analytica Chimica Acta 505 (2):255–61.
Szymczycha-Madeja, A., M. Welna, and P. Pohl. 2015. Determination of essential and non-essential elements in green and black teas by FAAS and ICP OES simplified - multivariate classification of different tea products. Microchemical Journal 121:122–29.
Szymczycha-Madeja, A., M. Welna, and W. Zyrnicki. 2013. Multi-element analysis, bioavailability and fractionation of herbal tea products. Journal of the Brazilian Chemical Society 24 (5):777–87. Taha, K. K., M. I. Shmou, M. H. Osman, and M. H. Shayoub. 2013. Soil-plant transfer and
accumu-lation factors for trace elements at the blue and white Niles. Journal of Applied and Industrial
Sciences 1 (2):97–102.
Tarakci, Z., and H. Temiz. 2009. A review of the chemical, biochemical and antimicrobial aspects of Turkish Otlu (herby) cheese. International Journal of Dairy Technology 62 (3):354–60.
Terzioglu, P., S. Yucel, and M. Ozturk. 2017. Application of Box-Behnken design for modeling of lead adsorption onto unmodified and NaCl-modified zeolite NaA obtained from biosilica. Water
Science and Technology 75 (2):358–65.
Tinkov, A. A., O. N. Nemereshina, J. Suliburska, E. R. Gatiatulina, J. Regula, A. A. Nikonorov, and A. V. Skalny. 2016. Comparative analysis of the trace element content of the leaves and roots of three
Plantago species. Biological Trace Element Research 173:225–30.
Tokalioglu, S. 2012. Determination of trace elements in commonly consumed medicinal herbs by ICP-MS and multivariate analysis. Food Chemistry 134 (4):2504–08.
Tozsér, D., T. Magura, and E. Simon. 2017. Heavy metal uptake by plant parts of willow species: A meta-analysis. Journal of Hazardous Materials 336:101–109.
Vassileva, E., and M. Hoenig. 2001. Determination of arsenic in plant samples by inductively coupled plasma atomic emission spectrometry with ultrasonic nebulization: a complex problem.
Spectrochimica Acta Part B-Atomic Spectroscopy 56 (2):223–32.
Vitali, D., I. V. Dragojevic, and B. Sebecic. 2008. Bioaccessibility of Ca, Mg, Mn and Cu from whole grain tea-biscuits: Impact of proteins, phytic acid and polyphenols. Food Chemistry 110 (1):62–68. Voica, C., C. Roba, I. Feher, and D. A. Magdas. 2017. Elemental analysis and metal intake of
Romanian vegetables. Analytical Letters 50 (17):2755–71
Wesolowski, M., and P. Konieczynski. 2003. Thermoanalytical, chemical and principal component analysis of plant drugs. International Journal of Pharmaceutics 262 (1–2):29–37.
World Health Organization. Department of Technical Cooperation for Essential Drugs and Traditional Medicine.. 2007. WHO guidelines for assessing quality of herbal medicines with
reference to contaminants and residues. Geneva: World Health Organization.
Yildiz, E., S. Sacmaci, S. Kartal, and M. Sacmaci. 2016. A new chelating reagent and application for coprecipitation of some metals in food samples by FAAS. Food Chemistry 194:143–14.