Investigation of dual-narrowband plasmonic perfect absorbers at visible frequencies for biosensing
Tam metin
Şekil
![Figure 1.2: A comparison of Surface Plasmon Polariton and Localized Surface Plasmon Resonance [25].](https://thumb-eu.123doks.com/thumbv2/9libnet/5841960.119765/22.918.268.690.175.561/comparison-surface-plasmon-polariton-localized-surface-plasmon-resonance.webp)
![Figure 1.3: Dispersion relation for the free electron gas [1].](https://thumb-eu.123doks.com/thumbv2/9libnet/5841960.119765/25.918.291.655.193.489/figure-dispersion-relation-free-electron-gas.webp)
![Figure 1.5: Dispersion curve of SPP on single metal-dielectric interface [26].](https://thumb-eu.123doks.com/thumbv2/9libnet/5841960.119765/29.918.269.694.531.796/figure-dispersion-curve-spp-single-metal-dielectric-interface.webp)
![Figure 1.7: Broadband PA: Absorption spectra and design of a broadband PA in near-infrared region [34].](https://thumb-eu.123doks.com/thumbv2/9libnet/5841960.119765/33.918.300.656.552.832/figure-broadband-absorption-spectra-design-broadband-infrared-region.webp)
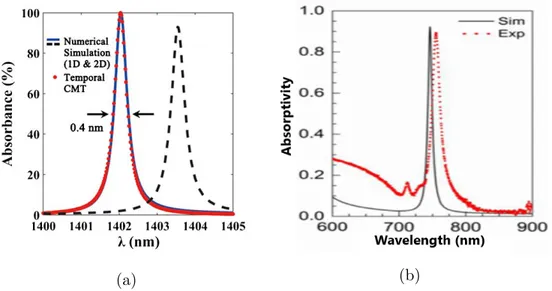
![Figure 1.11: Absorption / Reflection spectra of uni-resonant (a) and multi- multi-resonant (b) Metal-Insulator-Metal (periodic cross-bars) configuration based nar-rowband perfect absorbers [63, 48].](https://thumb-eu.123doks.com/thumbv2/9libnet/5841960.119765/37.918.204.762.285.487/absorption-reflection-resonant-resonant-insulator-periodic-configuration-absorbers.webp)
![Figure 2.2: A Yee cell, showing how field components are solved at various points inside a grid cell [65].](https://thumb-eu.123doks.com/thumbv2/9libnet/5841960.119765/42.918.287.687.629.890/figure-showing-field-components-solved-various-points-inside.webp)
Benzer Belgeler
In the traditional application of the cavity model, it is always assumed that the feeding probe is quite thin, and does not affect the field distribution
Çözücü olarak tetrahidrofuran (THF) ve aseton kullanılarak sentezlenen biyomalzemelerin glutatyon s-transferaz enzim aktivitesi üzerine etkileri spektrofotometrik
There has been controversy about the nature and reactivity of (sub)surface trapped holes (7, 8) but, from the point of view of the oxidative photo- degradation mechanism, TiO 2
(a) The variation of the current passing through the sample under various bias conditions; (b) calculated (IR) drop using the current values at +5 and −5 V, respectively; (c)
The snake fit to the laser data is referred to as C laser from now on in this text. The snakes fitted to the processed UAM data will be referred to as C i , where i denotes the index
This entire activity sequence; the planning of the project, the design management and its realization, the coordination of the project phases after it’s being
Çalışmamız sonucunda hem b500 hem de b800 değerleri için ortalama ADC değerleri malign doku tanısı alan hastalar için, benign doku tanılı hastalardan daha
Similarly, while there was a significant correlation (p=0.026, r=0.352) between the sleep latency reported by the patients themselves after waking up in the morning and the
