Gene expression profiling of granulosa cells from PCOS patients following varying doses of human chorionic gonadotropin
Tam metin
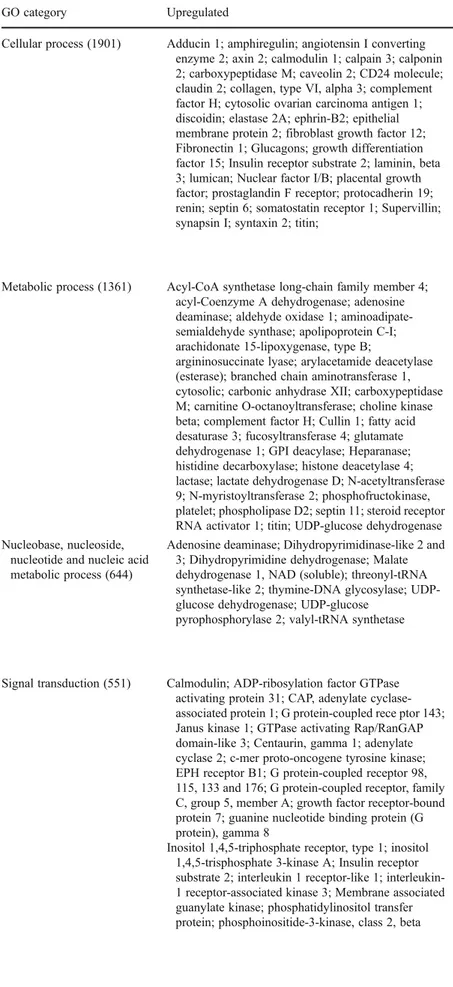
Şekil
Benzer Belgeler
Kıyı boyunca uzanan bu dik merdivenli kentin alt kesimi, yarı beline kadar suyun içine girmiş dua eden binlerce ihsanla ve yakılan ölülerden tüten ağır
Canal Orande e Chlesa della Salute Le Grand Canal ■ Église de la Salute The Grand Canal ■ The Church o f Salute Canal Grande - Kirche della Salute..
Yapay Sinir Ağlarının mevcut olan bu avantajlarından yola çıkarak hazırlanan çalışmamızda Petkim’de üretilmekte olan dört ürüne ilişkin öngörümlemede
lıca öğretim üyelerini yetiştirmiş olan bir mimarlık bölümünü, di ğer taraftan heykel, resim ve de koratif san’atlar alanında memle ket içinde ve
Weniger ve Steinborn Bessel Tipi Orbitalleri (BTO) kullanmış ve B fonksiyonlarından yararlanarak overlap integrali hesaplamışlardır (Weniger ve Steinborn 1983). Çok
2018 宜蘭縣北醫校友聯誼會 宜蘭縣北醫校友會於 2018 年 3 月 11 日,假礁溪山 多利大飯店舉辦 2018
Methods: After rats received a plantar incision surgery, mechanical allodynia and thermal hyperalgesia were determined by von Frey filaments and radiant heat, respectively, and
ML based yield planning could apply in farming dependent on gathered information over IoT network through yield observing associated through GPS. The gathered date
