INSTITUTE OF SOCIAL SCIENCES MSc in FINANCIAL ECONOMICS
DOES FINANCIAL DEVELOPMENT BENEFIT INCOME INEQUALITY? Master Thesis by ÖZCAN DİNLER Thesis Supervisor PhD. ENDER DEMİR İSTANBUL, 2015
ii
ABSTRACT
In this research, it is aimed to examine the relationship between stock market capitalization and income inequality. Income inequality is proxied by Gini coefficient which is retrieved from World Bank Gini estimations data. A panel dataset is employed that contains the yearly basis time-series and cross sectional data for 28 developed and developing countries, including a wide range of control variables, from 1988 to 2012. Weighted Least Squares method (WLS) is applied in panel regressions and then it is found that rising market capitalization is significantly associated with rising income inequalities, where being a developed country has positive effects on the distribution of income. Moreover, it is also shown that foreign direct investments have lowering effects on income disparities, where any increase in real interest rates and unemployment raise inequality.
Key Words: Income inequality, Gini coefficient, stock market capitalization, financial development.
iii
ÖZET
Bu çalışmada temel olarak gelir eşitsizliği ve hisse senedi piyasası büyümesi arasındaki ilişki incelenmiştir. Çalışmada 28 ayrı ülkeye ait yatay veri kesidi ve 1988-2012 yıllarını içeren zaman serileri kullanılarak oluşturulan panel veri seti esas alınmış ve gelir eşitsizliği göstergesi olarak Dünya Bankası hesaplamalarına dayanan Gini katsayısı kullanılmıştır. Panel regresyonlarında, Ağırlıklı En Küçük Kareler (AEK) metodu yardımıyla elde edilen analiz sonuçlarına göre hisse senedi piyasası büyümesi (piyasa değerindeki artış) ile gelir eşitsizliği arasında aynı yönlü doğrusal bir ilişkinin varlığı gözlenmiştir. Kukla değişkenler kullanılarak yapılan analiz sonucuna göre ise sözkonusu ülkenin gelişmiş bir ülke olmasının gelir dağılımı üzerinde olumlu yönde katkı sağladığı anlaşılmıştır. Ayrıca, bir ülkeye giren doğrudan yabancı yatırımlarının gelir eşitsizliğini düşürücü yönde, reel faiz seviyeleri ve işsizlik oranlarının ise artırıcı yönde etki sağladığı görülmüştür.
iv TABLE OF CONTENTS
Abstract... ii
Özet ... iii
List of Tables and Figures... v
I. INTRODUCTION... 1
II. LITERATURE REVIEW... 3
III. FINCANCIAL DEVELOPMENT AND INEQUALITY... 7
IV. DATA AND METHODOLOGY... 10
IV.I. Data ... 10
IV.II. Methodology ... 15
V. FINDINGS AND DISCUSSIONS ... 17
VI. CONCLUSION ... 24
v LIST OF TABLES AND FIGURES
Figure 1. A Scatter Diagram for Gini and Market Capitalization in US …….. 8 Table 1. Summary Statistics ……… 11
Table 2. Weighted Least Squares Estimation Results ………….……… 18 Table 3. Development Dummy Included ………. 21
1 I. INTRODUCTION
“To determine the laws which regulate this distribution [into wages, profits and rent] is the principal problem in Political Economy.” David Ricardo (1817), Preface of Principles of Political Economy
Although income disparities among countries have been declining over the past 20 years as emerging economies have narrowed the gap with developed countries, inequality within many countries has increased worldwide. According to a report delivered by the UNDP (2013), income inequality has risen by 9 percent in developed countries and 11 percent in developing countries between 1990 and 2010. It is also the case that income distribution has been harmed mostly by the patterns of economic growth as integration of developing countries into world trade and financial markets evolved. Meanwhile, there is an accelerating growth in world equity markets, which outperforms real economic growth.
In this paper, we will ask some questions regarding the inequality patterns mentioned above and then try to explain the motives behind of financial development and inequality relationships. Since we have to confine the limits of the study, it is crucial that the inequality approximation and the explanatory stuff shall be determined and theorized deliberately. Here, inequality is represented by Gini coefficient which is based on World Bank Databank income estimations, where financial development is indicated by stock market capitalization. By the way, the income disparity problem is taken into account as the main focus of this study instead of the wealth issues which rather have different economic and social characteristics. In parallel to that, for each country, the market capitalization over GDP ratio is exploited as being a measurable and explanatory indicator for financial progress.
At last, this paper shows that the rising income inequality is associated with the rises in stock market value, where the results differentiate between developed and developing countries. This holds even after other control variables are taken into consideration. It is also shown that any increase in real interest rates raise
2
income inequality shifting saving tendencies of market agents. Consistent with previous findings, foreign direct investments and foreign portfolio equity inflows have lowering effects on income disparities while unemployment and inflation raise inequality.
In the upcoming pages, at first, we will go over the related works done before, then, the detailed information will be presented regarding data and methodology where the related approaches will be argued throughout the paper. Finally, the findings will be presented and discussed in the fifth section.
3 II. LITERATURE REVIEW
Since the inequality issues arise at the same time with the very recent era of globalization, internationalization of trade and the integrity of the financial markets worldwide, the role of financial growth has been started to be questioned in terms of share and distribution of the wealth and income. In the last three decades, there has been a plenty of works which mainly focus on the links between real economic growth, financial progress and inequality. Some have questioned the relation between economic growth and inequality, while some try to find any relevance between financial development and inequality. Clarke, Xu and Zou (2006) find strong evidence for a linear relationship between financial development and income inequality. Beck et al, (2004) revealed that financial development reduces income inequality, improving incomes of the poor. They, in both studies, take private sector credits divided by GDP ratio into account to indicate the financial development. Dollar and Kraay (2002) also found that poverty is reduced by overall economic growth, where the growth benefits ordinary households too.
Levine and Zervos (1998) questioned the relationship between the banking development, stock market development and economic growth in the long run, using data on 41 countries from 1976 to 1993, where they contributed much with empirical findings putting behind the theoretical arguments on the link between financial progress and growth. Their results showed that stock market liquidity is positively and significantly correlated to current and future rates of economic growth, capital accumulation, and productivity improvements, even after controlling for economic, political and other factors. However, there are still controversial results about stock market liquidity whether it encourages firms in productivity or keep investors away from dealing with compelling business projects instead enjoying the trade opportunities in stock markets. While banks provide different financial services from those provided by stock markets, they conclude; to understand the relationship between the financial system and long-run growth more comprehensively, the theories are needed in which both stock
4
markets and banks arise and develop simultaneously while providing different bundles of financial services to the economy.
Specifically, Sawhney and DiPietro (2006) studies on stock market capitalization and the Gini coefficient, considering also income share of the top and bottom quintiles. They find that a higher stock market capitalization ratio raises the Gini coefficient, raises the income share to the upper quintile and lowers share to the bottom quintile. Mathew (2008) also looks for any connection between stock market ratios and income inequality, in her study named “Stock Markets and Income Inequality”. She focuses at stock market activity, size and liquidity using a cross-sectional data set of 68 countries and panel data set of 61 countries from 1975 to 2005. Despite she doesn’t find any strong relationship between stock market liquidity and activity, she claimed that her findings confirm a Kuznet’s inverse-U relationship between stock market size and income inequality.
Zhang (2012), studies stock market and inequality in a reverse direction where she takes P/D ratio (to represent market price level) as dependent and Gini coefficient as independent variable. It is predicted that the rate of return on stocks in a highly unequal society would be higher due to a lower rate of market participation. She finds an inverse relationship between excess returns and income inequality and reports that a 0.01 point increase in Gini coefficient is associated with a decrease in market P/D ratio by up to 2%. Then she asserts that this holds stronger for developed countries rather than in developing countries. However, consideration of P/D ratio as a proxy for stock market surplus may not work well in the sense that dividend payment policies and implications differ across and between the developed and developing countries. Alternatively, Beck and Levine (2004), take the Turnover Ratio as a measure of market liquidity to measure stock market development.1
Similarly, Nguyen (2013) studies on income inequality as a fundamental source of risk that affect stock prices, by observing the stocks of NASDAQ, NYSE and Amex through 25 different portfolios, in the U.S. from 1927 to 2012. He studied
1 Turnover ratio equals the value of the traded shares (trading volume) on domestic exchanges
5
the inequality beta coefficient and the inequality risk premium, by utilizing the Fama-French three-factor model. His findings suggest the existence of a weak relationship between income inequality and the rate of market participation/liquidity, which ultimately may influence the rate of return on stocks. He concludes that this holds only for portfolios of small companies. However, his work lacks to capture a significant relevance between income inequality and stock returns where it is too narrow to look only at US stock markets which have quite unique characteristics in terms of income distribution, participation rates and market liquidity.
Furthermore, an interesting and multi-focus work was delivered by Favilukis (2012) where he examines a variety of parameters by implementing some theoretical models with supporting real data observations in US and UK mutually. He questions and tries to explain the relationships among a range of variables such as wealth inequality, stock market participation, consumption inequality, households indebtness and expected equity premium. He employs all these variables in his model with considering the rising trends in wage inequality, loosening of borrowing constraints and lowering participation costs. Rethinking also the household heterogeneity and stock market moves, his model shows that stock returns are positively correlated with changes in inequality because stock market participants are on average richer and benefit disproportionately from a stock market boom. Finally, his research has revealed that stock market played a major role in increasing wealth inequality. But, despite the theoretical power of his general equilibrium model and elaboration of many counterfactual results, he uses very limited actual data to retrieve concrete empirical findings. Additionally, his evidences are very specific to US and UK, where the financial and labor market implications much differ from rest of the world.
Evidently, as an outcome of stock market boom in last three decades, there is a raising interest on stock markets and inequality matters since early 2000s (Banks et al, 2000; Piketty and Saez, 2003). However, even different aspects of stock market capitalization are observed in previous studies, it is mostly focused on
6
more developed markets like US and UK rather than emerging markets where the situations are evolving as emerging stock markets are liberalized. Additionally, it makes sense to consider income inequality as the main focus instead of wealth inequality, provided that stock market appreciation raises the incomes (i.e., trading profit or dividend income) of stockholder households more than non-stockholder households (Zietz and Zhao, 2008). It is important to note that, wealth is usually a longer term phenomenon and even in case of a stock market participant it may rather attribute to another kind of ownership such as land, farm, fortune etc.
7
III. FINANCIAL DEVELOPMENT AND INEQUALITY
"If you want to be perfect, go sell your possessions and give to the poor, and you will have treasure in heaven.” (Matthew 19-21, Holy Bible)
In this section the focus will be on the link between financial development and income inequality. Thereafter, it will be rationalized that why stock market value is took into consideration instead of banking or credit growth to represent financial development.
Although the world economy is expanding every passing moment, beating also the population growth, the accretion in financial markets outperforms that. According to the World Bank Databank, the world real GDP has almost tripled since 1990s and accounted $75,592 billion as of 2013 year end. Whereas, the world stock market capitalization has reached its peaks approximately to $55 trillion as of 2012 year end, which is 10 times higher than as it was in the early 80s according to Paris based World Federation of Exchanges release. Explicitly, this sky-rocketing trend of soar in equity markets indicates a deep asymmetry between the real economic growth and financial development (surplus in size), which already start to challenge the established principles of macroeconomics, social economics or economic history as well. Although, it is much proved that economic growth benefits to the poor in longer term (Dollar and Kraay, 2002; Dollar et al. 2013), the findings about financial development and inequality are much controversial.
An inspiring work is delivered by Piketty (2014) regarding increasing surplus on capital and rising trends in inequality. In his very sounding book named “Capital in the 21st Century”, he questions the problem of distribution for the last two centuries, where he claims that “when the rate of return on capital exceeds the rate of economic growth, inequality tends to rise”. He links that to the tendency of faster augmentation of profits and wealth from capital rather than any increase in wage income which most people rely on. Then, he points that out “...setting aside the period from the late nineteenth century to the early twenty-first century, which is roughly what is called modernity, the real economic growth rate has
8
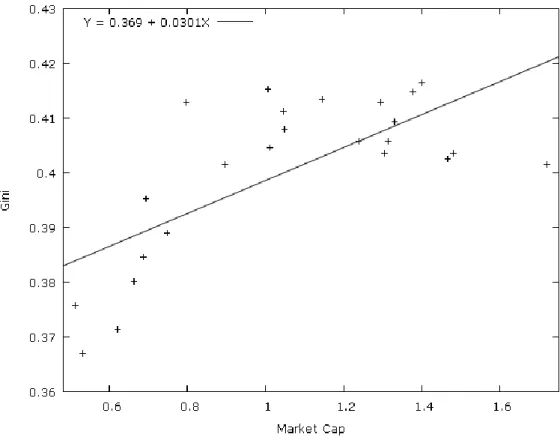
been below the rate of return, implying steadily rising inequality”. As Piketty argues this phenomenon for the last two centuries, more strikingly it seems that the excess rate of return (in this paper it refers stock market capitalization) has gained greater momentum in the last two decades. Mullin (1993, p.72) notes that; “It probably took eighty-five years (1810-1895) for the US capitalization ratio to rise from 7% to 71%, whilst the Taiwanese ratio rose from 11% to 74% in just ten years (1981-1991)”. Figures also show an upward parallel trend for Gini and Market Capitalization development levels in US between the years 1988-2011 (please see below Figure 1 for the relationship on a scatter diagram).
Figure 1. Gini vs. Market Cap in the United States (1988-2011)
In general terms, one should be aware of that “income inequality” is not just a pure product of “wage” discrepancies but an outcome of many other social, financial and economic policies as well. Thus, it does matter as questions arise such that “what about the distribution of this affluence?”, “who does gain from all these and who doesn’t?” or what about, as Milanovic (2011) puts, “The Haves and the Have-Nots”. Meanwhile, the figures show that 85 richest people
9
in the world have the same wealth as the 3.5 billion poorest people according to Oxfam report release (2014). Literally, beyond the basic question of “why stock markets grew that much”, throughout the paper it is aimed to examine whether there is -causal or not- a relationship between the financial development and income inequality.
The term “financial development” is also debatable in itself since banks provide different financial services from those provided by stock market. Meanwhile, their interaction of the poor, in case of promoting equality among society, broadly differs that almost everyone can benefit from credit markets somehow but the stock market participation of the poor is much controversial.
Moreover, it is unlikely possible to measure an exact wellness for banking sector in terms of capturing the financial depth, advancement and reachability. For example, in previous studies a variety of proxies has been used for banking development like overall size of the banking sector (Goldsmith, 1969) or the value of broad money (M2). In the same way, Levine and Zervos (1998) use the value of loans made by banks divided by GDP, which is also just a limited proxy and not wholly able to explain all the phenomena regarding the levels of banking development. They point out that “besides the historical focus on banking sector there is an expanding theoretical literature on the links between stock markets and long-run growth, but very little empirical evidence”. Sure, this was the case for the 90s, but very recent stock market booms seem to attract many researchers interest as mentioned above in Part II.
All in all, excluding but not ignoring banking sector, our data set consist of a further stage of financial development in terms of financial markets synchronization and integrity (banking & exchange markets) almost for all countries observed.
10 IV.
DATA AND METHODOLOGY
IV.I. Data
This study examines the impact of stock market development on income inequality which is represented by Gini coefficient. A panel technique is implemented to reveal the relationship between income inequalities and stock market size with taking into account other instrumental and control variables. Thus, utilizing panel data instead of pure cross-sectional data allows us to benefit the time-series dimension of the data and deal with simultaneity (Beck and Levine, 2004).
The panel dataset contains the yearly basis time-series and cross sectional data for 28 developed and developing countries, including a wide range of control and instrumental variables, between the years 1988 and 2012.2 Those variables are unemployment rates, real interest rates, carbon emissions levels (metric tons per capita), inflation rates (CPI), internet availability ratio, GDP per capita, Foreign Portfolio Equity and Foreign Direct Investment to GDP ratios. All the data is retrieved from World Bank Databank on yearly basis and the country selection is based on the most available data on the site.
Time series interval (1988-2012) is considered to be unique in terms of capturing the direct or indirect effects of financial advancement, the degree of market openness and integrity across the earth, the while, it happened both growths and contractions at the same interval of time such as dot-com bubble at late 90s and global financial crisis in 2008.
Although, Mathew (2008) also focuses on stock market size effects on inequality by utilizing same data sources for Gini and Market capitalization ratio as in this paper, our study differentiates in terms of selected countries, input variables and methodology. Differently, here we used one year lagged Gini variables as the
2
The list of countries included in this study : Argentina,Brazil, Canada, Chile, China, Colombia, Denmark, Finland, Germany, Indonesia, Israel, Italy, Jamaica, Jordan, Malaysia, Mexico, Netherlands, Norway, Pakistan, Peru, Philippines, South Africa, Spain, Thailand, Turkey, United Kingdom, United States,Venezuela.
11
proxy for inequality where it is benefited from Weighted Least Squares estimations with a more update time-series data in the pooled regressions.
Specifically, both in longitudinal and cross sectional directions, the stock market value to GDP ratio spreads in a wide range, whereas the Gini coefficient always takes values between 0 and 1. Mainly, in our dataset, market capitalization to GDP ratio ranges from 0.01% to 329% and Gini coefficient ranges between 0.23 (Finland, 1992) and 0.69 ( Jamaica, 2001) and averages at 0.41 (see Table 1 for descriptive statistics). Therefore, heterogeneity factors would matter among the variables and also countries, which is cared in the WLS pooled regression and will be explained in details in the section IV.II. .
IV.I.I. Market Capitalization
Market capitalization, which is also called market value, is share price times the number of shares outstanding in an exchange market.3 Finance professionals,
3 Market capitalization of listed companies (% of GDP): Market capitalization (also known as
market value) is the share price times the number of shares outstanding. Listed domestic companies are the domestically incorporated companies listed on the country's stock exchanges at the end of the year. Listed companies do not include investment companies, mutual funds, or other collective investment vehicles.
http://data.worldbank.org/indicator/CM.MKT.LCAP.GD.ZS
Table 1 Summary Statistics
Variable Mean Median Minimum Maximum Std. Dev.
Gini 0.41 0.40 0.23 0.69 0.10 MarketCap 0.60 0.44 0.00 3.29 0.53 Carbon_Emission 0.06 0.05 0.01 0.20 0.05 GDPperCap 0.06 0.06 -0.98 0.74 0.13 CPI (Inflation) 0.43 0.04 -0.02 74.82 3.68 Unemployment 0.09 0.08 -0.12 0.41 0.06 Internet 0.22 0.09 0.05 0.98 0.27 FDI to GDP 0.03 0.02 -0.04 0.24 0.03 PortfolioEquity 0.01 0.01 -0.20 0.16 0.03 Real_Interest Rates 0.07 0.05 -0.60 0.79 0.11
12
also use this ratio in assessing stock valuations that a ratio greater than 100% tells that stock market is overvalued or on the contrary a respectively smaller ratio might tell that the market is undervalued. The motivation behind this approach is the efficient-market hypothesis (EMH) as being the cornerstone of modern financial theory which asserts that stock prices always trade at their fair value so that financial markets would be adjusted to their correct levels at the end of the day. However, the accurate level of overvalued/undervalued market is highly debatable where the ratio ranges from 5% to above 300% according to 2012 figures among our selected data for 28 countries.
(1)
Moreover, historically increasing ratio of Market capitalization might tell that there is an accumulation of wealth into the stock markets which surpass to the real economy in terms of accelerating growth rates. Actually, there would be many explanations over this; first, companies are growing by increase in demand and revenues beyond the country limits which is called globalization as the popular term. Second, there are always new entries (companies which later quote to the stock markets) as the economic system evolves and advances. Third, as an outcome of unequal distribution of wealth, the capital which belongs to the firms or wealthier parts of the society is crowded up in the financial system for investment purposes so that the stock markets expand much more. Yet the first two are intrinsic to the evolution of the financial system, the third one has counterfactual evidences. Therefore, in this paper, it will be hypothesized that by each additional capital which deposited in stocks may bear excess returns to the stock holders and raise the income gap between richer investors and non-stock participants.
IV.I.II. Gini
Gini index is a robust indicator to rely on and is used for inequality measurements in various ways either for consumption, wealth or income. However, different sources might deliver inexact results for the same output depending on the calculation details such as inclusion/exclusion of taxation,
13
transfer payments or social assistance etc.4 In this paper it is preferred to accept World Bank calculations as the basis, where country selection for this study is done looking after the availability of Gini data and then missed years are filled by averaging or trending the years between.
It can be extracted from the data that Gini walks mostly with small changes in magnitude year to year, but it should be noticed that very small dispersions in results may indicate important shifts across income groups by the time. For example, Gini equivalent has increased from 0.28 to 0.31 in German, from 0.35 to 0.38 in UK, from 0.30 to 0.43 in China whereas it has decreased from 0.42 to 0.40 in Turkey and from 0.58 to 0.51 in Chile between 1988 and 2012. Accordingly, trends in income inequality are reversible, where several countries have experienced shifts from increasing to decreasing income inequality or vice versa. Meanwhile, stock market capitalization to GDP ratio has jumped from 19% to 43% in German, 90% to 122% in UK, from below 1% to 45% in China and from 1.25% to 39% in Turkey, from 28% to 118% in Chile. For the same time interval, the average market capitalization to GDP ratio has almost tripled from 25% to 70% and the average Gini coefficient has increased by 0.46% (0.0046), according to our dataset.
IV.I.III. Unemployment
Considering the inequality by Gini terms, it gives that the lowest income quintile of the society should be highly associated with unemployment and lower wages. Unemployment, first intrinsically by itself as a risk factor and then leading to labor force surplus, keeps workers to obey the lower wages. In their study named as “Inequality and Unemployment in a Global Economy”, Helpman et al, (2009) revealed that workers face income risk because of unemployment and wage
4 GINI index (World Bank estimate): Gini index measures the extent to which the distribution of
income or consumption expenditure among individuals or households within an economy deviates from a perfectly equal distribution. A Lorenz curve plots the cumulative percentages of total income received against the cumulative number of recipients, starting with the poorest individual or household. The Gini index measures the area between the Lorenz curve and a hypothetical line of absolute equality, expressed as a percentage of the maximum area under the line. Thus a Gini index of 0 represents perfect equality, while an index of 100 implies perfect inequality. World Bank, Development Research Group. Data are based on primary household survey data obtained from government statistical agencies and World Bank country departments. http://data.worldbank.org/indicator/SI.POV.GINI
14
dispersion across firms. Thus, higher unemployment rate in a country should increase Gini coefficient, just recall arithmetic’s, so that it must be controlled as an independent variable in the regression, where several studies show that inequality and unemployment are endogenous.
Additionally, due to the strong link between labor markets and the level of productivity which determines output, unemployment rates are negatively correlated with economic growth. While, Okun's law predicts that, to achieve a 1 percentage point decline in the unemployment rate in the course of a year, real GDP must grow approximately 2 percentage points faster than the rate of growth of potential GDP over that period. Consequently, inclusion of the yearly basis unemployment rates (for all the countries in our dataset from 1991 to 2011) enables us to keep control also for business cycles like recessions or economic booms, either.
IV.I.IV. Foreign Portfolio Equity
After a decade of financial liberalization across the world in 1980s, emerging markets face with huge inflows of foreign equity into their domestic stock markets. By the way, between 1989 and 2012 total amount of foreign portfolio raised about 10 times worldwide. However, given that stock market capitalization also enlarged that much in the same period, net foreign portfolio equity to market capitalization ratio deeply fluctuates between these periods.5 Then, it seems to be much effected by economic booms and financial crises, where it turns to be negative (so, a foreign portfolio outflow!) in or after the years of depression.
Unlike the Foreign Direct Investments, Foreign Portfolio Inflows move in seeks of the short term profit and bears volatility in the markets with temporary ups and downs, where the investors have to realize the gain at the end of the day. Besides, it always attracts domestic investors too and contributes to the surge in
5
Portfolio equity, net inflows (BoP, current US$) :Portfolio equity includes net inflows from
equity securities other than those recorded as direct investment and including shares, stocks, depository receipts (American or global), and direct purchases of shares in local stock markets by foreign investors. Data are in current U.S. dollars.
15
equity markets in a very short while. Likewise, El-Erian and Kumar (1995) has noted "when compared to other episodes of large private capital flows to developing countries in the last 20 years, the [present] phenomenon differs in one basic respect: the dominant role of foreign portfolio flows as opposed to bank financing". Based on these facts, it can be drawn that “hot money” has adverse effects on the domestic systems; where it first encourage firms by boosting stock prices and injecting liquidity, then it deteriorates investor and shareholder sentiments and may harm the business environments (which used to be dependent on those flows) with sudden withdraws. In the last analysis, it is important to bring out exactly that which party or parties benefit from all these trade. Thus, it is presumed that individual domestic investors are not the probable winners who belong to the lowest level of informational hierarchy in the financial world.
IV.I.V. Interest Rates
As discussed in previous parts, financial development represents both the advancements in banking sector and also in equity markets where both of two are interlinked that banks also provide financial services to investors and companies. Simultaneously, both of two affect and are affected by the saving decisions through interest rate levels, where Zhang (2012) found that real interest rates are significantly negatively related to net saving rates. Therefore, it is crucial to consider real interest rates in order to link the saving tendencies to the stock market moves interchangeably with credit markets.
IV.II. Methodology
Briefly, in this study it is aimed to examine the relationship between financial development instruments and inequality, empirically. Pooled regression techniques are employed to find any relevance between panel variables that mentioned in previous parts. Meanwhile, in order to catch consistency and heterogeneity issues Weighted Least Squares method has been applied as a special kind of generalized least squares method which is considered to deliver more unbiased and efficient findings compared to Ordinary Least Squares, that
16
WLS takes care of heteroscedasticity (Sosa-Escudero, 2009). Therefore, in the design and selection of panel variables it is aimed to minimize endogeneity and simultaneity factors where we benefit from previous studies to enhance the instrumentalization of explanatory variables. All in all, the primary aim of this study is to ensure that it would capture and deliver robust findings as much as possible whatever the results will be.
The regression equation is as below:
(2)
Where, is for one year lagged Gini coefficient, is the vector of control variables, is for market capitalization and , are the country-specific, time-specificeffects and error term, respectively.
As it is mentioned above, Weighted Least Squares method is a special case of generalized least squares which is applied in the case that if the error variance may be non-constant across observations (Cottrell and Lucchetti, 2015). So, by taking WLS into account, it becomes possible to take care of covariance structure of the error term, while in OLS it is just an assumption that the error term is independently and identically distributed. It is also implemented to get more efficient and unbiased estimations for β and a suitable estimator for variances; where OLS is still unbiased though not that efficient (McManus, 2011).
In our case, it is considered that WLS would prevent the larger capitalization to have a greater contribution to the Gini estimates rather than smaller values of capitalization, since it pays more attention to the observations with smaller variances by the help of weighted error minimizations (Sosa-Escudero, 2009). Therefore, it may be the case to grasp the effects of stock market surges over the distribution of the income in a much convenient way.
17
V.
FINDINGS AND DISCUSSIONS
“All science would be superfluous if the outward appearance and the essence of things directly coincided.”
Marx (1894), Capital, Volume III The regression estimations are presented in Tables 2 and 3. It is found that there is a positive and statistically significant relationship between the stock market capitalization and income inequality according to WLS estimations.6 The results show that one percent increase in Market Capitalization raises Gini by 0.02 points (Table 2).
Market capitalization seems to raise inequality according to the estimation results even after controlling other instrumental and explanatory input variables. Consistently, it gets statistically significant results at the highest levels in each pooled model where related coefficients range between 0.01 and 0.05 in all models in Tables 2 and 3, all with positive signs.
This finding is also in line with previous studies where the transmission mechanism between stock market surplus and inequality reserves sophisticated contents. For instance, as a result of the unequal distribution of wealth, the excess capital which belongs to the richest part of society may be invested in stocks rather than business, so that stock prices soar. Whereas, at the next phase, as stock markets surpass the real economic growth then the richest get richer and inequality rises. However, the first explanation may fail in the case that the same result could be delivered in a more equal society depending on alternative investment opportunities or the soar in stock prices may be driven just by foreign capital inflows. Indeed, all these would be the occasional outcomes. However, we assert that the inverse relationship should be taken into account, provided that inequality especially tends to rise in a booming market.
6
Actually, fixed and random effects regressions are also employed and consistent results are observed. The regression outputs are not presented in the paper but will be shown upon request.
18
Note: t values are presented in second rows. In panel results, *** indicates 1%, ** 5% and * 10% significance levels, respectively.
Dependent Variable: Variables 1 2 3 4 5 6 Mcap 0.01 *** 0.02 *** 0.02 *** 0.01 *** 0.04 *** 0.05 *** [2.83] [4.53] [4.33] [2.81] [7.25] [8.26] Interest Rates 0.29 *** 0.29 *** 0.33 *** 0.25 *** 0.28 *** [12.08] [11.95] [14.42] [13.12] [17.27] Unemployment 0.29 *** 0.30 *** 0.35 *** 0.54 *** 0.46 *** [5.17] [5.26] [5.56] [9.12] [7.09] FDI to GDP 0.09 -0.04 -0.01 -0.07 [0.96] [-0.42] [-0.05] [-0.74]
Port Eq / Market Cap -0.05 -0.03 -0.09
[-0.39] [-0.36] [-0.89] Carbon Emission -0.92 *** -0.87 *** [-20.78] [-19.04] Inflation 0.25 *** [4.03] Internet 0.0002 [1.55] GPD p CAP 0.01 [0.33] # Observations 672 502 502 435 416 397 R square 0.01 0.26 0.27 0.37 0.68 0.76 Adjusted R square 0.01 0.26 0.26 0.37 0.68 0.75
All the data in the panels is retrieved from World Bank Databank. Mcap denotes Market Capitalization to GDP ratio. Unemployment rates, real interest rates, carbon emissions levels (metric tons per capita), inflation rates (CPI), internet availability ratios are in their initial percentage values. GDP p CAP denotes logged GDP per capita values between years. Port Eq / Market Cap means Net Portfolio Equity inflows divided by domestic Stock Market Capitalization values for each country. FDI to GDP represents Foreign Direct Investments divided by average GDP values for the related countries.
Table 2 Weighted Least Squares (WLS) Estimation Results
19
Besides, the explanations get tougher as the market participation levels and consecutive moves considered. For example, Favilukis (2012) at first presumes that increased participation would cause a fall in participation costs and so in wealth inequality. That is to say, after a period of adjustment, more people would participate in stock markets beating fixed entry costs and sharing the risk premium. This would also lower the inequality or in a more equal society the stock market participation rates tend to increase, so that stock prices soar as well. Even in those cases it is not that easy to estimate the market direction where it can go up due to higher participations with higher bids or may go down due to diminishing rates of returns for the richer households after a while. All in all, results show that either in his model, there is a linear relationship between stock returns and inequality. Considering all the parameters, it is clear that stock market participation is an output of wealth issues and market advancements beside the perception of the financial risk in a country. Then, we are agreed that stock market participants are on average richer and benefit disproportionately from a stock market boom.
Arguably, Mathew (2008) also asserts that because of lower equity premiums and the greater participation by the middle-class, the gains to the rich start declining and the gap between these income groups falls as the stock market reaches a certain size. This explanation seems to be unlikely hold in the real world that participation rates for the local investors in domestic stock markets are still very low all around the world even in after 2000s. As the stock market participation is a product of risk taking attitudes derived from many other structural economic and social dynamics, wide dispersions can be observed among the countries worldwide. For instance, the domestic participation ratio exceeds 25 per cent only for a few developed countries like US and UK, while it is below even ten per cent in some developed and relatively income-equal countries like Germany and Italy according to the dataset of Giannetti and Koskinen (2010). Accordingly, the inequality tendencies, in terms of Gini levels, do not confirm participation rates exactly and indicate the reverse in many cases like in Belgium and Austria. By the way, it should be noted that to suggest a
20
causal relationship between two variables just based on theoretical arguments would be misleading, since there would be many other market dynamics working behind for each case. Therefore, it may be ideal to focus on most likely cases that realized and have remarkable effects on distribution trends.
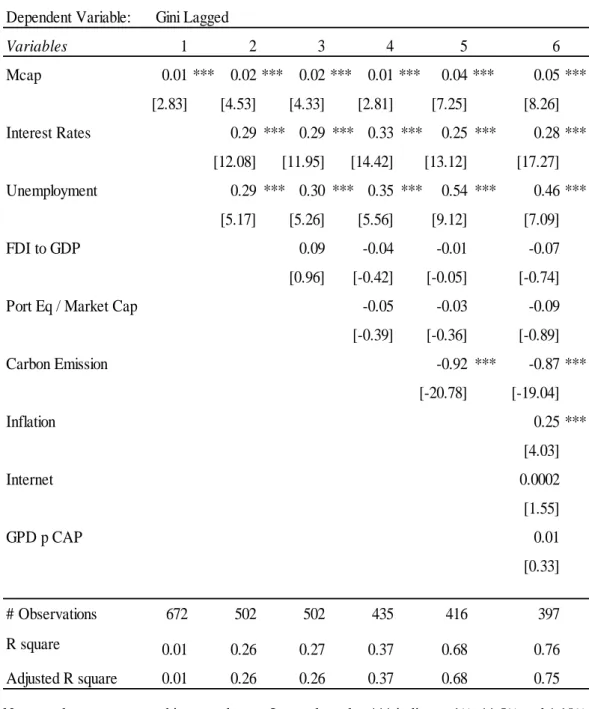
Those explanations are also consistent to Zhang’s (2012) findings over the links between income inequalities and stock market threshold fees (so that, equity premium), where her explanations differ between developed and developing countries. Thus, either in this paper, in order to differentiate the results for developing and developed countries, a dummy variable is added into the model. It is found that Gini coefficient is decreased by greater than 0.12 units if it is a developed country (Table 3). So, it can be drawn that an inverse relationship exists for developed countries, where being a developed country has positive outcomes in terms of income inequality. This finding is substantial in the sense that a surge in stock market value in a developed country is probably an outcome of rising market participation or flourishing economy, while in a developing country it is mostly driven by temporary foreign portfolio inflows as well as other financial dynamics due to economic and political instability. In the panel data, country dummies for developed countries are equal to 1 and for others it is 0 (null).7
Thereafter, other control variables are exploited in the regression in order to capture more detailed explanations and deepen the analysis. First, independent variables such as unemployment rates and real interest rates are run beside market capitalization in a pooled regression (Model 2, Table 2). This first set of independent variables is taken into account in order to show the effect of borrowing constraints on saving decisions and income effects of non-paid groups, with also considering endogeneity issues.
7
The list of developed countries is taken from FTSE Annual Country Classification Review as of September, 2014 and also checked with the latest developed market coverage list of MSCI Country Classification Standard. According to both classifications, our dataset splits into 11 developed and 17 non-developed countries.
21
Note: t values are presented in second rows. In panel results, *** indicates 1%, ** 5% and * 10% significance levels, respectively.
It is found that, any increase in unemployment and in real interest rates raises income inequality significantly. This holds for our assumption that unemployment would raise income inequality since the lowest quintile of the society consist of non-income individuals or households. Similarly, raising real interest rates would alter saving decisions that higher yields attract wealthier people to invest money in financial markets rather than investing for business purposes. So, this may lead to a downturn in credit markets and in GDP growth which also raises unemployment.
Table 3 Variables 1 2 3 4 Mcap 0.04 *** 0.04 *** 0.03 *** 0.04 *** [8.01] [9.5] [5.34] [8.03] Interest Rates 0.22 *** 0.24 *** 0.24 *** 0.23 *** [14.1] [15.9] [18.0] [12.8] Unemployment 0.43 *** 0.37 *** 0.50 *** 0.48 *** [12.8] [11.3] [4.22] [13.6] FDI to GDP -0.22 *** -0.24 *** -0.11 -0.22 *** [-2.96] [-3.29] [-1.61] [-3.11]
Port Eq / Market Cap. -0.03 -0.09 -0.04 -0.05
[-0.39] [-1.26] [-0.68] [-0.79] Carbon Emission 0.59 *** [10.31] Inflation 0.15 *** 0.11 *** 0.15 *** [3.22] [2.66] [3.29] Internet 0.0003 *** [3.64] Developed dummy -0.13 *** -0.12 *** -0.17 *** -0.13 *** [-34.6] [-31.1] [-30.89] [-32.61] # Observations 435 419 400 405 R square 0.81 0.83 0.88 0.83 Adjusted R square 0.81 0.82 0.87 0.83
All variable specifications are same as in Table 2. Developed Dummy controls for market development levels in the WLS estimation. Unit dummies for developed countries are equal to 1 and for others it is 0 (null).
22
Beyond the discussions over the effect of within-country inequalities and market participation gap, it is also needed to observe international dynamics like foreign business investments and short-term money inflows (outflows) between countries. Therefore, FDI variable is included into the regressions (Models 3-6 in Table 2) and it shows a negative relationship with inequality while it gets significant results only after inclusion of development dummies. This result is contrary to the Zhang’s findings that it has an increasing effect on inequality (2012). Similar to that, inclusion of net portfolio inflows to the regression gives no significant result,despite it provides a higher R square with a negative slop in Model 4, Table 2.
Furthermore, adding other input variables to the regression such as GDP per capita, CPI and carbon emissions level ratios, leads a higher R square where MCap effect remains still significant. CPI (inflation) values seem to have an increasing effect on inequality and get significant results in the estimations. Since carbon emission and internet availability ratios may be substitutes in terms of assessing the level of advancement, they are observed interchangeably in the regressions.
According to the estimation results, internet availability shows a positive direction with inequality by insignificant contributions while carbon emission figures indicate the the reverse. Carbon emission values show a negative correlation with inequality, but when development dummy is included to the regressions its sign turns to be positive (Tables 2 and 3). It is also observed that, carbon emissions trends show less variability within the countries in the last two decades where the historical gap between developed and developing countries remain nearly the same. Thus, being so time invariant it serves pretty much as a robust development index for cross-sectional analysis too. In case of internet, it is important to address that at initial phases inequality rises when very few people have access of it but subsequently inequality tends to fall as more people enabled to access and get favor of it (Barro, 2000). Just in early 90s internet access was available only for a richer minority of a number of countries, whilst it spreads throughout the world by 2000s and currently reaches above 90 per cent
23
for developed and nearly a half per cent for developing countries. Meanwhile, there is a substantial parallelism between the financial development and common usage of internet where financial sector benefits from the boost in online media and internet technologies like electronic trading platforms and digital banking facilities. However, despite great advances in finance, it seems that internet has no contribution in terms of lowering the inequality but still has some room for improvement.
Besides, as it is noted in Poverty Reduction report of UNDP (2013) that greater income inequality between households is systematically associated with greater inequality in income outcomes. Needless to say that what are these non-income outcomes (equity, land, fortune etc.), it is important to note that non-income inequality ratios recover after inclusion of social benefits like subsidized housing, medical care, education. So, due to the same reason, government effect is excluded in this study. Moreover, it is too hard to value all these informal benefits and take into the calculations, where those kinds of supplements lack sustainability because of usually being at the disposal of political authorities. Schneider et al. (2010), report that about 31% of world's GDP is informal, especially in underdeveloped world, according to their study over 162 countries.
24 VI. CONCLUSION
This paper shows that one percentage point rise in stock market value to GDP ratio is associated with 0.02 points increase in Gini Coefficient. Then, after inclusion of market development dummies it is observed that being a developed country has positive effects on income distribution. It is also found that raising real interest rates has negative outcomes in terms of income distribution, where saving decisions and credit markets are much effected by interest rate levels. Consistent with our presumptions, foreign direct investments and foreign portfolio equity have lowering effects on income disparities while no significant results are reserved for the latter. Interestingly, internet availability shows similar directions with inequality trends. It is may be due to the fact that internet enables richer man to invest money in financial markets more comfortably rather than to invest in business and thereby create employment. Consistently, the results indicate that unemployment and inflation raise inequality.
Beyond this study, it would be remarkable if anyone shall study the results and effects of very recent expansionary monetary policies on saving decisions and inequality patterns. Since, at present, it is the case that world equity markets live great surges contrary to much lower real economic growth levels, where the interest rates are at historical lowest levels close to zero in many developed countries.
25 REFERENCES
Banks, J., R. Blundell, J. P. Smith, 2000. Wealth Inequality in the United States and Great Britain. Institute for Fiscal Studies and University College, London. Barro, R.J., 2000. Inequality and Growth in a Panel of Countries. Journal of Economic Growth, 5, 5–32
Beck, T., A. Demirguc.-Kunt, and R. Levine, 2004. Finance, Inequality, and Poverty: Cross-Country Evidence. NBER Working Paper, No. 10979.
Clarke, G., L. Xu and H. Zou, 2006. Finance and Income Inequality: What Do the Data Tell Us? Southern Economic Journal, 72(3), 578-596
Cottrell, A. and R.J. Lucchetti, 2015. Gnu Regression, Econometrics and Time-series Library. Gretl User’s Guide.
Dollar, D. and A. Kraay, 2002. Growth is Good for the Poor. Journal of Economic Growth, 7, 195-225.
Dollar, D., T. Kleineberg, A. Kraay, 2013. Growth still is good for the poor. LIS Working Paper Series, No. 596.
El-Erian, M. and M. Kumar,1995. Emerging Equity Markets in Middle Eastern Countries. International Monetary Fund, Work Papers.
Favilukis, J., 2012. Inequality, Stock Market Participation and the Equity Premium. The Financial Markets Group at London Schools of Economics, FMG Discussion Papers.
FTSE, 2014. Global Equity Index Series Country Classification. FTSE Annual Country Classification Review.
Giannetti, M. and Y. Koskinen, 2010. Investor Protection, Equity Returns, and Financial Globalization. Journal of Financial and Quantitative Analysis, 45(1), 135–168
26
Goldsmith, R.W., 1969. Financial structure and development. New Haven, CT: Yale University Press.
Helpman, E., O.Itskhoki, S. Redding, 2009. Inequality and Unemployment in a Global Economy. CEP Discussion Paper, No. 940.
Levine, R. and S. Zervos, 1998. Stock Markets, Banks, and Economic Growth. The American Economic Review. 88(3), 537-558.
Mathew, E., 2008. Stock Markets and Income Inequality:A Cross-Country Study. Dissertations and Theses Collection. Singapur Management University.
McManus, P., A. 2011. Introduction to Regression Models for Panel Data Analysis. Indiana University Workshop in Methods.
Milanovic, B., 2011. The Haves and the Have-Nots. A Brief and Idiosyncratic History of Global Inequality, New York, Basic Books.
MSCI, 2014. Country Coverage List. MSCI Country Classification Standard Guideline.
Mullin, J. 1993. Emerging equity markets in the global economy. FRBNY Quarterly Review, Summer, 54-83.
Nguyen, M.T., 2013. Income Inequality and Stock Pricing in the U.S. Market 2013. Lawrence University Honors Projects. Paper No. 33.
Oxfam, January 2014. Working for the Few. Oxfam Report Release http://www.oxfam.org
Piketty, T., E. Saez, 2003. Income Inequality in the United States, 1913-1998. The Quarterly Journal of Economics.
27
Sawhney, B.L. and W.R. DiPietro, 2006. Stock Market Wealth and Income Inequality. Journal of Business and Economic Studies,121, 74-79
Schneider, F., 2010. New Estimates for the Shadow Economies all over the World. International Economic Journal 24(4), 443–461.
Sosa-Escudero, W., 2009. Heteroskedasticity and Weighted Least Squares. Econometric Analysis Lectures. Department of Economics Universidad de San Andres.
WFE, 2012. World Federation of Exchanges monthly YTD Data. http://www.world-exchanges.org
UNDP, 2013. Humanity Divided: Confronting Inequality in Developing Countries. United Nations Development Programme Bureau for Development Policy.
Zhang, Y., 2012. Income Inequality and Asset Prices: A Cross-country Study. Social Science Research Network.
Zietz, J., and X. Zhao, 2008. The short-run impact of the stock market appreciation of the 1980s and 1990s on U.S. income inequality. The Quarterly Review of Economics and Finance.

![Table 3 Variables 1 2 3 4 Mcap 0.04 *** 0.04 *** 0.03 *** 0.04 *** [8.01] [9.5] [5.34] [8.03] Interest Rates 0.22 *** 0.24 *** 0.24 *** 0.23 *** [14.1] [15.9] [18.0] [12.8] Unemployment 0.43 *** 0.37 *** 0.50 *** 0.48 *** [12.8] [11.3] [4.22] [13.6] FDI t](https://thumb-eu.123doks.com/thumbv2/9libnet/4252848.67615/27.892.189.774.264.781/table-variables-mcap-rates-unemployment-fdi-t.webp)
