Sayı 19, S. 213-220, Ağustos 2020
© Telif hakkı EJOSAT’a aittir
Araştırma Makalesi
www.ejosat.com ISSN:2148-2683No 19, pp. 213-220, August 2020
Copyright © 2020 EJOSAT
Research Article
An Application of Deep Neural Network for Classification of Wheat
Seeds
Ayşe Eldem
1*1 Karamanoğlu Mehmetbey Üniversitesi, Mühendislik Fakültesi, Bilgisayar Mühendisliği Bölümü, Karaman, Türkiye (ORCID: 0000-0002-5561-1568)
(First received 13 April 2020 and in final form 23 May 2020) (DOI: 10.31590/ejosat.719048)
ATIF/REFERENCE: Eldem, A. (2020). An Application of Deep Neural Network for Classification of Wheat Seeds. European Journal of Science and Technology, (19), 213-220.
Abstract
In recent years, applications of neural network and big data have increased rapidly in agriculture-related areas. At the same time, Deep Neural Network (DNN), in which deep layers are used, achieves much better results especially for classification of big datas properly. In this study, a new DNN model is proposed for the classification of wheat seeds which was taken from UCI Machine Learning Repository. There are totally 210 data from 3 different types of wheat, namely; Kama, Rosa and Canadian. The model is divided into 70% train data and 30% test data. When the developed model was applied to dataset, 100% success rate is achieved in classification of data. In addition, 150,000 pieces of synthetic wheat seed data are generated by using a Fuzzy C-Means based algorithm. The proposed model is tested on different train and test data combinations by using UCI wheat seed and synthetically generated datasets, and 100% success rate was achieved in classification. The proposed model shows that it is the best model compared to other studies in the literature for wheat classifications.
Keywords: Big Data, Classification, Deep Learning, Deep Neural Network, Seed, Wheat
Buğday Tohumlarının Derin Sinir Ağı Uygulaması ile
Sınıflandırılması
Öz
Son yıllarda, tarımla ilgili yapılan çalışmalar incelendiğinde sinir ağı ve büyük veri uygulamaları hızla artmaktadır. Bununla birlikte derinlemesine katmanların kullanıldığı Deep Neural Network (DNN) ile özellikle sınıflandırma alanında çok daha başarılı sonuçlar elde edilmektedir. Bu çalışmada UCI Machine Learning Repository’den alınan buğday tohumlarının sınıflandırılması için yeni bir DNN modeli önerilmiştir. Veri setinde Kama, Rosa ve Canadian olmak üzere 3 farklı buğday türünden toplam 210 veri bulunmaktadır. Veriler; %70 eğitim verisi ve %30 test verisi olarak ayrılarak geliştirilen model veri setine uygulandığında, verilerin sınıflandırılmasında %100 başarı oranı elde edilmiştir. Aynı zamanda Fuzzy C-Means tabanlı bir algoritma geliştirilerek 150.000 adet sentetik buğday tohum verisi üretilmiştir. Önerilen model UCI buğday tohumu ve sentetik olarak üretilen verileri kullanarak farklı eğitim ve test veri kombinasyonları üzerinde test edilmiş ve her birinde %100'lük bir başarı oranına sahip sınıflandırma elde edilmiştir. Önerilen model, buğday sınıflandırmaları için literatürdeki diğer çalışmalara kıyasla en iyi model olduğunu göstermektedir.
As the population of the world increases, industry in agricultural areas has also increased rapidly [1]. So, the invention of better quality products and increase in product diversity are expected. The classification of the products is also the most important subject because of this expectation.
The products grown can be classified using some features like product type, size, brightness, color, surface [2], product pictures and colors of products. In this respect, detection of diseased products [3, 4], detection the freshness of products [5, 6], weed detection [7], counting of products [8], edge properties and textures [7, 9] were used for the classification of the products.
A method was developed for detecting wheat heading and flowering stages with support vector machine [10]. Wheat species were categorized according to their type by using data mining algorithms such as KNN, Naive Bayes, J48 and multilayer perceptron [11] also, K-means clustering algorithm [12], linear regression [13], Sequential Minimal Optimization (SMO) [14], Multilayer Perceptron, SMO, Navie Bayes, Logistic Classifier [15], Random Forest [16], Artificial Neural Network, Decision Tree and Discernment Analysis Classifiers [17], Complete Gradient Clustering Algorithm [18], principal component analysis and multivariate factor analysis [19], Artificial Neural Network (ANN) and Extreme Machine Learning [20] . A spike detection method was developed for images of wheat plants by using a method based on neural network [21]. Grain crop’s seeds were classified by using MATLAB Computer Vision Toolbox [22]. 200 wheat grains were taken using a high-resolution camera which were classified by using artificial neural network [23]. For wheat classification ANN model was trained by artificial bee colony optimization algorithm [24].
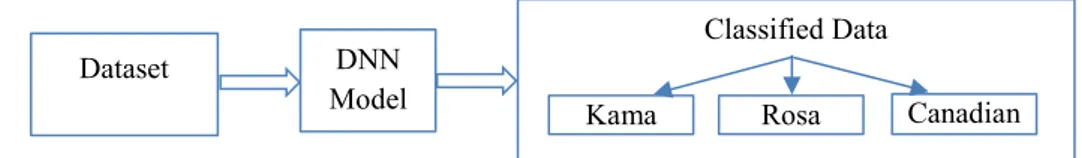
In recent years, numerous applications have been developed for deep artificial neural networks[25]. Deep learning is frequently used in many areas such as classification, regression, image processing, commenting on pictures, sound processing, responding to questions asked, and in language translation [26]. Moreover, DNN also allows interpretation of other samples by using existing data [27]. Deep learning is different from classical neural network methods [28]. Successful classification results can be obtained by using supervised and unsupervised machine learning methods in deep neural network structures [29] [30]. Due to the increase in the size of data, the operations such as data management and analysis also become difficult. But deep learning is an important area, which can produce analytical solutions [29] on the big data that can be processed with better results in a much shorter time by using deep network. In this study, three different types of wheat seeds taken from UCI Machine Learning Repository were classified by a deep neural network model based on deep learning for the first time. Also, 150,000 pieces of synthetic data is generated with Fuzzy C-Means based algorithm. The proposed model is tested with new synthetic data set created and the UCI data set. Schema of the model is given in Figure 1.
Figure 1. Schematic Diagram of The Model
2. Material and Method
In this study, a new deep neural network model was proposed for the classification of wheat seeds. The process steps of the proposed model are given in Figure 2. Firstly, feature extraction is used for dataset. The data is classified which are called Kama, Rosa and Canadian by proposed model. New data is generated by Fuzzy C-Means algorithm and classified by proposed model. When take the results from proposed model for UCI and new dataset, compare success rate with Ajaz and Hussain study [15]. With different combinations of data taken from UCI and generated, new classification is done.
2.1. Seed Set
The wheat seed dataset is taken from UCI [31]. There are 3 different wheat seed groups in the dataset called as Kama, Rosa and Canadian. There are totally 210 data. Each group consists of 70 data [32]. Research was carried out on the collected wheat seed at the Institute of Agrophysics of the Polish Academy of Sciences in Lublin. The images were recorded on 13x18 cm X-ray KODAK plates. The input and output parameters for the wheat in the data set are shown in Table 1, details of the wheat data are shown in Table 2.
Dataset DNN
Model
Classified Data
Figure 2. Process Steps
Table 1. Input and Output Values
Input Output Area (A) Kama (1) Perimeter (P) Take Dataset Feature Extraction Generate New Data The Model (Generated Data and UCI
Dataset)
Train Data Test Data
Take the results
The Best Success Rate Finish Start Yes No
A P C LK WK AC LKG Type 15.26 14.84 0.871 5.763 3.312 2.221 5.22 1 14.88 14.57 0.8811 5.554 3.333 1.018 4.956 1 … … … … 17.63 15.98 0.8673 6.191 3.561 4.076 6.06 2 16.84 15.67 0.8623 5.998 3.484 4.675 5.877 2 … … … … 11.84 13.21 0.8521 5.175 2.836 3.598 5.044 3 12.3 13.34 0.8684 5.243 2.974 5.637 5.063 3
2.2. Generate New Data
Big data is one of the most studied area like deep learning. Especially storing the data in many fields, generation of meaningful information from data, interpretation of the data [33] and classification of data have been achieved recently. Analysis of big data provides more effective, faster and more accurate data using machine and deep learning methods [34]. Synthetic data based on UCI wheat seed dataset is generated by an algorithm developed for this purpose. For each group, 50,000 pieces of data are generated and a total of 150,000 pieces synthetic wheat data are obtained. In algorithm, the minimum and maximum values of each feature are found and the new values are generated randomly between minimum and maximum values of each feature (in those value ranges). Then the cluster center is found for Kama, Rosa and Canadian groups by using the Fuzzy C-Means algorithm [35]. The distances are calculated between the cluster centers and each data in the new data set is generated randomly. The minimum distance value is used to determine which data set belongs to which seed type. The pseudocode of the developed algorithm is given below.
Function generate_data() Load(UCI dataset)
Find max and min values for each feauture
new_data = Set random value for 7 features between max and min values
cluster_center = Determine the cluster center for each cluster in the UCI dataset using the Fuzzy C means algorithm for i=1 to 150.000
distance = Find the distance between new data and cluster centers class(new_data) = Min(distance)
2.3. Feature Extraction
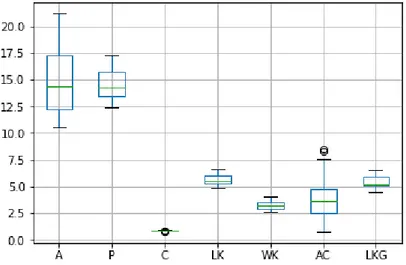
Firstly, a scaling process is applied on the data in the proposed model. The value ranges of each input are shown in Figure 3. The distribution of each feature is distributed within itself. So, it was ensured that the standard deviation of the distribution was approximately 1 and the distribution of each characteristic was approximately 0. The mean and standard deviation values are calculated for each feature and the new value of the feature is scaled according to Formula 1. The graphical representation of data before and after the scaling process is shown in Figure 4.
𝑥
𝑛𝑒𝑤=
𝑥
𝑖− 𝑚𝑒𝑎𝑛(𝑥)
Figure 3. The Value Ranges of Each Input
Figure 4. Scaled Data
2.4. Proposed Model
After the data scaling process, the wheat seed data are divided into two with 70% used as train data and 30% used as test data. The DNN model is shown in Figure 5 which has 7 input values, 4 hidden layers and 3 output values. The number of neurons in the hidden layers are 10, 8, 6 and 3, respectively. Categorical cross entropy is chosen as loss function, epoch number is selected as 500 and learning rate is used as 0.04. Keras library have been used with Python's many libraries. The training and testing process have been performed on workstation having Intel Xeon E5–1650 3.5 GHz processor, 64 GByte memory and NVIDIA® Quadro® M4000 8 GByte graphics card.
The activation function determines the output value according to the inputs. In this study, tangent hyperbolic (tanh) is used as activation function for 1st, 2nd and 3rd hidden layer by using Formula 2. And softmax activation function is also utilized for the last hidden layer by using Formula 3. The tanh activation function takes a value between -1 and +1 [36] [37] which is the scaled version of the sigmoid function. It is also a preferred function because of its non-linearity. Softmax activation function is used in multiple classifications [38] which provides the results as probabilistic. The probability sum of all cases is equal to 1. It is preferred at the last hidden layer. Thus, the output is more easily determined by using Softmax activation function.
𝑓(𝑥) = tanh(x) =
𝑒
𝑥
− 𝑒
−𝑥Figure 5. Proposed model
3. Experimental Results
In order to evaluate the performance of the proposed model, the obtained results in this study are compared with some classification studies using UCI previously presented in the literature. The methods and success rates which were obtained from other articles are detailed in Table 3. The best success rate achieved is 100% accuracy, which is obtained in the classification for the model. As seen in Table 3, Lineer Regression has lower performance. Although the Multilayer Perceptron methods are better than Lineer Regression and SMO, it has lower performance than the proposed model.
Table 3. Comparisons with other studies
Success Rate (%) Method
(Ajaz and Hussain, 2015) 99.5 Multilayer Perceptron (Sabancı and Akkaya, 2016) 97.1429 Multilayer Perceptron
(Lalis, 2016) 89.48 Linear Regression
(Sujatha and Ezhilmaran, 2013) 93.81 SMO
(Aslan et al., 2017) 87.93 Artificial Neural Network (Aslan et al., 2017) 94.44 Extreme Learning Machine
Proposed Method 100 DNN
The model is applied to the generated synthetic data as seen in Table 4. In the first application, only synthetic data are used which are separated as 70% train set and 30% test data. In the second experiment, all of the synthetic wheat data are used as train data and wheat data from UCI dataset are used as test data. In the third experiment, synthetic data and wheat data from UCI dataset are combined and separated as 70% train and 30% test data. When the results obtained are examined, it can be observed that all kinds of wheat seeds are classified with 100% accuracy by the proposed DNN model.
Table 4. Experimental Results of Synthetic Dataset and Wheat Data from UCI Dataset Train Data Test Data Success Rate (%)
UCI Dataset 70% 30% 100
Synthetic Dataset 100% UCI Dataset 100 Synthetic Dataset +
4. Conclusions
For this purpose, a classification process is performed on the data of wheat seeds taken from UCI. There are three types of wheat seeds called as Kama, Rosa and Canadian in the data set. The classification by the proposed DNN model achieved 100% accuracy. Moreover, DNN has a high success rate for processing and interpreting big data. For this reason, another 150,000 synthetic data are generated randomly on the UCI wheat dataset. The synthetic data is classified by using the Fuzzy C-Means algorithm. When the proposed DNN model is applied to synthetic data, success rate achieved is 100%. These results show that DNN is a good classifier especially on big data.
4. Acknowledge
This work was supported by Karamanoğlu Mehmetbey University, Karaman, Turkey.
References
[1] Kamilaris, A. and F.X. Prenafeta-Boldu, Deep learning in agriculture: A survey. Computers and Electronics in Agriculture, 2018.
147: p. 70-90.
[2] Rahman, A. and B. Cho, Assessment of seed quality using non-destructive measurement techniques: A review. Seed Science Research, 2016. 26(4): p. 285-305.
[3] Lu, Y., et al., Identification of rice diseases using deep convolutional neural networks. Neurocomputing, 2017. 267: p. 378-384. [4] Amara, J., B. Bouaziz, and A. Algergawy, A Deep Learning-based Approach for Banana Leaf Diseases Classification in
Datenbanksysteme für Business, Technologie und Web (BTW 2017). 2017. p. 79-88.
[5] Wan, P., et al., A methodology for fresh tomato maturity detection using computer vision. Computers and Electronics in Agriculture, 2018. 146: p. 43-50.
[6] Leemans, V. and M.F. Destain, A real-time grading method of apples based on features extracted from defects. Journal of Food Engineering, 2004. 61(1): p. 83-89.
[7] Bakhshipour, A. and A. Jafari, Evaluation of support vector machine and artificial neural networks in weed detection using shape features. Computers and Electronics in Agriculture, 2018. 145: p. 153-160.
[8] Chen, S.W., et al., Counting Apples and Oranges With Deep Learning: A Data-Driven Approach, in IEEE Robotics and Automation Letters 2017. p. 781-788.
[9] Dyrmann, M., H. Karstoft, and H.S. Midtiby, Plant species classification using deep convolutional neural network. Biosystems Engineering, 2016. 151: p. 72-80.
[10] Sadeghi-Tehran, P., et al., Automated Method to Determine Two Critical Growth Stages of Wheat: Heading and Flowering. Frontiers in Plant Science, 2017. 8.
[11] Sabancı, K. and M. Akkaya, Classification of Different Wheat Varieties by Using Data Mining Algorithms. International Journal of Intelligent Systems and Applications in Engineering 2016. 4(2): p. 40-44.
[12] Parnian, A.R. and R. Javidan, Autonomous Wheat Seed Type Classifier System. International Journal of Computer Applications, 2014. 96(12): p. 14-17.
[13] Lalis, J.T., A New Multiclass Classification Method for Objects with Geometric Attributes Using Simple Linear Regression. IAENG International Journal of Computer Science, 2016. 43(2): p. 198-203.
[14] Sujatha, R. and D. Ezhilmaran, Evaluation of Classifiers to Enhance Model Selection. International Journal of Computer Science & Engineering Technology (IJCSET), 2013. 4(1): p. 16-21.
[15] Ajaz, R.H. and L. Hussain, Seed Classification using Machine Learning Techniques. Journal of Multidisciplinary Engineering Science and Technology, 2015. 2(5): p. 1098-1102.
[16] Abad, M.S.J., A.A. Abkar, and B. Mojaradi, Effect of the Temporal Gradient of Vegetation Indices on Early-Season Wheat Classification Using the Random Forest Classifier. Appl. Sci., 2018. 8(1216): p. 1-20.
[17] Basati, Z., M. Rasekh, and Y. Abbaspour-Gilandeh, Using different classification models in wheat grading utilizing visual features. Int. Agrophys., 2018. 32: p. 225-235.
[18] Charytanowicz, M., et al., Discrimination of Wheat Grain Varieties Using X-Ray Images. Information Technologies in Medicine, 2016: p. 39-50.
[19] Charytanowicz, M., et al., An evaluation of utilizing geometric features for wheat grain classification using X-ray images. Computers and Electronics in Agriculture, 2018. 144: p. 260-268.
[20] Aslan, M.F., K. Sabancı, and A. Durdu, Different Wheat Species Classifier Application of ANN and ELM. Journal of Multidisciplinary Engineering Science and Technology (JMEST), 2017. 4(9): p. 8194-8198.
[21] Qiongyan, L., et al., Detecting spikes of wheat plants using neural networks with Laws texture energy. Plant Methods, 2017. 13(83): p. 1-13.
[28] Xavier, G. and B. Yoshua, Understanding the difficulty of training deep feedforward neural networks. 2010, PMLR. p. 249-256. [29] Chen, X.W. and X. Lin, Big Data Deep Learning: Challenges and Perspectives. IEEE Access, 2014. 2: p. 514-525.
[30] Najafabadi, M.M., et al., Deep learning applications and challenges in big data analytics. Journal of Big Data, 2015. 2(1): p. 1. [31] UCI. 2018 [cited 10.03.2018; Available from: https://archive.ics.uci.edu/ml/datasets/seeds.
[32] Charytanowicz, M., et al., A Complete Gradient Clustering Algorithm for Features Analysis of X-ray Images. Information Technologies in Biomedicine, 2010: p. 15-24.
[33] Torrecilla, J.L. and J. Romo, Data learning from big data. Statistics and Probability Letters, (Article In Press), 2018. [34] Jan, B., et al., Deep learning in big data Analytics: A comparative study. Computers & Electrical Engineering, 2017.
[35] Bezdek, J.C., R. Ehrlich, and W. Full, FCM: The fuzzy c-means clustering algorithm. Computers & Geosciences, 1984. 10(2): p. 191-203.
[36] Liew, S.S., M. Khalil-Hani, and R. Bakhteri, Bounded activation functions for enhanced training stability of deep neural networks on visual pattern recognition problems. Neurocomputing, 2016. 216: p. 718-734.
[37] Eldem, A., H. Eldem, and D. Üstün. A Model of Deep Neural Network for Iris Classification With Different Activation Functions. in 2018 International Conference on Artificial Intelligence and Data Processing (IDAP). 2018.
[38] Chen, L., et al., Softmax regression based deep sparse autoencoder network for facial emotion recognition in human-robot interaction. Information Sciences, 2018. 428: p. 49-61.