http://journals.tubitak.gov.tr/medical/ © TÜBİTAK
doi:10.3906/sag-1609-33
Effects of whole blood viscosity and plasma NOx on cardiac function and cerebral blood
flow in children with chronic kidney disease
Necla BUYAN1, Meltem AKÇABOY1,*, Tayfun GÖKTAŞ2, Serdar KULA3, Bijen NAZLIEL4, Nilgün ÇAKAR5, Nermin UNCU5, Bülent ÇELİK6, Deniz ERBAŞ2
1Department of Pediatric Nephrology, School of Medicine, Gazi University, Ankara, Turkey 2Department of Physiology, School of Medicine, Gazi University, Ankara, Turkey 3Department of Pediatric Cardiology, School of Medicine, Gazi University, Ankara, Turkey
4Department of Neurology, School of Medicine, Gazi University, Ankara, Turkey
5Department of Pediatric Nephrology, Ankara Pediatric Hematology Oncology Training and Research Hospital, Ankara, Turkey 6Department of Statistics, Faculty of Science, Gazi University, Ankara, Turkey
1. Introduction
Whole blood viscosity (WBV) is increasingly recognized as a factor implicated in the genesis of atherosclerosis and the progression of vascular disease, such as chronic kidney disease (CKD), in high-risk patients. The principal determinants of WBV are hematocrit, red blood cell deformability, and the viscosity of plasma. Changes in whole blood viscoelasticity are associated with cardiovascular and cerebrovascular complications among patients with CKD, especially in the fifth stage (1–3). Mechanical interaction between blood and vessels mediated by WBV has a crucial role in the release of endothelium-derived mediators such as NOx and endothelin, and subsequent vascular remodeling (1,4).
The aim of the study was to investigate the effects of WBV and plasma NOx values on cerebral and cardiovascular risks associated with CKD and to compare the impact of hemodialysis (HD) and peritoneal dialysis (PD) treatments on WBV and plasma NOx levels in patients with CKD. 2. Materials and methods
A cross-sectional study was performed in patients who were admitted to our pediatric nephrology department. The study fulfilled the requirements of good clinical practice according to the Declaration of Helsinki, and was approved by our local ethics committee (Date: 13.04.2011, Number: 66). Patients and their families were informed, and all subjects gave written informed consent prior to enrollment.
Background/aim: The aim of the study was to investigate the effects of whole blood viscosity and plasma nitric oxide on cerebral and
cardiovascular risks associated with chronic kidney disease.
Materials and methods: The study group consisted of 40 pediatric patients and 21 healthy control subjects. Hematologic and biochemical
variables, viscosity and plasma nitric oxide levels, echocardiographic findings, and middle cerebral artery blood flow velocity were examined.
Results: Viscosity values of patients were significantly lower than those of the control group. Lower values of hematocrit, total protein,
and albumin and higher values of ferritin in all patient groups resulted in significantly low viscosity levels. Plasma nitric oxide levels were higher in all patient groups than those in the controls. No statistically significant difference was present in middle cerebral artery blood flow velocity between the patient and control groups. Even when systolic functions were normal, the patient group had significant deterioration in diastolic functions, suggesting morbidity and mortality risks.
Conclusions: Cerebral blood flow velocities were not affected by viscosity and nitric oxide levels, suggesting that cerebral circulation
has the ability to make adaptive modulation. The metabolism of nitric oxide levels needs further investigation and studies in patients with chronic renal disease.
Key words: Nitric oxide, viscosity, chronic renal failure, transcranial Doppler ultrasonography, echocardiography Received: 07.09.2016 Accepted/Published Online: 28.05.2017 Final Version: 13.11.2017
The study group consisted of 40 patients aged 8–18 years (13.88 ± 3.02 years); the group included 20 patients with stages III–IV CKD (predialysis patients: PreD), 10 on PD, 10 receiving HD, and 21 healthy control subjects (12.90 ± 3.03 years). All were nonsmokers with no history of recent blood transfusions or any medications likely to affect blood viscosity. Control subjects were excluded for any of the following: 1) congenital or coronary heart disease; 2) diabetes mellitus; 3) hypertension; 4) kidney disease; 5) taking fish oil supplements.
Ten stable HD patients (more than 6 months on regular dialysis) were selected for the study from our dialysis facility and from a training and research hospital; this group consisted of 5 males and 5 females, with a mean age of 15.10 ± 2.13 years and a dry weight of 36.50 ± 8.93 kg. The mean period of hemodialysis was 15.5 months (6– 48 months). The causes of CKD were neurogenic bladder in 1, congenital anomalies of kidney and urinary tract systems (CAKUT) in 1, Alport syndrome in 1, primary hyperoxaluria in 1, nephrolithiasis in 1, vesicoureteral reflux (VUR) in 2, and unknown etiology in 3 patients. HD therapy was performed 3 times per week, with each session lasting 240 minutes; 1.3–1.5 m2 filters were used,
depending on each patient’s weight and age. The effective blood flow changed between 180 and 300 mL/min. Mean weight loss equivalent to net ultrafiltration volume was 1.4 ± 0.5 kg. All patients were anuric. The prevention of clotting of the extracorporeal circuit during treatment was achieved using low-molecular–weight heparin injected as a single intravenous bolus. Dosages were adjusted to individual needs and did not change during the study.
Ten PD patients (more than 6 months on regular dialysis) were selected for the study from our pediatric nephrology department and from the other hospital, also including 5 males and 5 females, with a mean age of 13.70 ± 3.27 years and a dry weight of 28.70 ± 12.20 kg. The mean period of peritoneal dialysis was 28.5 months (6–60 months). The causes of CKD were neurogenic bladder in 1, CAKUT in 1, nephronophthisis in 1, hemolytic uremic syndrome in 1, nephrolithiasis in 1, VUR in 2, posterior urethral valve in 1, and focal segmental glomerulosclerosis in 2 patients. PD therapy was carried out as continuous ambulatory peritoneal dialysis by the daily exchange of dialysate fluid 4 times/day, 1100 mL/m². Four of the peritoneal dialysis patients were anuric; for the others, the urine output was 400 ± 50 mL/day.
Twenty preD patients were selected from our pediatric nephrology department who were considered to have stage III or IV CKD according to their creatinine clearance, which was calculated according to the Schwartz formula (5). CKD stage III is defined as a glomerular filtration rate (GFR) between 30 and 59 mL/min/m², and stage IV is defined as a GFR between 15 and 29 mL/min/m2, according
to the Schwartz formula (5). This group consisted of 14 males and 6 females, with a mean age of 13.35 ± 3.23 years and a dry weight of 44.61 ± 17.01 kg. Etiologies of CKD were VUR in 7, polycystic renal disease in 4, neurogenic bladder in 3, nephronophthisis in 2, nephrolithiasis in 1, posterior urethral valve in 1, CAKUT in 1, and unknown in 2 patients.
The patient group was using supportive therapy set up according to their needs, such as phosphate binders, alkali therapy, and active vitamin D preparations. Blood pressure of the patients was under control during the evaluation. Seventeen patients (42.5%) were using angiotensin-converting enzyme inhibitors in order to regulate hypertension. Only 1 PD patient was using a lipid-lowering drug. Erythropoietin stimulating agents had been used in all HD patients, in 7 of the PD patients, and 3 of the preD patients to correct anemia for 1 month to 6 years. All patients were iron repleted. Iron supplementation was given intravenously or orally according to the patients’ needs.
Venous blood samples were collected at a morning clinic after overnight fasting, 24 h after the last session in HD patients and early in the morning before dialysis fluid instillation in PD patients. Hematologic findings and biochemical variables were evaluated. WBV and plasma NOx values were studied immediately on the same day of the hematologic and biochemical evaluations.
Echocardiography was performed on the same day as the examination of blood samples by the same pediatric cardiologist, who was blind to the groups. All echocardiographic examinations were performed by using a Vivid 7 (GE Vingmed Ultrasound, Horten, Norway) machine. Left ventricular functions were evaluated according to the American Society of Echocardiography Pediatric Guidelines (6). The left ventricular mass (LVM) was calculated according to the formula by Devereux (7). The left ventricular mass index (LVMI) was obtained by dividing the LVM by height to the power of 2.7. Three different models were used to determine left ventricular hypertrophy (LVH) as defined by Khoury et al. (8): 1) LVMI >38, 6 g/m2.7; 2) LVMI >51 g/m2.7; and 3) LVMI
>95th percentile for age and sex in normal children and adolescents. LVMI >51 g/m2.7 indicated severe LVH in
patients.
Relative wall thickness (RWT) was calculated to estimate the left ventricle (LV) geometric pattern using the formula: Interventricular septum + LV posterior wall / LV end diastolic diameter. The patients with LVMI >95% and RWT >0.42 had concentric LVH; those with LVMI >95% and RWT <0.42 had eccentric LVH. Concentric remodeling was defined as LVMI is normal and RWT >0.42 (9).
The left ventricular diastolic function was evaluated by measuring mitral maximal early (E) and late (A) diastolic
flow velocity ratio (E/A). Peak (E’) and atrial (A’) velocities were measured by tissue Doppler using the sample volume that was placed at the lateral annulus of the mitral valve. To evaluate the late diastole, the mitral early inflow wave (E) to lateral mitral annulus Doppler wave (E’) velocity ratio was calculated (E/E’). An E/E’ ratio >10 represented abnormal left ventricular diastolic functions, while an E/A ratio of <1 or >3 was considered normal (10).
The middle cerebral artery blood flow velocity (MCABFV) was examined by transcranial Doppler (TCD) ultrasonography on the same day of the echocardiograpic evaluation by the same neurologist, who was also blind to the patients and groups. The middle cerebral arteries were insonated through the temporal windows using standardized protocol. Mean (Vm) velocities of the right and left middle cerebral artery flow were recorded at depths of 50–60 mm with a 2-MHz probe by the technique described elsewhere by Aaslid (11). Only measurements with the best signal-to-noise ratio were used and the highest values for cerebral blood flow velocities were selected for analysis. The sample volume was 8–10 mm in the axial and 5 mm in the lateral direction at a depth of 50 mm. All TCD studies were performed by using a commercially available Viasys/Sonara TCD apparatus (Cardinal Health, Madison, WI, USA).
WBV measurement: The viscoelastic properties were determined via measurement of the oscillatory flow in a cylindrical tube called a Vilastic Bioprofiler (Vilastic Scientific, Inc, Austin, TX, USA). For this measurement, 0.5 mL of the sample was used. Before the measurement, the tube was filled with deionized water at 37 °C. When the temperature equilibrium was established, the viscosity of the deionized water was measured and substituted with the sample’s viscosity. This was done to eliminate the effect of the transport medium on the measurement of the sample’s viscosity. All the measurements were taken under constant temperature. To accomplish this, the device was run under constant temperature for at least 40 min before taking all the measurements. To eliminate the effect of the time interval between gathering the sample and taking the measurement, all the samples were evaluated in a constant time of a maximum of 30 min after blood samples were obtained. The results of viscosity were given as poise units (12).
The NOx level measurement: the NOx level in whole blood is determined by measuring nitrite and nitrate production using classical colorimetric reaction. Plasma samples for the determination of NOx concentration were diluted 1:1(vol/vol) with 0.3 M NaOH and incubated for 5 min and then protein-precipitated using 10% ZnSO4. The mixture was centrifuged for 10 min at 14,000 rpm. Supernatants were collected and plated briefly; equal volumes of samples and Griess reagent (sulfanilamide
and naphthalene–ethylene diaminedihydrochloride) were mixed at room temperature. After 5 min, the absorbance was measured at 540 nm using a spectrophotometer. The concentration of nitrite was determined by a standard curve prepared with sodium nitrite (13).
2.1. Statistical analysis
Data analysis was performed using SPSS v.15.0 (Statistical Package for the Social Sciences, Chicago, IL, USA). Continuous variables were presented as a mean and standard deviation (SD) or median and interquartile range (IQR), and categorical variables were presented as frequency and percentages. Continuous variables were compared using one-way ANOVA with a Tukey post-hoc test or a Kruskal–Wallis H test with a Bonferroni-adjusted Mann–Whitney U test, depending on normality of distribution or not. Bivariate correlation coefficients were calculated using the Pearson product moment or Spearman’s rank test, depending on normality of distribution or not. All statistical analyses were two-sided, and a P-value <0.05 was considered to be statistically significant.
3. Results
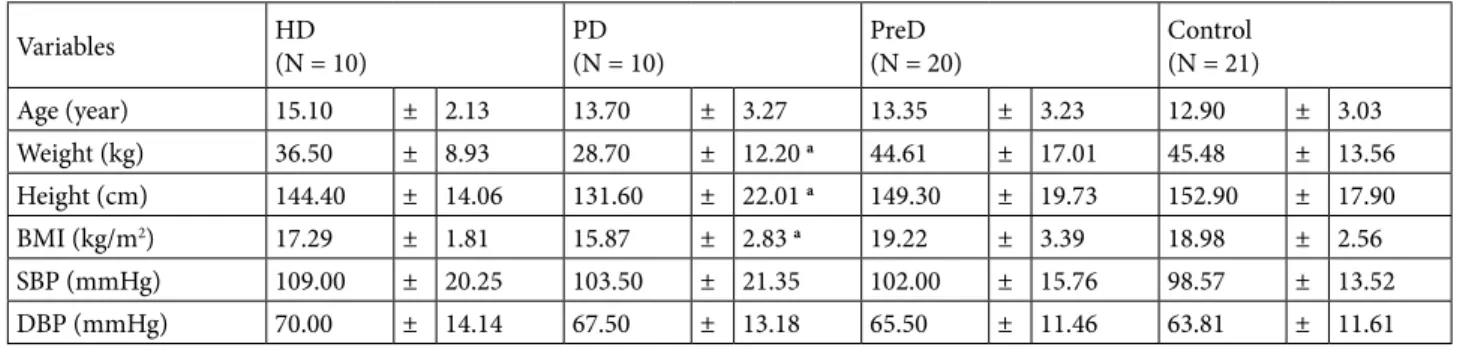
Demographic findings and the main clinical and biological characteristics of all patients and controls are given in Table 1. Laboratory results, plasma NOx, and MCABV values for all study groups can be seen in Table 2.
The mean WBV was higher in the control subjects than in the patient groups, while there was no significant difference between the WBV values in all patients.
Plasma hematocrit, total protein, and albumin levels were lower in all patient groups than those in the control patients. On the other hand, ferritin levels in the PreD, HD, and PD groups were higher than those in the control group. Additionally, homocysteine levels were higher in the PD and PreD groups than in the HD patients and healthy controls. There was a significant positive correlation between WBV and hematocrit and serum albumin levels in the study group (P < 0.05) (Figure). There was a positive correlation between WBV and fibrinogen levels and a negative correlation between WBV and homocysteine levels in the study group, but neither was significant (P > 0.05). A significant positive correlation was found between plasma NOx levels and ferritin in the patient group (P < 0.05).
Plasma NOx levels were higher in HD/PD patients than those in the PreD group, but plasma NOx levels were lower in the control group than those in all patient groups.
An insignificant negative correlation was found between WBV and plasma NOx levels (P > 0.05).
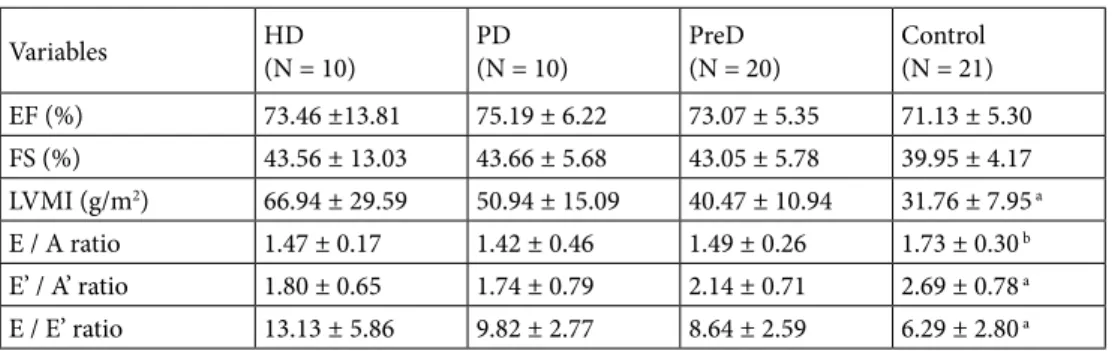
For echocardiographic evaluation, the left ventricular systolic functions were not different between the groups. LVMI was significantly higher in all patient groups than in
the healthy subjects. While the E/A ratio was significantly different between both the HD and PreD groups and the controls, the E’/A’ ratio value was significantly lower in all patient groups than in the control group (P < 0.05). The E/E’ ratio value for all patient groups was also different significantly from that of the controls (P < 0.05).
LVH presentation was similar in patients for both LVMI > 38.6 g/m2.7 model and LVMI > 95% model (Table
3). According to these 2 models, LVH was present in two-thirds of all patients. While concentric hypertrophy was present in 42.5% of all patients, eccentric hypertrophy was found in 17.5% of all patients. The concentric hypertrophy Table 1. Demographic findings and the main clinical and biological characteristics of all patients and controls.
Variables HD(N = 10) PD(N = 10) PreD(N = 20) Control(N = 21)
Age (year) 15.10 ± 2.13 13.70 ± 3.27 13.35 ± 3.23 12.90 ± 3.03 Weight (kg) 36.50 ± 8.93 28.70 ± 12.20 a 44.61 ± 17.01 45.48 ± 13.56 Height (cm) 144.40 ± 14.06 131.60 ± 22.01 a 149.30 ± 19.73 152.90 ± 17.90 BMI (kg/m2) 17.29 ± 1.81 15.87 ± 2.83 a 19.22 ± 3.39 18.98 ± 2.56 SBP (mmHg) 109.00 ± 20.25 103.50 ± 21.35 102.00 ± 15.76 98.57 ± 13.52 DBP (mmHg) 70.00 ± 14.14 67.50 ± 13.18 65.50 ± 11.46 63.81 ± 11.61 HD: hemodialysis, PD: peritoneal dialysis, PreD: predialysis, BMI: body mass index, SBP: systolic blood pressure, DBP: diastolic blood pressure.
a P < 0.05 versus PreD and control.
Table 2. Laboratory results and MCABV values in all study groups.
Variables HD(n: 10) PD(n: 10) PreD(n: 20) Control(n: 21) Red blood cell (×104/mm3) 3.42 ± 0.59 3.29 ± 0.78 4.01 ± 0.83 4.96 ± 0.47 a
Hematocrit (%) 30.22 ± 5.89 29.41 ± 7.17 33.25 ± 6.61 41.40 ± 3.67 a Hemoglobin (g/dL) 10.06 ± 1.90 10.02 ± 2.44 11.11 ± 2.26 14.11 ± 1.15 a Albumin (g/dL) 4.12 ± 0.53 3.69 ± 0.41 4.35 ± 0.34 b 4.79 ± 0.28 a Total protein (g/dL) 7.01 ± 0.84 6.34 ± 0.57 7.26 ± 0.60 b 7.65 ± 0.37 a Ferritin (ng/mL) 293.0 (265.5–345.0) 220.7 (137.9–347.8) 40.1 (24.8–125.0) c 17.0 (14.8–28.3) a Lipoprotein A (mg/dL) 29.3 (9.7–36.3) 27.9 (11.5–46.1) 17.2 (9.5–34.5) 17.7 (9.5–34.5) Fibrinogen (mg/dL) 363.0 (300.0–434.0) 398.5 (358–487) 350.5 (296.0–396.0) 260.0 (248–287) a hsCRP (mg/dL) 0.44 (0.05–1.42) 0.08 (0.03–0.20) 0.16 (0.05–0.64) 0.03 (0.02–0.10) d Homocysteine (µmol/L) 15.9 (13.7–28.9) 22.3 (16.9–23.7) e 21.3 (17.5–30.6) e 14.5 (12.0–18.2) LDL(mg/dL) 76.7 (51.0–116.4) 109.0 (102.0–136.8) 89.3 (71.2–102.4) b 83.0 (73.6–90.0) b HDL(mg/dL) 36.5 (33.0–40.0) 42.0 (37–48) 42.5 (40.0–48.5) 51.0 (41–60) a Triglyceride(mg/dL) 184.9 ± 97.2 170.9 ± 58.9 127.8 ± 50.9 77.0 ± 21.0 a
Whole blood viscosity (spoise) 0.0387 ± 0.011 0.0418 ± 0.013 0.0423 ± 0.013 0.0601 ± 0.006 a
MCABFV (cm/s) 62.26 ± 12.36 70.84 ± 15.92 65.86 ± 14.79 68.24 ± 11.09 Plasma NOx (nmol/mL) 119.18 ± 20.61 115.77 ± 15.11 78.41 ± 11.24c 66.03 ± 14.34a
Data are presented as mean ± standard deviation or median (IQR).
HD: hemodialysis, hsCRP: high sensitive C-reactive protein; PD: peritoneal dialysis, PreD: predialysis, HDL: High density lipoprotein cholesterol, LDL: low density lipoprotein cholesterol, MCABFV: middle cerebral artery blood flow velocity, plasma NOx: plasma nitric oxide.
a P < 0.05 versus HD, PD, and PreD. b P < 0.05 versus PD. c P < 0.05 versus HD and PD. d P < 0.05 versus HD and PreD. e P < 0.05 versus HD and control.
most presented LV geometry in HD and PD groups (Table 4).
Although there was no significant correlation between echocardiographic parameters and plasma NOx values, WBV correlated positively significant in controls with LVMI (P < 0.05). In the patient group, there was a negative correlation between WBV and LVMI, but it was not significant (P > 0.05).
For transcranial Doppler ultrasonography examination, when the MCABFV values were examined, no statistically significant difference was present in MCABFV between the patient and control groups (Table 2). In addition, a negative correlation was found between WBV and MCABFV values in the studied patient subgroups and the controls, but it was not significant (P > 0.05). There was no significant correlation between plasma NOx values and MCABFV in the study group (P > 0.05).
4. Discussion
Chronic inflammation, increased oxidative stress, proteinuria, hypoalbuminemia, hypertension, renin–
angiotensin–aldosteron system activation, dyslipidemia, altered calcium–phosphate metabolism, chronic acidosis, and anemia are the most important risk factors for the progression of CKD. Preventive measures should be taken to slow down the rate of CKD progression and to delay the need for renal replacement therapy, including transplantation and receiving HD or PD therapy. Children with CKD are at high risk of developing cardiovascular disease and cerebrovascular events (14). WBV depends on the blood composition, including blood cells (erythrocytes, leukocytes) and plasma proteins (albumin, globulins, and fibrinogen) in humans. Hemoglobin and fibrinogen were shown as the 2 major contributory factors that affect WBV (4). However, in CKD patients, data about WBV is confusing and controversial (14– 19). Hypoalbuminemia associated with CKD has been shown to cause hyperviscosity by enhancing a reduction in erythrocyte deformability. Additionally, an albumin deficiency increases fibrinogen and triglyceride levels and may alter red cell membrane lipid composition (16,17). Furthermore, elevated homocysteine levels in
addition to hypoalbuminemia and hyperfibrinogemia are considered to be other factors that contribute to the risk of atherosclerosis in CKD patients. As a result, these changes increase the risk of thrombosis by increasing plasma viscosity and red blood cell and platelet aggregation and by promoting fibrin deposition plaques, and may contribute to hypertension by increasing peripheral resistance (18).
In this study, the systolic blood pressure and diastolic blood pressure of all patients were kept under control by the use of antihypertensive monotherapy. All of the patients were normotensive at the time of investigation. According to our laboratory results, serum albumin levels were significantly lower in all patient subgroups than in healthy subjects. The significantly lower values of albumin may be due to the malnutrition of all subjects in the
patient group. Protein loss from peritoneal membrane in PD patients might be another reason. Moreover, serum fibrinogen levels were significantly higher in all patients than in the controls. These results could be explained not only by the increasing fibrinogen values resulting from an albumin deficiency but also by accompanying systemic inflammation in CKD patients. Additionally, homocysteine levels were found to be higher in the PD and PreD groups than in the HD patients and healthy controls. No significant correlation was found in our study; however, some studies have shown that plasma homocysteine and fibrinogen levels were correlated with plasma viscosity (19). In the present study, there was a positive correlation between WBV and fibrinogen levels and a negative correlation between WBV and homocysteine levels in the
Table 3. Echocardiographic measurements of patients and control group.
Variables HD(N = 10) PD(N = 10) PreD(N = 20) Control(N = 21) EF (%) 73.46 ±13.81 75.19 ± 6.22 73.07 ± 5.35 71.13 ± 5.30 FS (%) 43.56 ± 13.03 43.66 ± 5.68 43.05 ± 5.78 39.95 ± 4.17 LVMI (g/m2) 66.94 ± 29.59 50.94 ± 15.09 40.47 ± 10.94 31.76 ± 7.95 a
E / A ratio 1.47 ± 0.17 1.42 ± 0.46 1.49 ± 0.26 1.73 ± 0.30 b
E’ / A’ ratio 1.80 ± 0.65 1.74 ± 0.79 2.14 ± 0.71 2.69 ± 0.78 a
E / E’ ratio 13.13 ± 5.86 9.82 ± 2.77 8.64 ± 2.59 6.29 ± 2.80 a
HD: hemodialysis, PD: peritoneal dialysis, PreD: predialysis, EF: ejection fraction, FS: fractional shortening, LVMI: left ventricle mass index, E: mitral diastolic early inflow velocity wave, E’: early diastolic mitral annulus velocity wave, A: mitral diastolic late inflow velocity wave, A’: late diastolic mitral annulus velocity wave, E/A ratio: ratio of mitral early to late inflow velocity, E’/A’: ratio of early diastolic mitral annulus velocity to late diastolic mitral annulus velocity, E/E’: ratio of early transmitral inflow velocity divided by the early diastolic mitral annular velocity.
a P < 0.05 versus HD, PD, and PreD. b P < 0.05 versus HD and PreD.
Table 4. Different definitions of left ventricular hypertrophy models.
Variables HD PD PreD LVMI > 38.6 g/m2.7 8 (28.6) 8 (28.6) 10 (35.7) LVMI > 51 g/m2.7 5 (38.5) 5 (38.5) 2 (15.4) LVMI > 95% 7 (28.0) 7 (28.0) 10 (40.0) Concentric hypertrophy 7 (38.9) 6 (33.3) 4 (22.2) Concentric remodeling 1 (5.3) - 5 (26.3) Eccentric hypertrophy - 1 (14.3) 6 (85.7) Data are presented as number of patients and percentages.
HD: hemodialysis, PD: peritoneal dialysis, preD: predialysis, LVMI: left ventricle mass index.
study group; it might be expected that the relationship might be stronger and more significant with an increased number of patients. Finally, the WBV values of all of the patients were significantly lower than the control group. It can be concluded that significantly lower values of hematocrit, total protein, and albumin and higher values of ferritin in all patient groups might result in low WBV levels in patients with CKD.
It is worth noting that cardiovascular complications have accounted for 21% to 57% of deaths among children receiving HD (20,21). In HD patients, the role of rapid fluid volume removal has generally been ignored (22). Fathallah-Shaykh et al. demonstrated that WBC increased linearly over HD sessions in both children and adults. A significant correlation between increased WBV and hematocrit, the amount of ultrafiltration volume, and a decline in blood volume was shown in the same study as well (21). In our study, venous blood samples were collected 24 h after the last session in HD patients and early in the morning before dialysis fluid instillation in PD patients. Because WBV was evaluated in an interdialytic period, our laboratory results are not expected to be affected by the acute rise in WBV after the HD sessions.
In brief, the following conclusions can be drawn in each part of the study, as for the NOx examination; NOx is an important substance in the maintenance of vascular tone and regulation of blood pressure. Physiological and pathophysiological mechanisms of CKD can cause damage of endothelium or blood vessels. It was shown that the disturbances of vasoactive substances like NOx production can result in significant hemodynamic problems and atherosclerosis in patients with CKD (23). The plasma concentration and urinary excretion of NO2 and NO3 (NOx; the stable oxidation products of NO) are now being widely used to give a measure of total NO production in vivo (24,25). In the literature, the results of the studies that investigated the plasma levels and effects of NOx in patients with CKD were controversial. Some studies have supported that plasma NOx levels were lower in CKD patients (23,26–27). Total NO production was in a small number of patients with chronic renal failure, but the patient group was reported to be hypertensive during the investigation (28). On the other hand, the results of some studies on the plasma NOx levels of dialysis patients supported the high plasma NOx values resulting from a complete loss of renal clearance and the removal of NO inhibitors such as asymmetric dimethylarginine (ADMA) by dialysis (15,23,28–30). Recent data also supported our finding that higher degree of inflammation and stimulation of the inducible form of nitric oxide synthase results in higher values of NOx in CKD patients (31,32). These literature findings supported our results showing higher plasma NOx levels in HD/PD patients than those in
the preD group, but lower NOx levels in the control group than those in all patient groups. Our data also showed that the blood pressure of all of our patients was under control with antihypertensive therapy. The reason is not clear, but most likely a high level of NOx as a potent vasodilator might have an additional effect on the restoration of blood vessel tension down to normal.
In terms of our echocardiographic examination, there have been many studies assessing the left ventricular diastolic functions in children with renal failure. The most widely used method to determine the diastolic functions of LV is Doppler examination of the mitral inflow velocity. These studies have shown that the LV relaxation (E/A) was impaired in children under dialysis (22,33–35). Our Doppler findings were supported by the literature findings. We found a lower E/A ratio in patients compared to the controls, although none of these patients had an E/A value <1, which is considered to be abnormal (36). On the other hand, transmitral Doppler velocities are affected by several hemodynamic factors that are particularly important for patients with chronic renal failure. Therefore, we studied tissue Doppler imaging in our study group as suggested by the literature (9). The E/E’ ratio is especially suggested for the evaluation of LV filling pressures and LV myocardial compliance in patients with preserved systolic functions, especially as an early predictor of diastolic heart failure (9,36). High values of E/E’ ratios were significantly associated with the high incidence of mortality in chronic renal failure patients in adults, especially ratios >15 (37). In our study, patients were evaluated echocardiographically within 24 h of completing their dialysis treatment to minimize the effect of fluid overload. We found that the E/E’ ratio values of all subgroups were significantly higher than those of the controls. An E/E’ ratio >10 represented abnormal left ventricular diastolic functions; the patient group, especially the HD patients, had the highest E/E’ ratio, suggesting diastolic dysfunction. A statistically significant correlation between an elevated LVMI value and an increased E/E’ ratio was found in all patients. According to these findings, it can be concluded that while the patients had normal systolic functions, their LV myocardial compliance and filling pressures were still impaired, suggesting the deterioration of diastolic function. LVH is defined as the most important independent marker of cardiovascular risks and is the most common and identifiable cardiac alteration in patients with chronic renal insufficiency (38). Concentric hypertrophy was the most often presented LV geometry in HD and PD groups in our study, concordant with the literature (39). Increased LVMI might have been caused by previous hypertension, especially in the patients having concentric hypertrophy during the study. Additionally, the undetermined volume load may have an alternative explanation for increased LVMI apart from a history of hypertension, which was
under control during the study. The high prevalence of volume-dependent eccentric LVH, especially in predialysis patients, suggests that fluid overload rather than hypertension is likely a cause of LVH.
In terms of TCD ultrasound, it has been stated that under normal conditions, a 3-fold variation in plasma viscosity with a 2-fold variation in whole blood viscosity did not significantly alter cerebral blood flow (40). Although there have been some data supporting the relationship between hyperviscosity and cerebrovascular events in CKD patients in adults, there are no available data in children (41–43). No statistically significant difference was present in MCABFV between patients and control groups in our study. We think cerebral circulation has the ability to make adaptive modulations in terms of changes in viscosity, in order to keep up uniform cerebral blood flow. In addition, a negative correlation was found between WBV and MCABFV values in the studied patient subgroups and the controls, but it was not significant. It is expected that studies having large number of patients might emphasize the relationship between WBV and MCABFV in children. No other studies have evaluated the relation between viscosity, plasma NOx, and MCABFV in children with CKD in the literature.
In conclusion, although there have been some data supporting the relationship between hyperviscosity, plasma NOx, and cerebrovascular as well as cardiovascular events in CKD patients, no significant correlations were
found among those parameters in this study. However, our results showed that a negative correlation was found between WBV and MCABFV values in the studied group. WBV was significantly associated with lower hemoglobin, hematocrit, and albumin levels and higher levels of ferritin. Plasma NOx levels were higher in CKD patients, suggesting the complete loss of renal clearance and the removal of NO inhibitors such as ADMA by dialysis and stimulation of the inducible form of nitric oxide synthase through a higher degree of inflammation in CKD patients. Increased plasma NOx levels in the patient group might be associated with blood pressure maintained within normal ranges. Increased levels of plasma NOx levels in the patient group might have an additional effect on keeping blood pressure within normal range under antihypertensive monotherapy. Higher levels of LVMI indicated the prior hypertensive state of the patients. Even systolic functions in the normal patient group had significant deterioration in diastolic functions, suggesting their morbidity and mortality risks. Concentric LVH was predominant in the patient group. The metabolism of NOx levels needs further investigation with a large number of patients with chronic renal disease to illuminate this issue.
Acknowledgement
The study was funded by a scientific research project grant of Gazi University School of Medicine (grant number: 01/2011-36).
References
1. Canaud B, Rodriguez A, Chenine L, Morena M, Jaussent I, Leray-Moragues H, Picard A, Cristol JP. Whole-blood viscosity increases significantly in small arteries and capillaries in hemodiafiltration. Does acute hemorheological change trigger cardiovascular risk events in hemodialysis patient? Hemodial Int 2010; 14: 433-440.
2. London G. Pathophysiology of cardiovascular damage in the early renal population. Nephrol Dial Transplant 2001; 16 Suppl 2: 3-6.
3. Du Y, Yao W, Qian Y, Han M, Wen Z, Ma L. Hemorheologicalchanges in patients with living-donor renal transplantation. Clin Hemorheol Microcirc 2011; 47: 199-209. 4. Malyszko J. Mechanism of endothelial dysfunction in chronic
kidney disease. Clin Chim Acta 2011; 411: 1412-1420. 5. Schwartz GJ, Brion LP, Spitzer A. The use of plasma creatinine
concentration for estimating glomerular filtration rate in infants, children, and adolescents. Pediatr Clin North Am 1987; 34: 571-590.
6. Lai WW, Geva T, Shirali GS, Frommelt PC, Humes RA, Brook MM, Pignatelli RH, Rychik J; Task Force of the Pediatric Council of the American Society of Echocardiography; Pediatric Council of the American Society of Echocardiography. Guidelines and standards for performance of a pediatric echocardiogram: a report from the Task Force of the Pediatric Council of the American Society of Echocardiography. J Am Soc Echocardiogr 2006; 19: 1413-1430.
7. Devereux RB, Alonso DR, Lutas EM, Gottlieb GJ, Campo E, Sachs I, Reichek N. Echocardiographic assessment of left ventricular hypertrophy: comparison to necropsy findings. Am J Cardiol 1986: 57: 450-458.
8. Khoury PR, Mitsnefes M, Daniels SR, Kimball TR. Age-specific reference intervals for indexed left ventricular mass in children. J Am Soc Echocardiogr 2009; 22: 709-714.
9. Mirchandani D, Bhatia J, Leisman D, Kwon EN, Cooper R, Chorny N, Frank R, Infante L, Sethna C. Concordance of measures of left-ventricular hypertrophy in pediatric hypertension. Pediatr Cardiol 2014; 35: 622-626.
10. Nagueh SF, Appleton CP, Gillebert TC, Marino PN, Oh JK, Smiseth OA, Waggoner AD, Flachskampf FA, Pellikka PA, Evangelista A. Recommendations for the evaluation of left ventricular diastolic function by echocardiography. J Am Soc Echocardiogr 2009; 22: 107-133.
11. Aaslid R, Markwalder TM, Nornes H. Noninvasive transcranial Doppler ultrasound recording of flow velocity in basal cerebral arteries. J Neurosurg 1982; 57: 769-774.
12. Long JA, Undar A, Manning KB, Deutsch S. Viscoelasticity of pediatric blood and its implications for the testing of a pulsatile pediatric blood pump. ASAIO Journal 2005; 51: 563-566. 13. Miranda KM, Espey MG, Wink DA. A rapid, simple
spectrophotometric method for simultaneous detection of nitrate and nitrite. Nitric Oxide 2001; 5: 62-71.
14. Schaefer B, Wühl E. Educational paper: progression in chronic kidney disease and prevention strategies. Eur J Pediatr 2012; 171: 1579-1588.
15. Hammes MS, Watson S, Coe FL, Ahmed F, Beltran E, Dhar P. Asymmetric dimethylarginine and whole blood viscosity in renal failure. Clin Hemorheol Microcirc 2015; 59: 245-255. 16. Vaisman S, Kensey K, Cho YI. Effect of hemodialysis on whole
blood viscosity. Int J Artif Organs 2009; 32: 329-335.
17. Joles JA, Willekes-Koolschijn N, Koomans HA. Hypoalbuminemia causes high blood viscosity by increasing red cell lysophophatidylcholine. Kidney Int 1997: 52: 761-770. 18. McGregor D, Shand B, Lynn K. A controlled trial of the effect of
folate supplements on homocysteine, lipids and hemorheology in end-stage renal disease. Nephron 2000; 85: 215-220. 19. von Eckardstein A, Malinow MR, Upson B, Heinrich J,
Schulte H, Schönfeld R, Köhler E, Assmann G. Effects of age, lipoproteins, and homeostatic parameters on the role of homocyst(e)inemia as a cardiovascular risk factor in men. Arterioscler Thromb 1994; 14: 460-464.
20. Paulitschke M, Ludat K, Riedel E, Hampl H. Long-term effects of rhEPO therapy on erythrocyte rheology in dialysis patients with different target hematocrits. Clin Nephrol 2000; 53: 36-41. 21. Fathallah-Shaykh SA, Brooks ER, Langman CB, Kensey KR.
Sodium modeling attenuates rises in whole-blood viscosity during chronic hemodialysis in children with large inter-dialytic weight gain. Pediatr Nephrol 2006; 21: 1179-1184. 22. Goren A, Glaser J, Drukker A. Diastolic function in children
and adolescents on dialysis and after kidney transplantation: an echocardiographic assessment. Pediatr Nephrol 1993; 7: 725-728.
23. Kovačević P, Dragić S, Rajkovača Z, Veljković S, Kovačević T. Serum levels of nitric oxide and endothelin-1 in patients treated with continuous ambulatory peritoneal dialysis. Ren Fail 2014; 36: 437-440.
24. Vaziri ND, Ni Z, Wang XQ, Oveisi F, Zhou XJ. Down regulation of nitric oxide synthase in chronic renal insufficiency: role of excess PTH. Am J Physiol 1998; 274: F642-649.
25. Kari JA, Donald AE, Vallance PT, Bruckdorfer KR, Leone A, Mullen MJ, Bunce T, Dorado B, Deanfield JE, Rees L. Physiology and biochemistry of endothelial function in children with chronic renal failure. Kidney Int 1997; 52:468-472.
26. Vallance P, Leone A, Calver A, Collier J, Moncada S. Accumulation of an endogenous inhibitor of nitric oxide synthesis in chronic renal failure. Lancet 1992; 339: 572-575. 27. Kang ES, Miles DE, Tevlin MT, Cates TB, Acchiardo SR.
Reversible sequestration of nitric oxide by hemoglobin during hemodialysis in end-stage renal disease. Am J Med Sci 2001; 321: 113-123.
28. Schmidt RJ, Baylis C. Total nitric oxide production is low in patients with chronic renal disease. Kidney Int 2000; 58: 1261-1266.
29. Schmidt RJ, Yokota S, Tracy TS, Sorkin MI, Baylis C. Nitric oxide production is low in end-stage renal disease patients on peritoneal dialysis. Am J Physiol 1999; 276: F794-797. 30. Schmidt RJ, Domico J, Samsell LS, Yokota S, Tracy TS, Sorkin
MI, Engels K, Baylis C. Indices of activity of the nitric oxide system in hemodialysis patients. Am J Kidney Dis 1999; 34: 228-234.
31. Fayed HM, Kame MA, Sultan MM, Mowafy MN, Helmy SM, El-Zoghby MH. Nitric oxide generation by peripheral blood cells in chronic renal failure. Br J Biomed Sci 2002; 59: 24-29. 32. Sarkar SR, Kaitwatcharachai C, Levin NW. Nitric oxide and
hemodialysis. Semin Dial 2004; 17: 224-228.
33. Shamszad P, Slesnick TC, Smith EO, Taylor MD, Feig DI. Association between left ventricular mass index and cardiac function in pediatric dialysis patients. Pediatr Nephrol 2012; 27: 835-841.
34. Kasner M, Westermann D, Steendijk P, Gaub R, Wilkenshoff U, Weitmann K, Hoffmann W, Poller W, Schultheiss HP, Pauschinger M et al. Utility of Doppler echocardiography and tissue Doppler imaging in the estimation of diastolic function in heart failure with normal ejection fraction: a comparative Doppler-conductance catheterization study. Circulation 2007; 116: 637-647.
35. Rivas-Gotz C, Manolios M, Thohan V, Nagueh SF. Impact of left ventricular ejection fraction on estimation of left ventricular filling pressures using tissue Doppler and flow propagation velocity. Am J Cardiol 2003; 91: 780-784.
36. Ommen SR, Nishimura RA, Appleton CP, Miller FA, Oh JK, Redfield MM, Tajik AJ. Clinical utility of Doppler echocardiography and tissue Doppler imaging in the estimation of left ventricular filling pressures: a comparative simultaneous Doppler-catheterization study. Circulation 2000; 102: 1788-1794.
37. Kim MK, Kim B, Lee JY, Kim JS, Han BG, Choi SO, Yang JW. Tissue Doppler-derived E/e’ ratio as a parameter for assessing diastolic heart failure and as a predictor of mortality in patients with chronic kidney disease. Korean J Intern Med 2013; 28: 35-44.
38. Matteucci MC, Wühl E, Picca S, Mastrostefano A, Rinelli G, Romano C, Rizzoni G, Mehls O, de Simone G, Schaefer F; ESCAPE Trial Group. Left ventricular geometry in children with mild to moderate chronic renal insufficiency. J Am Soc Nephrol 2006; 17: 218-226.
39. Mitsnefes MM, Barletta GM, Dresner IG, Chand DH, Geary D, Lin JJ, Patel H. Severe cardiac hypertrophy and long-term dialysis: the Midwest Pediatric Nephrology Consortium study. Pediatr Nephrol 2006; 21; 1167-1170.
40. Tomiyama Y, BrianJr JE, Todd MM. Plasma viscosity and cerebral blood flow. Am J Physiol Heart Circ Physiol 2000; 279: H1949-1954.
41. Macko RF, Ameriso SF, Akmal M, Paganini-Hill A, Mohler JG, Massry SG, Meiselman HJ, Fisher M. Arterial oxygen content and age are determinants of middle cerebral artery blood flow velocity. Stroke 1993; 24: 1025-1028.
42. Schuurman PR, Albrecht KW. Intraoperative changes of transcranial Doppler velocity: relation to arterial oxygen content and whole-blood viscosity. Ultrasound Med Biol 1999; 25: 151-154.
43. Stefanidis I, Bach R, Mertens PR, Liakopoulos V, Liapi G, Mann H, Heintz B. Influence of hemodialysis on the mean blood flow velocity in the middle cerebral artery. Clin Nephrol 2005; 64: 129-137.