T.C.
ISTANBUL BILGI UNIVERSITY
INSTITUTE OF SOCIAL SCIENCES
CULTURAL DIFFERENCE AS A DETERMINANT IN FOREIGN
DIRECT INVESTMENT FLOWS
Huzeyfe Zahit ATAN
1136220061
ABSTRACT
Determinants of Foreign Direct Investment (FDI) have been investigated by several researchers recently in the literature. In this thesis, the effect of cultural differences on Foreign Direct Investment flows is investigated. For that reason, Gravity Model is used on Foreign Direct Investment flows of 29 OECD source countries between 1996-2012. For cultural differences, I use Hofstede’s six dimensional dataset in two different approaches. In the first approach, I compound six dimensions of dataset into one variable on country level. In the second approach, I use every dimension of database separately one by one to find out which dimension is effective on Foreign Direct Investment flows. Hofstede’s dimensions are named as power distance, masculinity, uncertainty avoidance, indulgence, individualism and long term orientation.
Results of the first approach indicate that cultural differences between countries on aggregate level reduce FDI flows among countries. On dimensional analysis, differences on masculinity, uncertainty avoidance and indulgence between source and receipt countries reduce FDI flows. On the contrary to the general idea some differences in the cultural differences increase FDI flows between countries like power distance and long term orientation. Our results demonstrate that firms are considering different dimensions of culture when they are deciding to invest. On the other hand, every dimension of culture has no effect on Foreign Direct Investment flows, as our results indicate that there is no significant result for individualism dimension. Last, to the best of my knowledge, my thesis is the first to prove that cultural distance is a determinant for FDI flows of OECD countries.
Key Words: Foreign Direct Investment, Cultural Differences, Gravity Model, Hofsetede’s Index, Foreign Capital Flows
2
ÖZET
Literatürde Doğrudan Yabancı Yatırımları (DYY) belirleyicileri faktörler son zamanlarda birçok araştırmacı tarafından incelenmiştir. Bu tezde,ise kültürel farklılıkların Doğrudan Yabancı Yatırımlar üzerindeki etkisi incelendi. Bu amaçla çekim modeli 29 OECD ülkesinin 1996-2012 yılları arasında yapmış olduğu Doğrudan Yabancı Yatırımları üzerine uygulandı. Kültürel farklılıkları ölçmek için Hofstede’in oluşturduğu altı boyutlu datasetini iki farklı yaklaşım ile kullandım. İlk yaklaşımda, Hofstede’in altı kültürel boyutunu ülke düzeyinde tek bir değişkende topladım. İkinci yaklaşımda, hangi boyutun Doğrudan Yabancı Yatırımlar üzerinde etkili olduğunu bulmak için her bir boyutu birbirinden bağımsız ayrı ayrı kullandım. Hofstede’in boyutları güç uzaklığı, maskülenlik, belirsizlikten kaçınma, müsamaha, bireycilik ve uzun vade oryantasyonudur.
Birinci yaklaşımın sonuçları ülke boyutunda kültürel farklılığın Doğrudan Yabancı Yatırımları düşürdüğünü ortaya koydu. Boyutsal analizde ise ülkeler arasındaki maskülenlik, belirsizlikten kaçınma ve müsamaha boyutlarındaki farklılıkların Doğrudan Yabancı Yatırımları düşürdüğü gözlemlendi. Genel kanının aksine, güç uzaklığı ve uzun vade oryantasyonu gibi bazı kültürel boyutlardaki farklılıklar ülkeler arasındaki Doğrudan Yabancı Yatırımları artırıyor. Dolayısıyla çalışmamız firmaların doğrudan yabancı yatırım tercihinde bulunurken farklı kültürel faktörleri göz önünde bulundurduğunu ispat eden bir çalışmadır. Diğer yandan, kültürün bütün boyutlarının Doğrudan Yabancı Yatırımlar üzerinde etkiye sahip olmadığını bireyselcilik boyutu üzerinden istatistiksel olarak anlamlı bir sonuç elde edemeyerek bulduk. Ayrıca bu çalışma, bildiğimiz kadarıyla OECD ülkeleri için kültürel farklılıkların Doğrudan Yabancı Yatırım tercihlerini etkilediğini ortaya koyan ilk çalışmadır.
Anahtar Kelimeler: Doğrudan Yabancı Yatırım, Kültürel Farklılıklar, Çekim Modeli Hofstede Indeksi, Yabancı Sermaye Akışları
3 TABLE OF CONTENTS
I.INTRODUCTION ... 5
II.LITERATURE REVIEW ... 6
A) Standard Gravity Variables as Determinant of FDI ... 6
B) Cultural Distance as Determinant of FDI ... 8
III.DATA ... 9
A) FDI and GDP ... 11
B) Gravity Variables ... 12
C) Culture Variables ... 13
D) Political Risk Variables ... 14
IV.METHODOLOGY ... 14
V.RESULTS ... 18
VI.CONCLUSION ... 24
REFERENCES ... 26
4 INDEX OF FIGURES
Figure 3.1 FDI Flows of OECD Countries ... 12
INDEX OF TABLES Table 3.1 List of Source and Receipt Countries ... 10
Table 4.1 Descriptive Statistics of Cultural Difference Variables ... 18
Table 5.1 Aggregate Approach (Model 1)... 20
Table 5.2 Dimensional Approach (Model 2) ... 22
5
I. INTRODUCTION
In this paper, I examine how the cultural distance affects foreign direct investment (FDI) flows with the “Gravity Model”1
. In my analysis, I focus on FDI flows of OECD countries 1996-2012 years. My study looks on cultural differences in two different models with Hofstede’s six dimensional dataset2
. In first model, I use cultural distance as an aggregate variable which is compounded by every dimensions of dataset on country level. In the second model, I use difference of every six dimension between countries in the Hofstede’s dataset separately one by one to find out which dimensions have effect on the FDI flows. According to my findings, first model indicate that cultural difference reduces FDI flows on aggregate level. On second model, my results vary according to the dimension. These findings show that firms are considering cultural facts when they decide to invest in another country. Last, to the best of my knowledge, my framework is the first to prove that cultural distance is a determinant for FDI flows of OECD countries.
Culture is considered as one of the most prominent aspect for determining social facts for social scientists. According to Acemoglu (2012), culture is viewed by some social scientists
as a key determinant of the values, preferences, and beliefs of individuals and societies and these differences play a key role in shaping economic performance. For that matter,
economists have investigated the relation between culture and economic outcomes such as FDI inflows, growth and alike. In the aforementioned studies as well as in many others, the challenge is determining country’s culture. For instance, Sathe and Schachler (2006) use religion as an indicator of culture. Siegel et al. (2012) use their own survey to describe culture in several dimensions.
In my study, I am going to use Hofstede’s dataset which is compiled by Geert Hofstede and his research team3. In this database culture is defined in six dimensions. These dimensions are named as power distance, individualism, masculinity, uncertainty avoidance, long term
1 Gravity model is used by Tinbergen (1962) for the first time. Detailed information will be provided in fourth
section.
2
For detailed information: http://geert-hofstede.com/national-culture.html
6
orientation and indulgence4. Hofstede points that these values are relative scores for countries and cultural values don’t vary over time.
My paper is different from the literature in the following ways. First, I construct the aggregate cultural distance variable by using Hofstede's the six dimesional dataset. Studies mostly use Hofstede's first four dimensions that are power distance, masculinity, individualism and uncertainty avoidance whereas I include "long term orientation" and "indulgence" dimensions of Hofstede's data into the aggregate cultural distance variable as well. Second, I am one of the few to relate the cultural distance to country level FDI flows using the Gravity Model. Third, to the best of my knowledge, I am the only one to find which dimension in cultural distance affects FDI inflows for Hofstede’s dimensions.
The rest of the paper is organized as follows. In section 2, I am going to provide literature review over FDI and culture. Section 3 represents descriptive information about data. Model specification is carried out in Section 4 followed by results in section 5 and conclusion in section 6.
II. LITERATURE REVIEW
There is a vast literature that relates determinants of FDI flows in the literature. I divide my literature review in two parts. In first part, I summarize studies which investigate determinants of FDI with standard gravity variables which I am going to use in my model. In second part, I provide studies which use cultural distance as a determinant of FDI.
A. Standard Gravity Variables as Determinant of FDI
Gravity model has been a key framework for analyzing the determinants of FDI. For instance, Yeyati et al. (2003) contribute on regional integration and the location of FDI with a Gravity Model. They focus on 20 OECD country FDI flows into 60 recipient countries between 1982-1999. They find common membership in free trade area increases bilateral stocks of FDI about 27 percent. Also, opening policies are important for attracting FDI flows.
7
Eichengreen et al. (2007) also focus on FDI flows of OECD countries with gravity model. They study the period 1988-2002, and FDI flows from 29 OECD source country into 63 both OECD and non-OECD countries. They use instrumental estimation (IV) method with classical gravity variables and China’s FDI. The authors find that corruption and physical distance has negative impact for FDI flows. On the other hand, common language, common land border, colonial relationship, access to sea lanes, and the existence of a currency union all have positive impact for standard gravity variables.
Liu (2010) studies intellectual property rights (IPRs) as a determinant of FDI. The author proposes eight hypotheses about the determinants of FDI flows into China. He picks 18 source countries in the 1988-2006 period with Generalized Method of Moments (GMM) approach over a gravity model. He finds that countries with higher export ratio and solid IPR protection tends to invest more. Also, when source country has relatively higher labor costs, they invest more in China. However, he totally excludes geographic distance and cultural distance from their model. Because, the author suggests that it may provide misleading information for his estimation.
Mottaleb (2007) focuses on FDI's effect on growth rate and GDP, growth rate of GDP per capita and modern infrastructural facilities as determinants of FDI. He focuses on 60 developing countries in 2003, 2004 and 2005. These countries are selected from Asia, Africa and Latin America. He uses instrumental variable estimation method with fixed and random effects. His results represent that top FDI recipient countries in 2005 have large domestic market with high GDP growth rate. He uses telephone mainline and internet users as measure of modern communication facilities. In the end, he concludes that high GDP growth, large GDP and modern communication techniques improve FDI inflows.
8
B. Cultural Distance as Determinant of FDI
Culture has been investigated by several methods in the literature. Shenkar (2012) provides a thorough review about the effect of cultural distance. He points that cultural distance is used in FDI literature for three purposes. First, cultural distance explains the FDI location and the sequence of investment by multinational enterprises. Second, it is used to predict the choice of mode of entry into foreign markets. Last, cultural distance measures the performance and the failure of MNE affiliates in markets. Finally, the author points that every cultural dimension in the datasets may not affect FDI flows.
Liu et al. (1997) is the first to proxy culture with the Hofstede's data for FDI flows. They study economic, political and cultural determinants of FDI inflows in China with panel data. They regress China’s FDI over several variables with generalized least squares (GLS) method. They take the sum of the absolute values of cultural dimension differences as aggregate variable. They find that FDI inflows have positive relation with relative real exchange rates, real exports, real imports and negative for real wage rates. Finally, cultural difference has a significant negative effect on pledged FDI case. However, the effect of cultural distance on “realized FDI” is insignificant.
Sathe and Schachler (2006) search social and cultural factors that determine the FDI flows into India and causal effect of FDI on growth. They use linear estimation with data covering the 1991-2002 period. For cultural determinants, they take six religion dummies as India is a cosmo-cultural country. In the end, they find that FDI has positive effect for growth in India and cultural distance seems unimportant for FDI in their analysis.
Davies et al. (2007) investigate panel fixed effects with vector decomposition method over three different FDI datasets which run from 1980 to 2000. They include Hofstede's five dimensions as regressors for host country. Authors find that the induction of fixed effects has a significant impact over the time varying variables. For cultural variables, they find Hofstede's five dimensions as significant determinants of FDI. However, this paper doesn't focus on cultural differences between source and destination countries. They use cultural dimensions as proxies for destination country only.
9
The most important work among all of these studies for FDI is Siegel et al. (2012). Main focus of that paper is the effect of egalitarianism over FDI flows. They use Schwartz's value survey which covers 1988-2005 period. To make analysis, they use ordinary least squares (OLS) regression on different cultural variables separately. Results indicate that cultural distance affects firms in their FDI decisions, especially egalitarianism. They accentuate that culture is not the sole factor which affects the culture, but one of the prominent one.
Last, Keillor et al. (2009) use gravity model for investigating the role of political risk and culture over FDI. They use ratio of FDI over GDP as dependent variable. For independent part, they use Hofstede’s six dimensions of culture and Euro Money’s political risk index. They use every cultural dimension of Hofstede as a variable in the model. They find only "Uncertainty Avoidance" and "Political Risk" has role over FDI flows. However, their research just focuses on U.S. firms and they don’t include any other variables for determinant of FDI.
My study distinguishes itself from the literature as it is tests the significance of cultural distance between source and recipient country in explaining the FDI flows. Moreover, it is the first to combine Hofstede's all six dimensions with Euclidian distance to generate a composite cultural difference index to study the relation between culture and FDI flows. Last, it is the first to study the effects of country-level cultural differences on FDI for OECD countries.
III. DATA
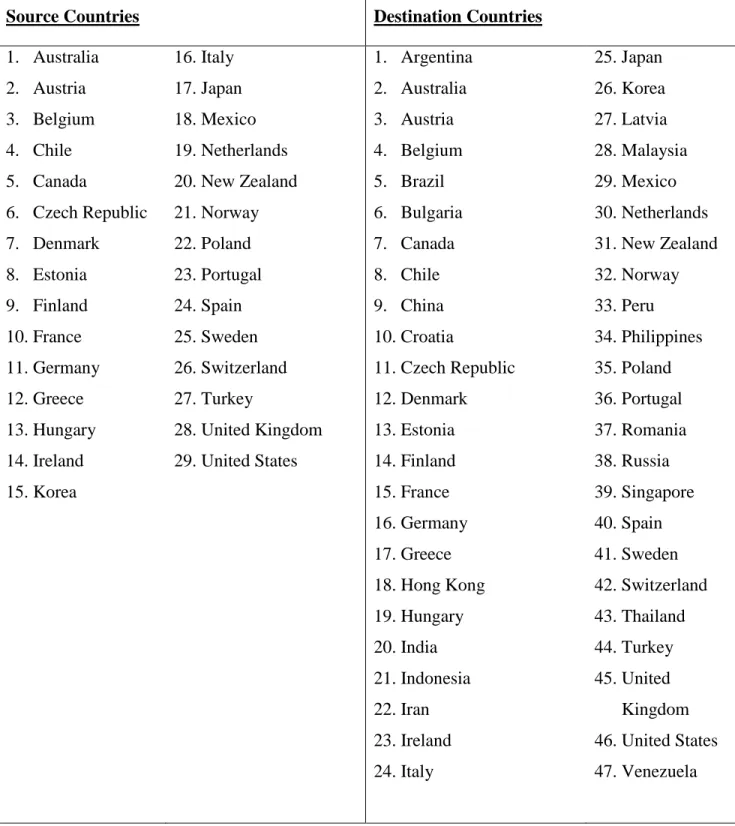
My framework contains 29 OECD source countries and 47 OECD and non-OECD receipt countries between 1996-2012. Country names for source and receipt countries are listed below in table 1.
10
Table 3.1: Source and Receipt Countries
Source Countries Destination Countries
1. Australia 2. Austria 3. Belgium 4. Chile 5. Canada 6. Czech Republic 7. Denmark 8. Estonia 9. Finland 10. France 11. Germany 12. Greece 13. Hungary 14. Ireland 15. Korea 16. Italy 17. Japan 18. Mexico 19. Netherlands 20. New Zealand 21. Norway 22. Poland 23. Portugal 24. Spain 25. Sweden 26. Switzerland 27. Turkey 28. United Kingdom 29. United States 1. Argentina 2. Australia 3. Austria 4. Belgium 5. Brazil 6. Bulgaria 7. Canada 8. Chile 9. China 10. Croatia 11. Czech Republic 12. Denmark 13. Estonia 14. Finland 15. France 16. Germany 17. Greece 18. Hong Kong 19. Hungary 20. India 21. Indonesia 22. Iran 23. Ireland 24. Italy 25. Japan 26. Korea 27. Latvia 28. Malaysia 29. Mexico 30. Netherlands 31. New Zealand 32. Norway 33. Peru 34. Philippines 35. Poland 36. Portugal 37. Romania 38. Russia 39. Singapore 40. Spain 41. Sweden 42. Switzerland 43. Thailand 44. Turkey 45. United Kingdom 46. United States 47. Venezuela
11
A. FDI and GDP
The FDI data is from the OECD foreign direct investment statistics5. In their database, OECD makes a distinction between inward and outward FDI. I used FDI inflows for my approach, like Siegel et al. (2012)6 7. For FDI inflows, OECD states that "an effective voice in the management, as evidenced by an ownership of at least 10 per cent, implies that the direct investor is able to influence or participate in the management of an enterprise. It does not require absolute control by the foreign investor." As firms have influence with 10 per cent share, it is convenient to think cultural difference on firms’ influence base.
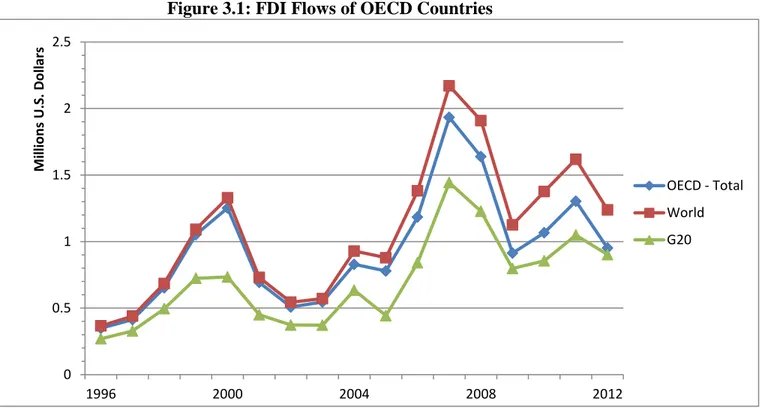
OECD designed every FDI transactions according to the partner country in the value of US dollar. In my gravity model, I take the logarithm of FDI as the dependent. FDI flows of OECD countries according to the years are shown below in the figure 1.
For real GDP data and GDP per capital data, I use World Development Indicator (WDI)
database8. The variables are constant in 2005 US dollars. In my framework, I take log of GDP and log of GDP per capita for both source country and recipient country as independent variables separately.
5 For the source http://www.oecd.org/ 6
In the glossary of OECD, Inward FDI is described as "A direct investment enterprise(Inward investment) is define as an incorporated or unincorporated enterprise in which a foreign investor owns 10 per cent or more of the ordinary shares or voting power of an incorporated enterprise or the equivalent of an unincorporated enterprise.”
7
Siegel et. al.(2012) used outward FDI when inward FDI is missing in data
12
Figure 3.1: FDI Flows of OECD Countries
B. Gravity Variables
For standard gravity variables, I use the database which is provided by Rose (2002). The variables are the logarithm of physical distance, logarithm of combined land area, landlockedness dummy, number of islands dummy, common currency dummy and common colonizer dummy. However, Rose's dataset covers 1948-1997. I extent Rose’s dataset to 2012. These gravity variables have constant values since 1988 except common currency variable as zone established in 1999. I updated my data according to Euro-zone entrance years of countries. First, I replaced dummy of the common currency of first ten Euro-zone countries Belgium, Germany, Ireland, Spain, France, Italy, Netherlands, Austria, Portugal and Finland. Also, note that Greece joined to EMU in 2001 and Estonia was accepted in Euro-Zone in 20119.
Common language dummy is another important variable for gravity model frameworks. However, language can be seen as a cultural phenomenon for countries and it may lead to
9 For euro-zone country information http://www.eurozone.europa.eu/euro-area/topics/the-euro
0 0.5 1 1.5 2 2.5 1996 2000 2004 2008 2012 M ill io n s U. S. D o llar s OECD - Total World G20
13
collinearity problem with cultural distance variable. So, I am not going to use it in both aggregate and dimensional approaches.
C. Culture Variables
The last and the most prominent variable is culture. I gathered culture variables from Hofstede's website. In Hofstede's data there are six dimensional variables: Power Distance Index (PDI), Individualism versus Collectivism (IDV), Masculinity versus Femininity (MAS), Uncertainty Avoidance Index (UAI), Indulgence versus Restraint (IVR) and Long term Orientation (LTO)10.
The data is scaled from 0 to 100 for every dimension. Power distance index represents less powerful members of society accept that power is allocated unequally. Higher values in that dimension mean society has strong hierarchies and large gaps in authority and respect. Individualism indicates the degree of individuals integrated into groups. When a country scores high on that dimension, it means there is a lack of connection between people and little sharing of responsibility beyond family. This dimension totally excludes political groups as Hofstede points. Third, masculinity shows societies depending on traditional male and female roles. When country scores high, there is a distinction between work of men and women like Japan. Uncertainty avoidance is a measure of society's tolerance for uncertainty and high scored society members try to avoid ambiguous situations whenever possible. Long term orientation is the sign of society's long standing traditions and values. When a society scored low, it will be short term oriented society. Lower values in this dimension means there is a social pressure toward spending. Last, high score on indulgence represents society's free gratification of basic and natural human drives which related to having fun. Leisure has importance in societies which have higher values in this dimension. Opposite of indulgence is defined with restraint in Hofstede's definitions11.
Moreover, Barkema and Vermeulen (1997) prove that cultural values of Hofstede’s are stable over time. They study on International Joint Ventures of Dutch firms 1966-1994 period. They use Hofstede’s first five dimensions as an aggregate variable to measure
10
For detailed descriptions http://geert-hofstede.com/dimensions.html
14
cultural distance with conventional binomial logit models. Their results indicate that effect of cultural distance does not reduce over time. This finding is important as my data covers long period for analysis.
D. Political Risk Variable
To obtain risk variable, I use the indices of Worldwide Governance Indicators. This data covers the period 1996-2012. However, 1997, 1999 and 2001 values are missing in the data. So, I have interpolated the data according to other years12. Data focuses on six dimensions: "Control of Corruption", "Government Effectiveness", "Political Stability", "Regulatory Quality", "Rule of Law" and "Voice and Accountability". Data scales between -2.5 to +2.5 and absolute high points mean less risk. I am going to take the averages of these six dimensions for generating risk for both source and recipient country in my model13 .
IV. METHODOLOGY
Traditional gravity model named after Newton’s Law of Gravitation14, explains factors of trade between two countries. In that model, distance is considered as a phenomenon that reduces potential trade flows. Tinbergen (1962) is the first to use gravity model to explain the determinants of trade flows in the literature. After Tinbergen (1962), traditional gravity model has been enhanced by proxies that could represent various trade frictions, and, dummies that could represent the difference/similarity between countries like common language, landlockedness etc.. As we have mentioned in the previous section, gravity model has also been used to study FDI flows. While classical gravity model suggests using OLS method, several frameworks argue that standard OLS method may cause bias if there are fixed or random effects in the model.
Fixed effect models assume that the unobserved heterogenous component in the regression is constant over time. Standard approach for that problem is solved by using country pair fixed effects. On the other hand, Matyas (1997) states that there may be a business cycle
12 For instance, I took the mean of 1996 and 1998 for 1997 year. I have done same for the rest. 13
Source http://databank.worldbank.org/data
15
effect that differs from year to year. For avoiding that fact, we need to use time fixed effects. However, using country-pair fixed effects may cause some problems. Gomez and Milgram (2010) state that any explanatory variable which doesn't vary across time for country pairs will be perfectly collinear with the country-pair fixed effects. For our case, it will cause to drop important gravity variables like landlockedness, common colony dummies etc. 15.
Eichengreen et. al. (2007), also realize that using country-pair fixed effects may cause collinearity problems in the model. The authors suggest using measures of country risk instead of country-pair specific institutional variables. So, I am going to solve that problem by including country risk variables for both the source and destination country.
On the other hand, some authors assume that the unobserved component of the regression may be distributed randomly in the gravity model like Kavallari et al. (2008). For these situations, they suggest to use random effects model on panel data.
To decide between fixed or random effects, standard approach assumes to run Hausman test16. The Hausman test suggests that in all cases I should use fixed effect. So, I am going to use fixed effect estimation with year dummies17.
Thus, my model is a gravity model using least square dummy variables (LSDV) method with time-year dummies.
15 If the model has fixed or random effects, then standard OLS estimation cause biased and inconsistent
estimate. For that reason, I run F-test to find time fixed effects and Breusch-Pagan Lagrange Multiplier (LM) test to find random effects in my model. In every estimation, my results indicate that the model includes time fixed effects. Additionally, I reject null hypothesis in every estimation for Breusch-Pagan Lagrange Multiplier (LM) test which means standard OLS estimation causes bias.
16
I followed the approach of Gomez and Milgram (2010) in these steps.
17
Siegel et al. (2012) also used standard OLS estimation for cultural dimensions. However, they reported these three fixed effects as a robustness check.
16
( ) ( ) ( ) ( ) ( ) ( ) ( )
FDI: Foreign Direct Investment RGDP: Real GDP
RGDPPC: Real GDP per Capita
DIS: Distance between source country and receipt country. CCD: Common Currency Dummy
LLD: Landlockedness Dummy ID: Number of Islands
PLA: Product of Land Areas COD: Common Colony Dummy LBD: Landborder Dummy RISK: Risk of country CD: Cultural Distance
In the above model, i represents the source country and j represents the receipt country. β values are the coefficients of standard gravity model and risk variables. γ is the coefficient for the cultural distance. For aggregate cultural distance index, γ is just one parameter. On the other hand, for dimensional cultural distance approach, it is a 6x1 vector each row corresponding to one of Hofstede's six cultural dimensions. α is the vector of the time dummies’ coefficients. To avoid confusion, I am going to refer Model I and Model II in my analysis. Model I uses cultural distance at aggregate level and Model II uses cultural distance at dimensional level.
For using an effective aggregate cultural distance variable, Drogendijk and Slangen (2006) examine five cultural distance measures over MNEs through greenfield or acquisition with several indices. They use both Hofstede (1980), Kogut and Singh (1988) and Schwartz (1994) frameworks. They use maximum likelihood analysis over 246 foreign expansions by Dutch MNEs. They find that Hofstede’s data can be used with Euclidian index for five
17
dimensions. So, I am going to use Euclidian distance index with six dimensions of Hofstede’s data.
I am going to use Euclidian index form to measure cultural distances between countries. Euclidian distance approach is a generalized form of Kogut and Singh (1988) index. Kogut and Singh (1988) index is shown in equation below
∑ {( )
and Euclidian index is shown in equation below
√∑ {( )
In these equations CDij is the cultural distance between country i and j. Iki represents source country i score on the k th cultural dimension. On the other hand, Ikj shows receipt country
j's score on the k th cultural dimension. Vk stands for variance of dimension's score. On the dimensional estimation, I am going to use Euclidian distance too18 . Descriptive statistics of cultural differences between countries are given below.
18
Siegel et. al. (2012) also used dimensional approach with his own dimensions. However, they used square of the differences between the countries’ score only.
18
Table 4.1: Descriptive Statistics of Cultural Distance Between Countries
Variable Mean Std. Dev. Max. Min. Median
Power Distance Dif.
Masculinity Dif.
Uncertainty Avoidance Dif.
Individualism Dif.
Long Term Orientations Dif.
Indulgence Dif.
Aggregate Cultural Distance Dif. 1.10 1.22 1.11 1.12 1.16 1.11 3.28 0.80 0.89 0.81 0.79 0.83 0.81 1.05 4.17 4.44 3.91 3.32 3.89 3.97 6.12 0 0 0 0 0 0 0.39 0.98 1.09 0.98 0.97 0.99 0.95 3.30
V. RESULTS AND ANALYSIS
Table 1 summarizes the results of the standard LSDV estimation for model 1. The results are in the line with the results obtained in the literature. Coefficients of physical distance, islands in the recipient country, product of land areas and landlockedness are significantly negative for FDI flows. This indicates that the FDI flows reduce when distance between source and recipient country increases. On the other hand, geographical conditions have effect on FDI flows. When countries have no access to sea, they attract less FDI rather than countries which have borders to sea. This attraction may be the advantage of sea transport for sea border countries. On the other hand, destination countries without islands attract
19
more FDI rather than countries with islands. Last, higher productive land areas in the recipient country repels FDI flows
On the other hand, coefficients of currency union, common borders and common colonial relationship dummies are significantly positive. Firms are eager to invest when the destination countries have same currency and colonial relationship. Also, neighborhood countries attract more FDI when they are sharing the same border. As we have found that distance reduces FDI flows, sharing the same border increases FDI flows between countries.
Coefficients of real GDP for both source and destination countries are significantly positive. So, larger markets send and receive more FDI rather than smaller markets.
Risk level of the countries also has impact on FDI flows. As higher values indicate lower risk that means both source and destination countries with lower risks are attracting more FDI rather than countries with higher risks.
My results agree with the findings in the literature. For instance, just like Eichengreen et al. (2007)19 they find similar results for real GDP, standard gravity variable and risk results. Contrary to that paper, my results indicate that coefficient of GDP per capita of source country is significantly negative. On the other hand, Liu (2010) find GDP per capita of source country has statistically negative in his analysis like our results. He claims that investments from countries which have small GDP per capita increased recently in his sample. This finding may also prevail for our research too. That means firms of OECD countries who have lower GDP per capita invest more in FDI recently. On the other hand, the coefficient of GDP per capita of recipient country is significantly positive which indicates firms see more advantage to invest in countries with higher GDP per capita.
20
Table 5.1: Aggregate Approach (Model I)
Variables Coefficient St. Err.
Distance
Product of Land Areas(log) RGDP of Source Country(log) RGDP of Receipt Country(log) RGDPPC of Source Country(log) RGDPPC of Receipt Country(log) Land Border Dummy
Landlockedness Number of Islands
Common Colonizer Dummy Strict Currency Union Dummy Risk for Source Country Risk for Receipt Country Cultural Difference Constant -0.62 -0.05 0.78 0.93 -0.59 0.37 0.65 -0.18 -0.23 2.66 0.21 1.16 0.80 -0.05 -36.07 0.02 0.01 0.02 0.01 0.05 0.03 0.08 0.04 0.04 0.45 0.06 0.06 0.05 0.02 0.55 Number of Observations Adjusted R2 12745 0.648
All coefficients without stars are significant at 0.01 level
For aggregate cultural distance variable, the coefficient is statistically significant and negative. So, when cultural difference between countries increases, FDI flows between countries decline. Hence, firms invest more on countries which share cultural similarities with destinations countries. My findings satisfy findings in the literature like Liu et al. (1997) for aggregate cultural distance variable. They find aggregate cultural difference variable with Hofstede’s first four dimensions has statistically negative effect on “pledged FDI”. However, they find no significant effect for “realized FDI”. My model is the first to
21
indicate that aggregate cultural difference has statistically negative effect on “realized FDI” with Hofstede’s six dimensions.
Table 2 shows the regression for the Model 2. In both models, the results of GDP, gravity and risk variables are nearly the same. The only difference in the second model is that common currency dummy is statistically significant at 0.05 level instead of 0.01 level.
On dimensional level, coefficients of difference on uncertainty avoidance, masculinity and indulgence are statistically negative. Uncertainty avoidance represents the societies’ acceptance level of change and risk. That means firms prefer to invest more on countries which have similar risk perceptions. Higher masculinity refers to defined distinction between men’s work and women’s work. That may be the reason of firms’ decisions of employment. Firms may need women workers and masculine countries don’t allow employment of women in their societies. So, FDI reduces when perception of women’s work differentiates between source and recipient countries. Last, difference on indulgence indicates that firms consider gratification on the destination countries. Hence, firms are choosing more similar countries to their life style and differences in gratification between source and recipient countries reduce FDI flows.
Every cultural difference doesn't have negative impact over FDI flows. For power distance dimension, the differences between countries have statistically positive coefficient for FDI flows. It may be the cause of new destinations for FDI. In other words, source countries have started to invest more on countries which more bureaucratic and state depended. Especially, when former communist countries (like China) integrated into the international business transactions, difference in power distance increased too much between source and destination countries. Therefore, difference in the power distance has been neglected by the firms and caused positive effect for FDI flows20.
20
For instance, Romania, China, Russia and Malaysia scored over 80 for power distance index. On the other hand, countries like Australia, U.S.A, Sweden etc. scored lower than 40.
22
Table 5.2: Dimensional Approach (Model II)
Variables Coefficient St. Err.
Distance
Product of Land Areas(log) RGDP of Source Country(log) RGDP of Receipt Country(log) RGDPPC of Source Country(log) RGDPPC of Receipt Country(log) Land Border Dummy
Landlockedness Number of Islands
Common Colonizer Dummy Strict Currency Union Dummy Risk for Source Country Risk for Receipt Country Power Distance Difference Masculinity Difference Uncertainity Avoidance Dif Individualism Difference
Long Term Orientation Difference Indulgence Difference Constant -0.65 -0.05 0.77 0.92 -0.60 0.39 0.56 -0.23 -0.24 2.53 0.16** 1.15 0.84 0.11 -0.13 -0.09 0.01* 0.03*** -0.12 -35.77 0.02 0.01 0.02 0.01 0.05 0.03 0.08 0.04 0.04 0.45 0.06 0.06 0.05 0.02 0.02 0.02 0.02 0.02 0.02 0.55 Number of Observations Adjusted R2 12745 0.650
Coefficients without stars are significant at 0.01 level (*) means coefficient is not significant.
(**) means coefficient is significant at 0.05 level (***) means coefficient is significant at 0.1 level
23
Our power distance variable result may seem to challenge Siegel et al. (2012) as they find egalitarianism distance variable has statistically negative effect on FDI flows. However, Siegel et al. (2012) points that their egalitarianism variable differs from Hofstede’s power distance variable as power distance emphasizes fear of authority. So, our findings may indicate different results as these two dimensions have different perceptions. On the other hand, firms’ behavior may be changed during years. Siegel et al. (2012) focus 1980-2004 years in their study which includes earlier periods. As my study focus 1996-2012 period, the firms may have changed their investing incentives after decades.
On the other hand, difference in long term orientation also has positive coefficient at 0.1 significance level. This fact may also be explained by the emergence of new economies21. However, the coefficient of long term orientation is too small in comparison with other cultural dimensions. That means difference of long term orientation has relatively small effect on FDI flows.
Finally, some cultural differences have no effect over FDI flows. My results don't give any significant indicator for individualism. As individualism represents personal perception of someone in the society, firms may not care about the individualism when they are making decision for FDI destinations. This result satisfies Shenkar (2012) as he points every cultural dimension may not be effective on FDI flows.
My findings challenge Keillor et al. (2009) as he iterated only uncertainty avoidance in the Hofstede's data has effect on FDI flows. However, as my results indicate five of the Hofstede's dimensions have effect on FDI flows, the difference may be occur as Keillor et al. (2009) focused only U.S. firms. Also, he doesn't focus on the differences between countries. However, Hofstede’s dataset represents comparative scores for each country22. Moreover, as my data includes many countries and focus on differences, it probably brought more accurate results.
21 For instance, countries like China, South Korea, Russia scored over 80 in long term orientation index. 22
Hofstede notes in his website that “The country scores on these dimensions are relative - societies are compared to other societies.” Source http://www.geerthofstede.nl/dimensions-of-national-cultures
24
On the other hand, Davies et al. (2007) points that five dimensions23 of Hofstede’s dataset are significant determinants of FDI. These findings are also line with my findings except individualism variable as I find no significant result for individualism.
VI. CONCLUSION
My study has investigated determinants of FDI with standard gravity variables and cultural distance variables with 29 OECD source country between 1996-2012. Our results indicate for standard gravity variables distance, product of land areas, landlockedness and real GDP per capita have statistically negative effect on FDI flows. On the other hand, larger economies (which is captured by real GDP), GDP per capita of source country, becoming in same currency union and colony has positive effect on FDI flows. Also, lower political risks for both recipient and source country increases FDI flows between countries.
For cultural distance variables, I use Hofstede’s six dimensional dataset in my analyses with two different models. In first model, I use cultural distance as an aggregate variable which is compounded by Hofstede’s six dimensions. Best to my knowledge, this thesis is the first to combine Hofstede’s six dimensions as an aggregate variable in cultural difference analysis. In second model, cultural dimensions have been used one by one in our approach.
First model indicates that cultural distance on aggregate level has negative effect on FDI flows between countries. On second model, cultural dimensional variables have given different results for FDI flows. The general hypothesis for cultural difference states that cultural differences either have negative impact or no impact over FDI flows. However, my results show that some of the cultural differences may cause a positive effect on FDI flows like differences in “Power Distance Index” and “Long Term Orientation Index”. This may be the effect of emerging economies like China in last two decades. Differences in “uncertainty avoidance”, “masculinity/femininity” and “restraint/indulgence” reduce FDI flows between countries. My results don’t find any significant result for individualism.
23 Five dimensions are power distance, masculinity, uncertainty avoidance, long term orientation and
25
Our results indicate that firms’ are considering different cultural factors according to their investment decisions on country level. Finally, our study shows that cultural difference is a determinant for firms of OECD countries.
26
REFERENCES
1. Acemoglu, D. (2009). Introduction to modern economic growth. Princeton: Princeton University Press.
2. Anderson, J. E. (2010). The gravity model (No. w16576). National Bureau of Economic Research.
3. Barkema, H. G., & Vermeulen, F. (1997). What differences in the cultural backgrounds of partners are detrimental for international joint ventures?. Journal
of international business studies, 28(4) 845-864.
4. Davies, R. B., Ionascu, D., & Kristjánsdóttir, H. (2008). Estimating the impact of time-invariant variables on FDI with fixed effects. Review of World Economics,
144(3), 381-407.
5. Drogendijk, R., & Slangen, A. (2006). Hofstede, Schwartz, or managerial perceptions? The effects of different cultural distance measures on establishment mode choices by multinational enterprises. International Business Review, 15(4), 361-380.
6. Eichengreen, B., & Tong, H. (2007). Is China's FDI coming at the expense of other countries?. Journal of the Japanese and International Economies, 21(2), 153-172. 7. Eurozone. (2015). Euro-zone Adoption by Countries. Retrieved from
http://www.eurozone.europa.eu/euro-area/topics/the-euro
8. Glick, R., & Rose, A. K. (2002). Does a currency union affect trade? The time-series evidence. European Economic Review, 46(6), 1125-1151.
9. Gómez, E., & Milgram, J. (2010). Are estimation techniques neutral to estimate gravity equations? An application to the impact of EMU on third countries’ exports. mimeo.
10. Hofstede, G. (1980). Motivation, leadership, and organization: do American theories apply abroad?. Organizational dynamics, 9(1), 42-63.
11. Hofstede, G., Hofstede, G. J., & Minkov, M. (2010). Cultures and organizations:
Software of the mind : Intercultural cooperation and its importance for survival
27
12. Kavallari, A., Maas, S., & Schmitz, P. M. (2008, August). Explaining German imports of olive oil: evidence from a gravity model. In European association of
agricultural economists international congress.
13. Keillor, B., Hauser, W., & Griffin, A. (2009). The relationship between political risk, national culture and foreign direct investment as a market entry strategy: Perspectives from US firms. Innovative Marketing, 5(1), 48-54.
14. Kogut, B., & Singh, H. (1988). The effect of national culture on the choice of entry mode. Journal of international business studies, 19(3), 411-432.
15. Lavrakas, P. (2008). Encyclopedia of survey research methods. Thousand Oaks, Calif.: SAGE Publications.
16. Levy-Yeyati, E. L., Stein, E., & Daude, C. (2003). Regional Integration and the Location of FDI.
17. Liu, W. H. (2010). Determinants of FDI inflows to China: an empirical analysis of source country characteristics. In 2010 Taipei International Conference on Growth,
Trade and Dynamics, Taipei, Tiiwan.
18. Liu, X., Song, H., Wei, Y., & Romilly, P. (1997). Country characteristics and foreign direct investment in China: A panel data analysis. Weltwirtschaftliches
Archiv, 133(2), 313-329.
19. Mottaleb, K. A. (2007). Determinants of foreign direct investment and its impact on economic growth in developing countries. Munich Personal Re PEc Archive,
MPRA Paper No.9457.
20. OECD. (2015). FDI flows (indicator). [Accessed on 11 May 2015]. Retrieved from https://data.oecd.org/fdi/fdi-flows.htm
21. Sathe, S., & Handley-Schachler, M. (2006). Social and cultural factors in FDI flows: evidence from the Indian states. World Review of Entrepreneurship,
Management and Sustainable Development, 2(4), 323-334.
22. Shenkar, O. (2012). Cultural distance revisited: Towards a more rigorous conceptualization and measurement of cultural differences. Journal of International
Business Studies, 43(1), 1-11.
23. Siegel, J. I., Licht, A. N., & Schwartz, S. H. (2012). Egalitarianism, cultural distance, and FDI: A new approach. Organization Science, Forthcoming.
28
24. Mátyás, L. (1997). Proper econometric specification of the gravity model. The
world economy, 20(3), 363-368.
25. World Bank. (2015). World Development Indicators. Retrieved from http://databank.worldbank.org/data/views/variableSelection/selectvariables.aspx?so urce=world-development-indicators
26. World Bank. (2015). Worldwide Governance Indicators. Retrieved from
http://databank.worldbank.org/data/views/variableSelection/selectvariables.aspx?so urce=world-development-indicators