Determination of trace element levels in human scalp hair
in occupationally exposed subjects by XRF
Y. Dede,1*H. N. Erten,1A. Zararsiz,2N. Efe2 1Bilkent University, Department of Chemistry, Ankara, Turkey 2Ankara Nuclear Research and Training Center, Besevler, Ankara, Turkey
(Received July 18, 2000)
Trace element levels in hair of individuals living in urban areas were determined by energy dispersive XRF. Two groups of subjects were investigated, the first group was assumed to be from a healthy environment, the other one was exposed to a high level of contamination due to working conditions. The results were compared to data reported in the literature. The concentrations of Ca, Fe, Cu, Zn and Pb in the scalp hair were determined and the correlation between hair trace element levels and environmental effects was discussed. The results given by the second group show that environmental exposure effects hair trace element levels which are related to body trace element concentrations.
Introduction the body up to a time equal to the moment the fiber started to grow. In this way, the hair analysis provides data for both the current and near past status of the subject.
X-ray fluorescence technique is widely applied for the analysis of inorganic constituents in light and heavy matrices, such as biological and geological samples. However, some problem arises for the quantitative analyses due to interelement and/or matrix effects.13
In this study we have determined hair trace element levels of two groups of subjects in Ankara, Turkey, the first has been assumed to be in normal and healthy conditions and was taken as reference group, and the other to be in contact with environmental exposure due to working conditions.
During the past three decades the investigation of trace element concentrations in human scalp hair has become increasingly popular for monitoring environmental exposure,46 evaluating systematic
intoxication,7,8 assessing nutritional status9 and
diagnosing diseases.10 The low level of essential
bioelements such as Zn, Ca, Fe, Cu etc. in human hair is found to be typical of deficiency diseases,11 metabolic
disturbances12 and physiological disorders.13 LAKER14
discussed the advantages of hair analyses for the investigation of trace element levels over other materials such as blood and urine because it is easier to collect and store hair samples then other materials and the trace elements are present in higher concentrations in hair, especially in comparison to those in blood samples.
Both groups are made up of males living in metropolitan area and no member of the healthy group smoked and used hair dyes. On the other hand, the second group of workers were exposed to a high rate of environmental contamination; exhaust gases, metal dusts, some chemicals used in the industry, dyes etc. Strict safety precautions have not been applied by the involved workers.
Experimental
Scalp hair has been divided into five categories according to the different concentrations of elements investigated. Approximately 1 g of hair was cut from the closest distance to the scalp with stainless steel scissors. From the head of each individual not less than 100 strands (distributed over the head) were collected. Hair samples were taken from a total of 33 people living in urban area. Nineteen subjects were assumed to be healthy and 14 of them were workers of automobile industry having high risk of environmental contamination. Samples were washed according to the IAEA standard procedure;15 first with acetone, then
thrice with distilled water and finally with acetone again. In every wash, samples were left in the solvents for ten minutes.
It is known that during the growth phase of hair the follicles of the scalp produce hair at a rate of 0.20.5 mm/day. The growth rate and the trace element levels vary in function of age, race, gender, anatomical location of the hair strand on scalp, season, nutritional status, geographical habitation, medicine intake, color and length of the hair strand and many other factors. With the follicle activity the trace elements in the body participate in the production of the strand and when the hair fiber is close to the surface, it begins to be keratinized. As a result, a sealed, natural and permanent container is formed for the endogeneous trace elements. Therefore, it is generally accepted that trace element concentrations of hair reflect the trace element levels in
Washed samples were dried for 12 hours at 60 °C and ashed at 500 °C for 3 hours in the form of black ash and kept in clean, dry glass vials till the day of analyses. The sample pellets were made under a pressure of 10 tons/inch2with a composition of 75 mg ash and 175 mg
cellulose. All samples were prepared in intermediate thickness.
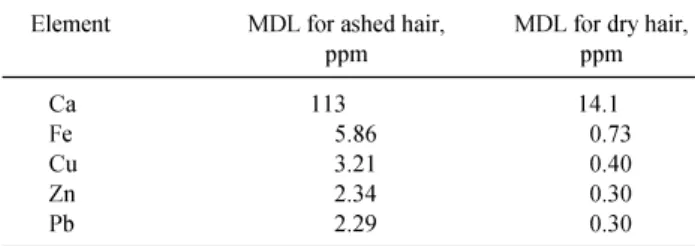
Table 1. MDL for elements of interest in ashed and dry hair Element MDL for ashed hair, MDL for dry hair,
ppm ppm Ca 113 14.1 Fe 5.86 0.73 Cu 3.21 0.40 Zn 2.34 0.30 Pb 2.29 0.30
Sample analyses were carried out using an energy dispersive X-ray fluorescence spectrometer as described in a previous study.16 The system employs an annular 109Cd (370 MBq) radioisotope source for excitation of
samples and the resulting photons are detected by a Si(Li) detector having a resolution of 180 eV at 5.9 keV coupled to a multichannel analyzer and computer as described in Reference 17.
Table 2. Comparison of the measured concentrations with the certified values of NBS standard 1577 (Bovine Liver) Element Certified value, Measured value, Accuracy,
ppm ppm, % (n = 5) Ca 116±4 128±11 10 Fe 184±12 189±10 2.7 Cu 160±10 152±9 5.2 Zn 127±9 121±7 4.9
Standard samples with K, Ca, Fe, Ni, Cu, Zn, Sr, and Pb were prepared from their pure chemical compounds following qualitative analyses of the hair samples. The errors resulting from weighing small quantities of the compounds were minimized by adding the required volume of solutions to pure cellulose (Whatman CF11). The standards were then dried, homogenized and compressed into pellets under the same pressure and in the same form as the sample pellets.
n Number of measurements.
The accuracy of the method was verified by the standard Bovine Liver (NBS 1577), the results are given in Table 2.
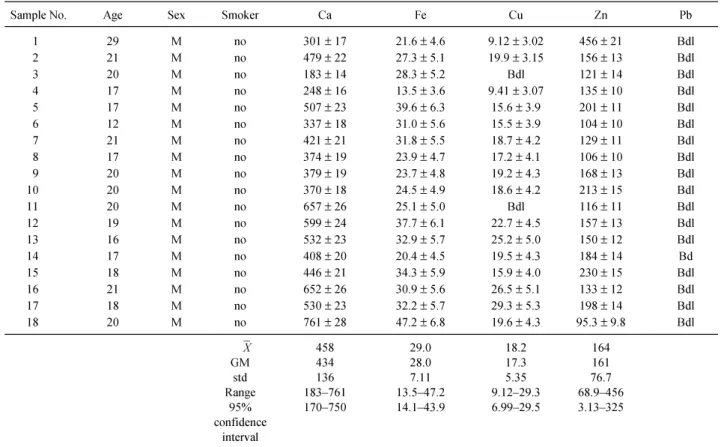
Tables 3 and 4 give the trace element levels determined by XRF in the healthy group and the workers group, respectively.
X-ray fluorescence analysis of samples was accomplished by the direct comparison method during which photons of 2225 keV energy from 109Cd source
were used. The net peak intensities were calculated by the software AXIL.
The arithmetic (X) and geometric (GM ) mean values were calculated with the data above the detection limit. Since the second group is expected to have some abnormalities due to external effects, Students t-test was performed on the results in Table 4 by using the values of Table 3 as references. The confidence intervals for elements calculated from the 95% t-values are given below for dry hair in ppm: Ca (170750); Fe (14.143.9); Cu (6.9929.59); Zn (3.13325).
Results and discussion
The sensitivity of the analysis of trace elements in biological samples depends on the mass density of the fluorescent element in the sample, matrix composition, fluorescent X-ray lines, geometry and design of the detection system, and excitation energy. For estimation of sensitivity and accuracy of a broad range of trace element, detection limits are calculated in similar matrices.
Since the healthy population did not have any significant contamination of Pb, the Pb levels of auto workshop workers in Lahor (5.6 ppm)18 and in
Mineralab (030 ppm)19 were taken for comparison
values. In the present study the minimum detection limits
(MDL) of some trace elements of interest were calculated for 109Cd excitation, and listed in the first
column of Table 1. The results are for samples in ashed form. Ashing caused a mass loss of about 87%. The detection limits given in the second column of Table 1 is not only the sensitivity of the device alone but includes the results obtained from the ashed samples. Results below the MDL for ashed hair were excluded
The hair trace element levels of the workers group are compared with the confidence intervals obtained from the healthy group in Table 5.
It can be seen from Table 4 that all subjects having elevated Ca levels also have elevated Fe levels. This relation may be due to the working environment contamination (exhaust gases, metal dusts, some chemicals used in the industry, dyes, etc.), the
Table 3. Trace element concentrations (in ppm) for the healthy urban group in Ankara, determined by XRF spectrometry
Sample No. Age Sex Smoker Ca Fe Cu Zn Pb
1 29 M no 301±17 21.6±4.6 9.12±3.02 456±21 Bdl 2 21 M no 479±22 27.3±5.1 19.9±3.15 156±13 Bdl 3 20 M no 183±14 28.3±5.2 Bdl 121±14 Bdl 4 17 M no 248±16 13.5±3.6 9.41±3.07 135±10 Bdl 5 17 M no 507±23 39.6±6.3 15.6±3.9 201±11 Bdl 6 12 M no 337±18 31.0±5.6 15.5±3.9 104±10 Bdl 7 21 M no 421±21 31.8±5.5 18.7±4.2 129±11 Bdl 8 17 M no 374±19 23.9±4.7 17.2±4.1 106±10 Bdl 9 20 M no 379±19 23.7±4.8 19.2±4.3 168±13 Bdl 10 20 M no 370±18 24.5±4.9 18.6±4.2 213±15 Bdl 11 20 M no 657±26 25.1±5.0 Bdl 116±11 Bdl 12 19 M no 599±24 37.7±6.1 22.7±4.5 157±13 Bdl 13 16 M no 532±23 32.9±5.7 25.2±5.0 150±12 Bdl 14 17 M no 408±20 20.4±4.5 19.5±4.3 184±14 Bd 15 18 M no 446±21 34.3±5.9 15.9±4.0 230±15 Bdl 16 21 M no 652±26 30.9±5.6 26.5±5.1 133±12 Bdl 17 18 M no 530±23 32.2±5.7 29.3±5.3 198±14 Bdl 18 20 M no 761±28 47.2±6.8 19.6±4.3 95.3±9.8 Bdl X 458 29.0 18.2 164 GM 434 28.0 17.3 161 std 136 7.11 5.35 76.7 Range 183761 13.547.2 9.1229.3 68.9456 95% 170750 14.143.9 6.9929.5 3.13325 confidence interval *Bdl Below detection limit.
Table 4. Trace element concentrations (in ppm) for the group working in an industrial site in Ankara, determined by XRF spectrometry
Sample Age Sex Pollution Smoker Ca Fe Cu Zn Pb
No. interval (years) 19 16 M 2 no 372 ± 19 19.7 ± 4.4 8.17 ± 2.86 129 ± 11 1.36 ± 1.17 20 20 M 2 no 944 ± 31 121 ± 11 8.65 ± 2.94 175 ± 13 2.06 ± 1.44 21 37 M 21 no 530 ± 23 15.3 ± 3.9 7.47 ± 2.73 112 ± 11 2.54 ± 1.59 22 37 M 21 no 273 ± 16 7.70 ± 2.81 9.05 ± 3.01 170 ± 13 1.15 ± 1.07 23 32 M 21 no 583 ± 25 40.9 ± 6.4 20.7 ± 4.6 183 ± 14 3.38 ± 1.84 24 23 M 8 no 407 ± 20 27.2 ± 5.2 13.7 ± 3.7 172 ± 13 5.19 ± 2.28 25 40 M 2 no 355 ± 19 7.61 ± 2.76 11.9 ± 3.5 209 ± 15 1.49 ± 1.22 26 35 M 23 yes 1122 ± 34 318 ± 18 33.6 ± 5.8 184 ± 14 13.1 ± 3.6 27 17 M 4 yes 1298 ± 36 214 ± 15 17.9 ± 4.2 187 ± 14 7.02 ± 2.65 28 19 M 7 yes 2603 ± 51 841 ± 29 19.1 ± 4.4 213 ± 15 40.5 ± 6.4 29 15 M 3 no 593 ± 24 145 ± 12 12.1 ± 3.5 150 ± 12 6.14 ± 2.48 30 20 M 10 yes 822 ± 29 43.1 ± 6.57 11.1 ± 3.3 184 ± 14 2.61 ± 1.62 31 27 M 10 yes 244 ± 16 191 ± 14 8.76 ± 2.96 100 ± 10 17.1 ± 4.1 32 16 M 2 yes 1058 ± 33 205 ± 14 20.6 ± 4.5 309 ± 18 79.6 ± 8.9
Table 5. Comparison of hair trace element levels in the workers group with those in the healthy group
Element Number of Number of Number of depleted results results in the elevated results
95% confidence interval Ca 8 6 Fe 2 4 8 Cu 13 1 Zn 14 Pb* 8 6 Pb** 12 2
* When the Pb levels of auto workshop workers in Lahor is considered as the normal range.18
** When the Pb levels reported by Mineralab is considered as the normal range.19
Fig. 1. Correlation between Fe and Ca levels in the hair of individuals belonging to the workers group: r = 0.98, Y = 0.43 X 266
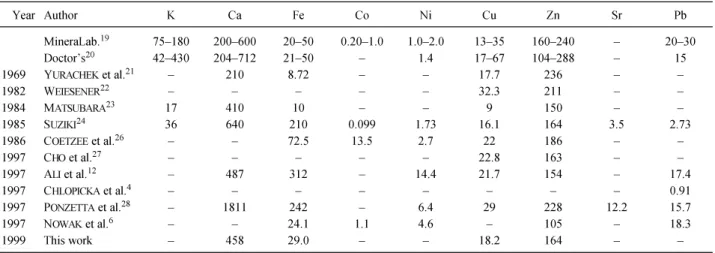
Table 6. Normal concentrations and ranges of trace elements in human hair published in the literature (in ppm)
Year Author K Ca Fe Co Ni Cu Zn Sr Pb MineraLab.19 75180 200600 2050 0.201.0 1.02.0 1335 160240 2030 Doctors20 42430 204712 2150 1.4 1767 104288 15 1969 YURACHEKet al.21 210 8.72 17.7 236 1982 WEIESENER22 32.3 211 1984 MATSUBARA23 17 410 10 9 150 1985 SUZIKI24 36 640 210 0.099 1.73 16.1 164 3.5 2.73 1986 COETZEEet al.26 72.5 13.5 2.7 22 186 1997 CHOet al.27 22.8 163 1997 ALIet al.12 487 312 14.4 21.7 154 17.4 1997 CHLOPICKAet al.4 0.91 1997 PONZETTAet al.28 1811 242 6.4 29 228 12.2 15.7 1997 NOWAKet al.6 24.1 1.1 4.6 105 18.3 1999 This work 458 29.0 18.2 164
The normal Zn levels in every individual is a support
of the importance of Zn for metabolism. The levels of Ca and Fe in contaminated workers show apositive correlation. It may be the pollution effect, the metabolic effect or the result of food intake rich in Ca and Fe. The effect of smoking can be seen on Fe and Pb levels. The healthy group provided satisfactory data for comparison and since the two groups are from the same urban area, the confusions occurring when the normal ranges of other populations are used, are averaged out as most studies show the geographical habitation as a factor influencing trace element levels.
We may conclude that smokers have higher Fe and Pb levels than non smokers. This is probably due to the normal mechanism of smoking effecting the inhalation of evaporated metals.
Hair levels may reflect body trace element levels but since the normal ranges are quite large, interpretation of results is somewhat uncertain. Thus forming a control group for each study is very beneficial. The very wide ranges of trace element distributions found in the literature for different populations are presented in Table 6.
Variations are not only a result of external contamination. The feeding habits, degree of exposure, diseases with the possibility of effecting trace element
References 16. P. ARIKAN, A. ZARARSIZ, N. EFE, Appl. Spectrosc. Revs., 31 (1996) 167.
17. A. ZARARSIZ, R.KIRMAZ, P. ARIKAN, Nucl. Instr. Meth., B108 (1996) 385.
1. S. D. RASBERRY, K. F. J. HEINRICH, Anal. Chem., 46 (1974) 81. 2. R. E. VANGRIEKEN, A. A. MARKOWICZ, Handbook of X-Ray
Spectrometry, Marcel Dekker, New York, 1993. 18. W. ASHRAF, M. JAFFAR, D. MOHAMMAD, Bull. Environ. Contam. Toxicol., 53 (1994) 516.
3. R. TERTIAN, X-Ray Spectrom., 15 (1986) 177.
19. MineraLab, Inc. , 22455 Maple Court, Hayward, CA 94541. 4. J. CHLOPICKA, Z. ZACHWIEJA, P. ZAGRODZKI, J. FRYDRYCH,
P. SLOTA, M. KROSNIAK, Biol. Trace Elem. Res., 62 (1998) 229. 20. Doctors Data, Inc., Post Office Box 111, West Chicago IL60185. 5. R. W. PHELPS, T. W. CLARKSON, T. G. KERSHAW, B. WHEATLEY,
Arch. Environ. Health, 35 (1980) 161. 21. J. P. YURACHEK, G. G. CLEMENA, W. W. HARRISON, Anal. Chem., 41 (1969) 1666.
6. B. NOWAK, H. KOZLOWSKI, Biol. Trace Elem. Res., 63
(1998) 991. 22. W. WEISENER, U. SCHAEFER, Zentralbl. Pharm. Pharmakother. Laboratoriumsdiagn., 121 (1982) 459.
7. R. S. GIBSON, J. Human Nutr., 34 (1980) 405.
23. J. MATSUBARA, University of Tokyo, Personal Communication, 1984.
8. D. C. HILDERBR, D. H. WHITE, Clin. Chem., 29 (1974) 148. 9. W. H. LANGHAM, Agric. Food Chem., 9 (1961) 91.
24. S. SUZIKI, Y. OPKADA, K. MATUMOTO, S. HIRAI, Bull. Atomic Energy Res. Lab. Musashi Inst. Technol., June (1985) 57. 10. G. SANER, Am. J. Clin. Nutr., 34 (1981) 853.
11. W. H. STRAD, L. T. STENDMAN, C. A. LANKAW, W. P. BERLINER,
W. J. PORIES, J. Lab. Chin. Med. , 68 (1966) 244. 25. CHATT, S. A. KATZ, Hair Analysis Applications in the Biomedical and Environmental Sciences, VCH Publishers, New York, 1988. 12. M. ALI, A. H. KHAN, A. K. M. WAHIDUZZAMAN, M. A. MALEK,
J. Radioanal. Nucl. Chem., 219 (1997) 81. 26. P. P. COETZEE, H. PIETERSE, S. Afr. J. Chem., 39 (1986) 85. 26. S. Y. CHO, O. D. AWH, Y. J. CHAING, Y. S. CHUNG, J. Radioanal.
Nucl. Chem., 217 (1997) 107. 13. J. ERTEN, A. ARÇASOY, A. ÇANDAR, T. CIN, Am. J. Child. Nutr.,
31 (1978) 1172.
28. M. T. PONZETTA, S. NARDI, I. CALLIARI, M. LUCCHESE, Biol. Trace Elem. Res., 62(1998) 199.
14. M. LAKER, Lancet, 31 (1982) 260.
15. V. VALKOVIC, Sample Preparation Techniques in Trace Element Analysis by X-Ray Emission Spectroscopy, IAEA TECDOC 300, Vienna ,1983; 27.