Defect-mode-like transmission and localization of light in photonic crystals without defects
A. E. Serebryannikov*Technische Universitaet Hamburg–Harburg, E-3, D-21071 Hamburg, Germany Ekmel Ozbay
Nanotechnology Research Center, Department of Physics, Department of Electrical and Electronics Engineering, Bilkent University, 06800 Ankara, Turkey
P. V. Usik
Institute of Radio Astronomy, National Academy of Sciences of Ukraine, 61085 Kharkiv, Ukraine 共Received 24 February 2010; published 29 October 2010兲
It is shown that far- and near-field effects, which are similar to those arising in transmission through finite-thickness photonic crystals共PCs兲 with structural defects, can be obtained in the conventional defect-free dielectric square-lattice PCs. Multiple narrow peaks of total transmission can appear within a frequency range, where the noncircular isofrequency dispersion contours of one type are quickly transformed for a higher-order Floquet-Bloch wave to the noncircular contours of the other type, leading to a frequency-domain passband being very narrow within a certain range of variation of the angles of incidence. In this regime, the mirror reflectance of the equivalent Fabry-Pérot resonator takes rather large values, which correspond to large values of Q factor and group index of refraction, strong field localization, and good isolation of the transmission peaks from each other. In some examples presented, Q factor exceeds 104.
DOI:10.1103/PhysRevB.82.165131 PACS number共s兲: 42.70.Qs, 42.25.Bs, 78.20.Ci, 42.79.Ci
I. INTRODUCTION
Localization of electromagnetic field at structural defects, i.e., the appearance of defect modes, is one of the most in-teresting features demonstrated by one-, two-, and three-dimensional photonic crystals 共PCs兲. Various defect-mode related transmission and waveguide regimes have been in the focus of interest for more than one decade. They were suc-cessfully utilized in filters, waveguides, resonators, splitters, mode converters, 共de-兲 multiplexers, tapers, cavities, cou-plers, detectors, low-threshold lasers, and buffers, e.g., see Refs.1–13.
Defect modes manifest themselves in the transmission re-gime in finite-thickness pieces of PCs due to the appearance of narrow transmission peaks. In the dielectric PCs with mul-tiple narrow coupled defects and those with a single wide defect, multiple transmission peaks can appear within a stop band of the corresponding defect-free PC. They are used, for example, in multiple-wavelength frequency filters and multi-band spatial filters.13–15Unusual transmission features can be
realized when defects are made of a left-handed material, for example, enabling multiple-wavelength omnidirectional filters.16
The defect-mode originated transmittance can be inter-preted in terms of an equivalent Fabry-Pérot resonator with either planar mirrors placed at virtual interfaces of a PC 共in the both cases of multiple narrow defects and a single wide defect兲, or volumetric mirrors representing pieces of a regu-lar PC, which delimit a wide defect working as a resonator.13
In a lossless case, defect modes lead to the total-transmission peaks. Being weakly coupled to each other, these modes can show high Q values, while the peaks are well isolated from each other. In other words, the defect modes can provide one with large values of reflectance of an equivalent planar mir-ror Rˆ . The larger the Rˆ, the larger Q factor and the better the
isolation are. In planar homogeneous slabs, either very high or very low permittivity values are required for obtaining of sufficiently large values of Rˆ . Because of this, the use of PCs, which are made of conventional dielectrics and show structural defects, is quite reasonable.
A way to localize electromagnetic waves without defects in finite-thickness slabs of planar topology is also known, which requires utilization of a negative-index material.17On
the other hand, a rich variety of dispersion types, which are achievable in PCs without defects, enables obtaining of the transmission effects like negative refraction without left handedness, highly directive transmission, and bandpass spa-tial filtering.18–20Besides, a rather wide range of variation in
Rˆ is expected to be obtainable. Indeed, a slab of
two-dimensional PC without defects itself shows a Fabry-Pérot type behavior of transmittance T within regular passbands, which are associated with Floquet-Bloch 共FB兲 waves.21 In
the existing theoretical and experimental performances of two-dimensional PCs, typical transmission features indicate an increase in Rˆ at the edges of a regular passband, which is connected, in turn, with reduction in group velocity. How-ever, the Q factor in these performances is often insuffi-ciently large and the T minima are insuffiinsuffi-ciently deep in order to consider them as competitors of those with defects. It is noteworthy that reduction of group velocity near the edges is known also in one-dimensional defect-free struc-tures like fiber Bragg gratings.12Recently, the dielectric PCs
of circular topology have been suggested, where strong lo-calization can appear within a certain regular layer, leading to the sharp peaks in the frequency dependence of the radia-tion power.22
In this paper, we will show that defect-mode-like multiple peaks of total transmission can be obtained in the finite-thickness slabs of classical square-lattice dielectric PCs
with-out defects, within the narrow 共mini-兲 passbands, which are connected with a quick transformation of the isofrequency dispersion contours 共IFCs兲 that appears while varying fre-quency. Rather large values of Q, good isolation of the peaks of T from each other, and strong field localization can be obtained, giving an alternative in certain operation regimes to the slabs of noncurvilinear lattice PCs with defects.
Our consideration is based on the assumption, according to which the effect that Rˆ increases close to a passband edge is reinforced for narrow passbands. The desired effects will be demonstrated in square-lattice PCs in case of s-polarized plane incident wave, within, and in the vicinity of the fre-quency range, where the nonisotropic IFCs localized near the
X point are transformed to those localized near the⌫ and M
points. Simulations have been carried out for dispersion and transmission by usingCST MICROWAVE STUDIO共Ref.23兲 and the coupled integral equations based homemade code,24
re-spectively.
II. THEORETICAL BACKGROUND
Transmittance of a Fabry-Pérot resonator filled with a ho-mogeneous dielectric dispersionless medium is given by the Airy formula,25
T =共1 − Rˆ兲2/关共1 − Rˆ兲2+ 4Rˆ sin2共nkD cos
⬘
兲兴, 共1兲 where k =/c is the free-space wave number,⬘
is the angle of refraction, D and n are the distance and index of refraction of the medium between the mirrors, respectively, and Rˆ is the reflectance of a mirror. In case of a freely located slab, Rˆ is given byRˆ = 关共cos− n cos
⬘
兲/共cos+ n cos⬘
兲兴2, 共2兲where n cos
⬘
=冑
n2− sin2 andis the angle of incidence. Figure 1 shows T vs nkD calculated by using Eq. 共1兲 at normal incidence. It is seen that large values of Rˆ are re-quired for obtaining well-isolated narrow peaks, which are similar to those arising in the slabs of PC due to the struc-tural defects.According to Eq.共2兲, n=n⫾is expressed in terms of Rˆ as follows: 共n⫾兲2= cos2
冉
1 − Rˆ 1/2 1 + Rˆ1/2冊
⫿2 + sin2. 共3兲For example, n+= 78 and n−= 1.28⫻10−2 at Rˆ =0.95 in Fig.
1, where 60⬍Q⬍400 and the minimal transmittance be-tween neighboring peaks is Tmin⬇6.6⫻10−4. In this case, Q⬎103 starting from nkD = 50. In the classical Fabry-Pérot resonators, which are created by a slab of a homogeneous dispersionless material, the phase index of refraction共n兲 and group index of refraction共ng兲 have the same values. In slabs
of the structured materials, n⫽ng in the general case so that
the distance between the neighboring transmission peaks is associated with ng.
Despite the progress in obtaining slow light in periodic structures with defects共e.g., see Refs.12and26兲, design of such structures that shows a desired large value of ngcan still
be a challenging task. At the same time, materials with 0 ⬍Re n⬍1 either exist in the nature 共noble metals兲 or can be designed 共wire media兲, depending on the frequency range.27
However, because of unavoidable significant losses, they do not allow obtaining peaks of T = 1. Furthermore, if multiple, closely spaced peaks are required, another problem may oc-cur, which is related to the distance achievable between the neighboring peaks. On the other hand, the Q factor in Fig.1 is not sufficiently large even at Rˆ =0.95. These and other difficulties are expected to be partially overcame by exploit-ing the effect of increase of Rˆ that can appear at a passband edge of a PC, which is made of a conventional low-loss dielectric with a relatively small n.
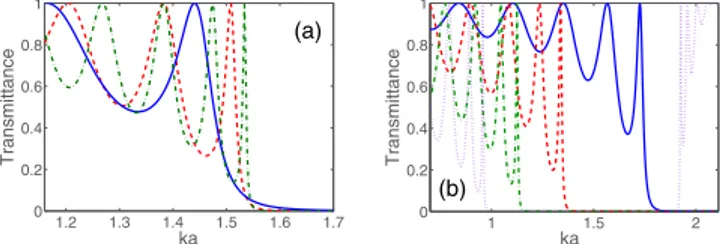
A typical example of T vs ka共a is the lattice constant兲 is shown in Fig. 2 at the edge of the lowest passband of a square-lattice dielectric PC for several values of the number of the rod layers N and the relative permittivity of the rods r, at an intermediate rod-diameter-to-lattice-constant ratio,
d/a. The alternating minima and maxima of T indicate a
Fabry-Pérot type behavior. In the considered case, the IFCs are located near ⌫ point and, except for the vicinity of the band edge, show the共near-兲 circular shape, i.e., that is rather close to the IFC shape for a homogeneous isotropic medium. Figure 2共a兲 demonstrates the effect of N. It is seen that increase in N enables approaching the first near-edge maxi-mum to the passband edge so that it becomes narrower and
0 5 10 15 20 0 0.2 0.4 0.6 0.8 1 nkD T ransm ittance
FIG. 1. 共Color online兲 Transmittance as a function of nkD at = 0: Rˆ =0.15—solid blue line, Rˆ=0.55—dashed red line, and Rˆ = 0.95—dotted green line.
1.2 1.3 1.4 1.5 1.6 1.7 0 0.2 0.4 0.6 0.8 1 ka Transmittance (a) 1 1.5 2 0 0.2 0.4 0.6 0.8 1 ka Transmittance (b)
FIG. 2. 共Color online兲 Transmittance vs ka at 共a兲 d/a=0.4, r = 11.4, N = 5—solid blue line, N = 8—dashed red line, and N = 12—dash-dotted green line, and 共b兲 d/a=0.4, N=8, r= 8.2—solid blue line, r= 15—dashed red line, r= 22—dash-dotted green line, and r= 31—dotted violet line; = 0.
better isolated from its neighbor. This corresponds, in fact, to the increase in Rˆ for an equivalent Fabry-Pérot resonator. The observed difference in the peak number, which depends on N, is also consistent with the theory of the classical Fabry-Pérot resonators. The difference between the effective index of refraction, nef f, which is obtained from the
disper-sion results, and the equivalent index of refraction obtained from the transmission results, nT, is a well known feature.
The latter is mainly associated with ng but can also be
af-fected by the peculiarities of treating virtual interfaces of the PC. Dispersion results for Fig.2共a兲共not shown兲 indicate that
nef f is increased while approaching a passband edge.
How-ever, the observed characteristics of the near-edge minimum and maximum of T correspond to nT⬎nef f.
Figure 2共b兲 demonstrates the effect of r. The basic
fea-tures observed in Fig.2共a兲remain here. Increase inr leads
to that the first near-edge peak of T is better isolated from the neighboring peak. For higher PC passbands, a variation inr
can be used for improving the isolation, although an increase inrdoes not necessarily lead to a better result.
As follows from Eq. 共1兲, the increase in can also result in narrowing and improving isolation of the near-edge peak of T. This remains true when the IFCs are located around M point so that T = 0 at 0⬍⬍0and T⬎0 at⬎0, as occurs, for example, for the parameters of Fig. 2共a兲at ka⬎1.55, at least for N艌8. Giving the guide lines for obtaining a narrow near-edge peak of T, the above discussed results do not present such peaks that would be competitive in terms of Q factor and isolation with those achievable in the defect-mode regime. Based on the obtained results 共both shown and not shown兲, we might expect that Rˆ can rise to the required level if a PC passband is dramatically narrowed.
III. RESULTS AND DISCUSSION A. Existence of minipassbands
Various IFC shapes and combinations of the group 共vg兲
and phase 共vph兲 velocities are known for higher-order
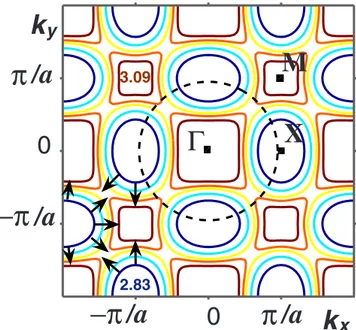
pass-bands of two-dimensional PCs, which are associated, in par-ticular, with negative refraction, ultrarefraction, and various numbers of the refracted beams, e.g., see Refs. 18, 28, and 29. Among them, there are also those corresponding to the desired narrow passbands. Figure 3 shows an example of a quick transformation of the IFCs for the second lowest PC passband, for which the strong narrowing is possible at in-termediate.
At the lower boundary of the considered ka range 共ka = 2.83兲, the IFCs are located around X point. Then, they are substantially expanded while keeping nearly the same shape, at least up to ka = 2.99. Dramatic change in the IFC shape occurs between ka = 2.99 and ka = 3.03. As a result, IFCs take a共near-兲 square shape, being located around ⌫ and M points. A quick change of the shape and width of the IFCs, which determine the coupling scenario, is expected to lead to small group velocity and, hence, to large values of nT.
In Fig. 4, three typical cases of coupling of the incident plane wave to a FB wave are demonstrated. Further, we will refer to the cases shown in Figs. 4共a兲–4共c兲, as A, B, and C,
respectively, as well as to other similar cases. In the per-formed analysis of coupling, standard rules and assumptions were utilized.18,29,30In particular, we use conservation of the
wave-vector component being parallel to the PC interfaces,
kx, and consider only those crossing points of IFCs with the
construction lines, for which the energy velocity ve= vg is
pointed away from the source. Note that the knowledge of IFC of the PC at a fixed, fixed band slope which is deter-mined by sign ofⵜk· kPC, where kPCis the wave vector of
the FB wave, and gradient of the IFCs at fixed kx= kx
PC is
sufficient for determining all the coupled beams.29
In case A, the IFCs are located around X point so that
kmin共2兲⬎kmax共1兲, where kmin共2兲 and kmax共1兲 mean the minimal value of the modulus of the parallel component of the wave vector兩kx兩
for the IFCs near兩kx兩=/a and the maximal value of 兩kx兩 for
the IFCs near kx= 0, respectively. Here, there is no coupling
in the vicinity = 37.5°, while a single beam in the PC is positively refracted for the IFCs located near kx= 0, i.e., at
small , and negatively refracted for the IFCs near 兩kx兩
=/a, i.e., at large . For both the groups of IFCs, S · kPC ⬍0, where S is the Poynting vector.
In case B, the IFCs are still located near the X point. However, now they become so wide that the two refracted beams simultaneously appear in the vicinity of = 37.5°. In turn, at small and large , for example, at = 10° and = 65°, the same features of coupling 共not shown兲 are ob-served as in case A. Finally, in case C, we again obtain no coupling in the vicinity of= 37.5°. The only significant dif-ference comparing to case A is that vgis directed now nearly
perpendicular to the PC interfaces, indicating a collimation regime. As a result of the described transformation, the width of the -domain passband can be minimized at a proper choice of . The minimal width ⌬ka⬇0.07 is achieved at
⬇37.5°.
Γ
X
M
3.09 2.83k
k
−π
π
−π
π
/a
/a
/a
/a
0
0
x
y
FIG. 3. 共Color online兲 IFCs on the 共kx, ky兲 plane for PC with d/a=0.4 and r= 11.4 at ka = 2.83 共dark-blue lines兲, 2.92 共cyan lines兲, 2.99 共yellow lines兲, 3.03 共orange lines兲, and 3.09 共brown lines兲; dashed circle—IFC in air at ka=2.99; black arrows— possible directions of vg.
B. Transmission spectra
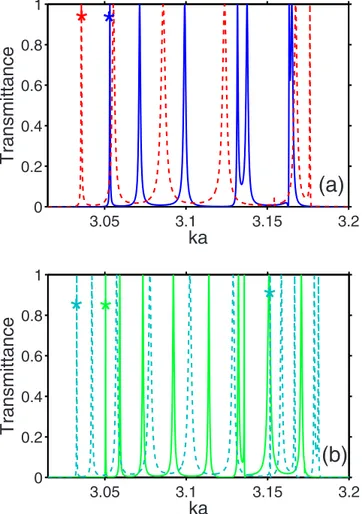
Figure5presents T as a function of ka for the eight-layer PC with the samer and d/a as in Figs.3 and4 at several
values of , for which the second lowest passband can be
considered as a minipassband. As expected, it consists of the well-isolated multiple narrow peaks of T = 1. Hence, defect-mode-like transmission is obtained without introducing structural defects.
All the peaks of T = 1 at ka⬍2.95 correspond here to the sole negatively refracted beam, as in case A in Fig.4共a兲, for the IFCs located near 兩kx兩=/a. This is also related to the
single peaks seen at 2.95⬍ka⬍3. The twin peaks at ka ⬎2.95, except for that arising between ka=3.02 and ka = 3.03 at= 42°, correspond to the two simultaneously exist-ing beams with different sgn共vg· x兲, as in case B in Fig.4共b兲.
Here, x denotes the axis that is parallel to the PC interfaces. It is noteworthy that the opposite edges of the stop bands, which are adjacent to the minipassband, are located at ka ⬇1.6 and ka⬇3.27 when = 37.5°.
In line with Eq. 共1兲, where we take n=nT, and assuming
that nTis not varied between two neighboring peaks of T, nT
can be estimated from the location of the peaks. For ex-ample, location of the first and second near-edge peaks, which appear in Fig.5at= 40° in the vicinity of ka = 2.93 is the same as in case of a homogeneous slab with n⬇23.4 and
0
k
yπ
/a
−π
/a
0
−π
/a
π
/a k
x ka=2.83 10° 37.5°65°k
k
v
v
g g 0 0k
yπ
/a
0
−π
/a
−π
/a
0
π
/a k
x ka=2.99 10°37.5° 65°v
v
g g (1) (2) (a) (b) 10° 37.5°65°k
yπ
/a
0
−π
/a
−π
/a
0
π
/a k
xv
gv
gk
0k
0 ka=3.09 (c)FIG. 4. 共Color online兲 IFCs at 共a兲 ka=2.83, 共b兲 2.99, and 共c兲 3.09; dashed circles—IFC in air; straight dotted lines—construction lines at =10°, =37.5°, and =65°; k=k0 共thinner arrows兲— incident wave vector at =10° and =65° in plots 共a兲 and 共c兲; thicker arrows—directions of group velocity of the sole refracted beam at=10° and =65° in plots 共a兲 and 共c兲, and those of the two refracted beams at=37.5° in plot 共b兲; rectangles in plots 共a兲 and 共c兲 show the range of variation in kx, where no coupling takes place; rectangle in plot 共b兲 shows the kx range with the two refracted beams; the incidence interface is assumed to be parallel to the kx axis and located on the side of positive values of ky.
2.8 2.9 3 3.1 3.2 0 0.2 0.4 0.6 0.8 1
ka
T
ransm
ittance
(a)
2.9 2.95 3 3.05 0 0.2 0.4 0.6 0.8 1ka
T
ransm
ittance
*
*
*
*
(b)
FIG. 5. 共Color online兲 Transmittance vs ka within the minipass-band, which is associated with the second lowest FB wave of PC with d/a=0.4, r= 11.4, and N = 8 at=37.5° 共solid blue line兲, = 40°共dashed red line兲, and=42° 共dotted green line兲; plot 共a兲—the passband and the adjacent parts of the first and second stop bands and plot共b兲—detailed structure of the passband; some high-Q peaks are denoted by asterisk.
D = Na. Substituting this value of n to Eq. 共2兲, we obtain Rˆ ⬇0.877. On the other hand, the same Tmin⬇4.6⫻10−3, as
between the mentioned near-edge peaks, requires Rˆ ⬇0.873. This follows from the comparison with the results for T ob-tained from Eq.共1兲 at different Rˆ. Finally, following Eq. 共1兲,
Rˆ ⬎0.99 is required in order to obtain the same value of Q
⬇7.9⫻103 as for the first near-edge peak of T, arising at ka = 2.923. It is worth noting that in our case, the observed
location of the peaks is obtained due to a negatively refracted beam 共see Figs. 5 and 6兲 so that a negative value can be assigned to nT.
The peaks can be tuned by varying, which affects their location and Q factor in similar manner as can be done in the case of defect modes.13The Q values for the peaks denoted
in Fig. 5共b兲 by ⴱ are presented in the upper part of TableI. One can see that high-Q peaks can be obtained both at the edge and inside the minipassband. Q factor can further be increased by increasing N. At the same time, the features seen in Fig.5共b兲still remain at smaller N, e.g., at N = 5.
The highest Q is often achieved for the single peaks aris-ing in the vicinity of the smaller-ka edge, which correspond
to the case when a sole coupled beam is negatively refracted. This regime can be interpreted as negative ultrarefraction, since ⬍兩
⬘
兩 and sgn共vg· x兲⬍0 while sgn共k0· x兲⬎0 at ⬎0. In the limiting case of this regime, vg· x⬇−兩vg兩兩x兩 and
兩kx兩=kmin共2兲. However, the first near-edge peak is always
lo-cated at some distance from the band edge. Correspondingly,
⬘
for this peak can take values from a rather wide range, depending on N and .The discussed effects remain within a wide range of varia-tion inr, d/a, and N. An example is presented in Fig.6for
a smaller r. As in Fig.5, the appearance of the
minipass-band, which comprises the multiple peaks of T, is connected with the peculiar quick transformation of the IFCs. As ex-pected, larger Q values are obtained at N = 12 than at N = 8. The Q values for the cases denoted by ⴱ in Fig. 6 are pre-sented in the lower part of TableI.
C. Frequency-angle map of transmission
To better understand the basic features of transmission, it has also been studied at the simultaneous variation in ka and
. The results are shown in Fig.7at the same PC parameters as in Fig.5. In this case, less fine discretization than in Fig. 5 was used in the coupled integral equation based code in order to reduce the required CPU time to reasonable values. Therefore, locations of the passbands and peaks of T can be slightly different from those in Fig.5. As compared to a finer discretization, some features can be lost, but the basic ones remain.
The alternating mountains and valleys of T in Fig.7 indi-cate the Fabry-Pérot type behavior. Three typical ka ranges can be distinguished, which are denoted by a, b, and c. They are partially consistent with cases A, B, and C in Fig.4. The boundary between the ka ranges denoted by a 共kmin共2兲⬎kmax共1兲兲 and b共kmin共2兲⬍kmax共1兲兲, which is shown by the left dashed line in Fig.7. For the both ranges a and b, the IFCs are located near the X point. The boundary between the ranges b and c 共kmin共2兲⬎kmax共1兲兲 corresponds to the second case of kmin共2兲= kmax共1兲.
Here, the transformation of the IFCs is finished so that they TABLE I. Values of Q for the narrow transmission peaks and the corresponding values of ka, N, and.
ka N Q Figure5共b兲 2.904 8 42° 4.8⫻103 2.923 8 40° 7.9⫻103 2.949 8 37.5° 4.2⫻104 3.009 8 42° 4.9⫻104 Figure6 3.0333 12 40° 1.64⫻104 3.0357 8 40° 5.7⫻103 3.0505 12 38.5° 2.5⫻104 3.0532 8 38.5° 8.4⫻103 3.1515 12 40° 2.8⫻104 3.05 3.1 3.15 3.2 0 0.2 0.4 0.6 0.8 1
ka
Transm
ittance
*
*
(a)
3.05 3.1 3.15 3.2 0 0.2 0.4 0.6 0.8 1ka
Transmittance
*
*
*
(b)
FIG. 6. 共Color online兲 Transmittance vs ka within the minipass-band at d/a=0.4 and r= 9.61: plot共a兲—=38.5° and N=8 共solid blue line兲, and =40° and N=8 共dashed red line兲; plot 共b兲— = 38.5° and N = 12共solid green line兲, and=40° and N=12 共dashed bright-blue line兲; some high-Q peaks are denoted by asterisk; note the peak densening at increase in N.
are located in the range c around ⌫ and M points. For the range b in Fig. 7, the regime of two refracted beams occurs inside the range of= f共ka兲, which is bounded by the dotted white lines 共case B in Fig. 4 also belongs to this range兲. Beyond it, a sole refracted beam contributes to T. Due to the peculiar behavior of the mountains of T in the range b, the possibility exists to decrease distance between two neighbor-ing peaks at given to a desired value. Hence, the mimick-ing of nT that is much larger than 23.4 共see Sec. III B兲 is
expected to be obtainable within narrow ranges of ka varia-tion.
Comparing Figs. 5 and 7 and the data from Table I for range a, one can see that the Q factor for the mountain/peak denoted by ⴱvaries continuously from 4.8⫻103at= 42° to
4.2⫻104 at= 37.5°. According to the obtained results, the
width of the passband ⌬ka⬇0.13 is still sufficiently small for obtaining of Q⬎4⫻103. Decrease in ⌬ka owing to a proper variation in can result in larger values of Q. It is interesting that the near-edge peaks are narrower for the negatively refracted beam, i.e., at larger, than for the posi-tively refracted beam, i.e., at smaller , while ka = const. Thus, stronger field localization is expected in the former case, although S · kPC⬍0 for both positively and negatively refracted beams.
D. Field inside PC
The large values of Q-factor like those inferred from Figs. 5and6serve a signature of that the field is strongly localized inside the slab of PC. Let us consider the field distribution for several typical peaks of T. Four examples are presented in Fig.8. In plots共b兲, 共c兲, 共d兲, and 共e兲, the ratio of the maxi-mal field amplitude in PC to that of the incident plane wave is nearly equal to 20, 70, 25, and 90, respectively. Hence, field can be strongly confined within the defect-free slab of PC in a similar way as within structural defects in a slab of PC. The observed field profiles are symmetric with respect to the PC midplane. However, because of the peculiar field structure inside the slab, these regimes are not the full
ana-logs of those in the classical Fabry-Pérot resonators, where the space between the mirrors 共interfaces兲 is either a homo-geneous medium or simply air. In other words, the slab of PC can partially mimick near- and far-field effects, which are typical for the Fabry-Pérot resonators, rather than be entirely equivalent to such a resonator. This example also shows that localization can be much stronger in the conventional dielec-tic PCs with the left handedness than in the slabs of a homo-geneous negative-index medium.17
E. Increasing Q
As has been demonstrated in Table I, Q factor that ex-ceeds 104can be obtained for the peaks of T, which appear within the minipassband. However, much larger values can be achieved by using the same mechanism. Figure9presents an example, in which Q⬇1.5⫻106. Here, the observed peak
of T is the second lowest peak of the minipassband. In turn, for a thinner slab with N = 28, Q⬇4.5⫻105 for the second lowest peak, which is shifted now to ka = 2.9445 because of FIG. 7.共Color online兲 Transmittance on the 共ka,兲 plane for the
second lowest FB wave at d/a=0.4, r= 11.4, and N = 8; asterisk indicates here the narrow mountain of T = 1, which corresponds to the peaks denoted by asterisk in Fig.5共b兲at ka⬍2.95.
FIG. 8. Geometry of the slab of PC with d/a=0.4, r= 11.4, and N = 8 within a grating period ax= a关plot 共a兲兴, and the amplitude of electric field at ka = 2.99 and =35° 关plot 共b兲兴, ka=2.949 and = 37.5° 关plot 共c兲兴, ka=2.923 and =40° 关plot 共d兲兴, and ka=3.009 and =42° 关plot 共e兲兴; plots 共c兲 and 共d兲 correspond to the same mountain of T = 1 as that shown in Fig.7by asterisk; the brighter the tone, the larger the amplitude is in each of plots共b兲–共e兲; dashed white lines show virtual boundaries of the slab of PC at y = 0 and y = Na. 2.944635 2.94464 2.944645 0 0.2 0.4 0.6 0.8 1 ka Transmittance
FIG. 9. Transmittance for a narrow range of ka variation at = 37.5°, N = 36, and same remaining parameters as in Fig.5.
the variation in N while is fixed. Furthermore, even more advantageous designs, in which Q⬎106, are possible for thinner slabs of PC owing to a proper choice of rand d/a.
It follows from the obtained results that nT⬎80 can be
ob-tained at = 37.5° from the locations of the first and second lowest near-edge peaks of T by taking Nⱖ28. Such large values of nTare achievable due to the peculiar location of the
mountains and valleys of T with respect to each other, which occurs inside the range bounded by dotted lines in Fig.7.
IV. CONCLUSIONS
To summarize, defect-mode-like transmission can appear within a narrow, higher-order passband of a PC without de-fects, leading to similar far- and near-field effects as those being typical for PCs with defects. In particular, multiple, narrow, well-isolated transmission peaks and large values of the equivalent group index of refraction can be obtained at a proper adjustment of the PC parameters. In the considered examples, the largest values of Q factor correspond to the case when a negatively refracted beam is one of the two beams, or a sole beam contributing to the transmission through the slab of PC, while the left handedness takes place.
Large values of Q can also be obtained for a positively re-fracted beam. The observed effects may be associated with large reflectance of mirrors of an equivalent Fabry-Pérot resonator. Our results demonstrate a route of obtaining of slow light, which can be much more flexible regarding the beam width than that based on defect modes. Existence of the desired narrow passband can be easily predicted by using the conventional approach, which is based on the IFCs and wave vector diagrams. The obtained results show that the defect-free PCs can be an alternative to the PCs with defects for obtaining the operation regimes, which can be utilized in multifrequency filters, concentrators, buffers, and other opti-cal and microwave devices.
ACKNOWLEDGMENTS
This work is supported by the European Union under the projects PHOME, ECONAM, N4E, and TUBITAK under Projects No. 109E301, No. 107A004, and No. 107A012, and DPT under the project DPT-HAMIT. A.E.S. was supported by the Deutsche Forschungsgemeinschaft under Project No. SE1409.2-1. E.O. acknowledges partial support from the Turkish Academy of Sciences.
1Photonic Crystals: Physics, Fabrication and Applications, edited by K. Inoue and K. Othaka共Springer, Berlin, 2004兲.
2T. Ueda, K. Othaka, N. Kawai, and K. Sakoda, J. Appl. Phys. 84, 6299共1998兲
3H. Benisty, C. Weisbuch, D. Labilloy, M. Rattier, C. J. M. Smith, T. F. Krauss, R. M. De La Rue, R. Houdre, U. Oesterle, C. Jouanin, and D. Cassagne, J. Lightwave Technol. 17, 2063 共1999兲.
4E. Özbay, G. Tuttle, J. S. McCalmont, R. Biswas, M. Sigalas, C. M. Soukoulis, and K. M. Ho,Appl. Phys. Lett. 67, 1969共1995兲. 5A. Talneau, Ph. Lalanne, M. Agio, and C. M. Soukoulis, Opt.
Lett. 27, 1522共2002兲.
6A. Sugitatsu, T. Asano, and S. Noda,Appl. Phys. Lett. 84, 5395 共2004兲.
7J. Zimmermann, M. Kamp, A. Forchel, and R. Maerz,Opt. Com-mun. 230, 387共2004兲.
8M. Koshiba,J. Lightwave Technol. 19, 1970共2001兲.
9H. Takano, Y. Akahane, T. Asano, and S. Noda,Appl. Phys. Lett. 84, 2226共2004兲.
10S. Kim, I. Park, and H. Lim,Opt. Lett. 30, 257共2005兲. 11B. Temelkuran, E. Ozbay, J. P. Kavanaugh, G. Tuttle, and K. M.
Ho,Appl. Phys. Lett. 72, 2376共1998兲.
12J. B. Khurgin,J. Opt. Soc. Am. B 22, 1062共2005兲.
13J. H. Wu, L. K. Ang, A. Q. Liu, H. G. Teo, and C. Lu,J. Opt. Soc. Am. B 22, 1770共2005兲.
14H.-Y. Lee, S.-J. Cho, G.-Y. Nam, W.-H. Lee, T. Baba, H. Makino, M.-W. Cho, and T. Yao, J. Appl. Phys. 97, 103111 共2005兲.
15M. Bayindir, B. Temelkuran, and E. Ozbay,Phys. Rev. Lett. 84, 2140共2000兲.
16M. Makhan and S. K. Ramchurn,J. Opt. Soc. Am. B 24, 3040 共2007兲.
17T. J. Cui, Q. Cheng, W. B. Lu, Q. Jiang, and J. A. Kong,Phys. Rev. B 71, 045114共2005兲.
18C. Luo, S. G. Johnson, J. D. Joannopoulos, and J. B. Pendry, Phys. Rev. B 65, 201104共2002兲.
19I. Bulu, H. Caglayan, and E. Ozbay,Appl. Phys. Lett. 83, 3263 共2003兲.
20A. E. Serebryannikov, A. Y. Petrov, and E. Ozbay,Appl. Phys. Lett. 94, 181101共2009兲.
21K. Sakoda, Optical Properties of Photonic Crystals 共Springer, Berlin, 2001兲, pp. 92–93.
22W. Zhong and X. Zhang,Phys. Rev. A 81, 013805共2010兲. 23Seewww.cst.com.
24T. Magath and A. E. Serebryannikov, J. Opt. Soc. Am. A 22, 2405共2005兲.
25M. Born and E. Wolf, Priciples of Optics: Electromagnetic Theory of Propagation, Interference and Diffraction of Light 共Pergamon Press, Oxford, 1970兲, pp. 325–326.
26T. Baba,Nat. Photonics 2, 465共2008兲.
27J. B. Pendry, A. J. Holden, W. J. Stewart, and I. Youngs,Phys. Rev. Lett. 76, 4773共1996兲.
28B. Gralak, S. Enoch, and G. Tayeb,J. Opt. Soc. Am. A 17, 1012 共2000兲.
29S. Foteinopoulou and C. M. Soukoulis,Phys. Rev. B 72, 165112 共2005兲.