European integration, productivity growth and real convergence: evidence from the new member states
Tam metin
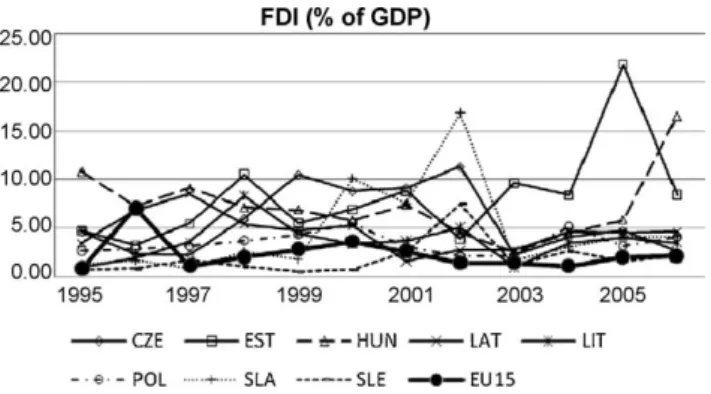
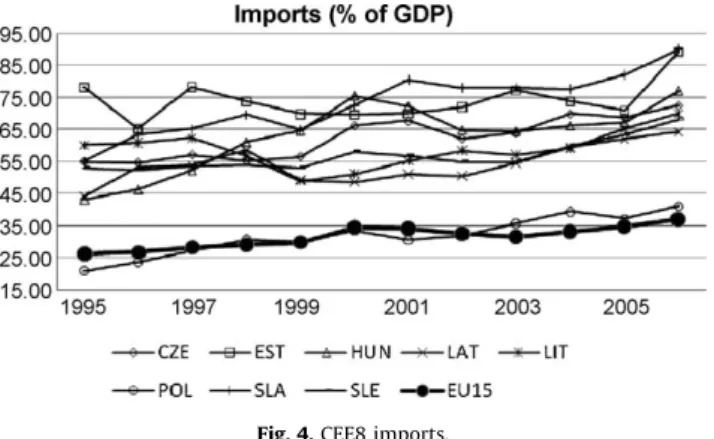
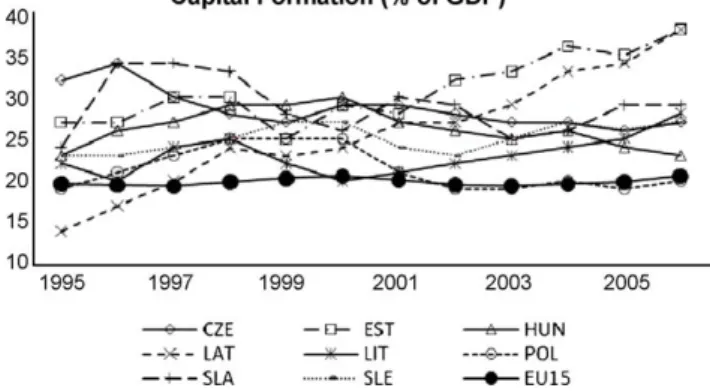
Şekil

Benzer Belgeler
adenokarsinomlarda p53 immünoreaktivitesi daha çok %50’nin üzerinde izlendi. Kötü diferansiye adenokarsinomlarda p53 immünoreaktivitesi daha çok %75’in
paracontact Riemannian manifold and consider invariant, non-invariant and anti-invariant hypersurfaces, respectively, of almost r-paracontact Riemann- ian manifold endowed with
The study answered two questions: if is possible that foreign firms are more successful than domestic companies of the host country and if foreign direct investment is
The outcome of the study will highlight the impact of human resource practices of small firms in terms of training, recruitment, compensation while the
The variables data include GDP (CAP) in constant price of year 2005, remittance (REM), foreign aid (AID) and FDI as the percentage of GDP, Nepal inflation rate
This study has examined the importance of financial sector development and economic growth for three American countries America (Argentina, Brazil and
its completely consist with theory proposed that more FDI inflows increase stocks of technology, human capital and advanced level of management that could lead
According to fig 2.1 the effects of inflation on financial intermediaries is a direct effect but the effect on economic growth in posed in two ways which are efficiency
