Clinical
Investigation
Comparison of
Intraopera-tive Transit-Time Flow
Measurement with Early
Postoperative Magnetic
Resonance Flow Mapping
in Off-Pump Coronary Artery Surgery
The purpose of this prospective study was to evaluate graft patency of off-pump coro-nary artery surgery intraoperatively by transit-time flow measurement and to compare this technique with postoperative magnetic resonance flow mapping.
Twenty patients (13 men and 7 women; mean age, 67.9 ± 7.6 yr) underwent off-pump coronary artery surgery. Intraoperative transit-time flow measurement of grafts was performed measuring maximum, minimum, and mean flows. For each graft, the pul-satile index was calculated by dividing the difference between the maximum and the minimum flow by the mean flow. In the early postoperative period (1st week), magnet-ic resonance flow mapping was performed using phase contrast flow quantifmagnet-ication. Mean intraoperative flow values and mean magnetic resonance flow mapping values were compared. At the same postoperative session, contrast-enhanced magnetic reso-nance angiography was performed to evaluate graft patency.
In 20 patients, a total of 49 coronary graft flows were assessed with intraoperative transit-time flow measurement and postoperative magnetic resonance flow mapping. Upon comparison, there was a strong correlation between techniques, with stable and statistically significant differences between the intraoperative and postoperative flow mapping values. One saphenous vein graft was revised intraoperatively, due to graft failure.
Our data suggest that the combined use of intraoperative transit-time flow measure-ment and postoperative magnetic resonance flow analysis has a potential role in the assessment of graft patency in off-pump coronary artery surgery, although more study is required. (Tex Heart Inst J 2003;30:31-7)
ff-pump coronary artery surgery is a technically more challenging proce-dure than is conventional on-pump coronary artery surgery. Evaluation of bypass-graft patency during the operation and in the postoperative pe-riod becomes more important for the management of patients and for the assess-ment of anastomosis quality.1, 2For the intraoperative assessment of bypass grafts,
transit-time flow measurement (TTFM) has been used as an effective and reliable technique.1
Conventional angiography is considered the gold standard technique for disclos-ing restenosis and visualizdisclos-ing patent bypass grafts durdisclos-ing the postoperative period. Contrast-enhanced magnetic resonance angiography (CE-MRA) has also been used for this purpose, and its results, in general, correlate well with those of conventional angiography.3,4However, in cases of moderately severe (50%–75%)
stenosis, as determined by both conventional and MR angiography, results do not always correspond with functional status.5Therefore, intracoronary Doppler flow
measurement has been used in difficult-to-determine cases.5However, this
proce-dure is highly invasive, costly, and necessitates hospitalization. Magnetic resonance flow mapping of bypass grafts has been used as a noninvasive alternative technique to assess intraluminal flow.6
The purpose of this prospective study was to assess the value of TTFM for the intraoperative management of the patient during off-pump coronary artery sur-gery, and to compare this technique, in the early postoperative period (1st week),
Ilhan Sanisoglu, MD Mustafa Guden, MD Cem Balci, MD Ertan Sagbas, MD Cihan Duran, MD Belhhan Akpinar, MD
Key words: Blood flow
velocity; graft occlusion, vascular/diagnosis; hemo-rheology/instrumentation; magnetic resonance angiography; prospective studies; rheology/methods From: Departments of Cardiac Surgery (Drs. Akpinar, Guden, Sagbas, and Sanisoglu) and Radiology (Drs. Balci and Duran), Kadir Has University Medical Faculty, Florence Nightingale Hospital, Caglayan 80220, Istanbul, Turkey
This study was presented at the European Congress of Radiology, Vienna, Austria, 1–5 March 2002.
Address for reprints:
Ilhan Sanisoglu MD, Altimermer cad. Yeniyol No: 7 A Blok D:13, Kocamustafapasa 34280, Istanbul, Turkey
E-mail:
© 2003 by the Texas Heart®
Institute, Houston
with MR flow mapping of bypass grafts, in conjunc-tion with contrast-enhanced MR angiography.
Patients and Methods
From January 1999 through May 1999, 20 patients underwent off-pump coronary artery surgery through a median sternotomy. Emergency cases and reopera-tions were excluded. The mean age was 67.9 ± 7.6 years (range, 54 to 81 years). There were 13 men and 7 women. Fifty-three anastomoses were performed with use of off-pump coronary artery surgery. The mean number of anastomoses per patient was 2.7 ± 0.8
Surgical Procedure
All patients were premedicated with midazolam, 0.07 to 0.1 mg/kg. Anesthesia was induced with fentanyl and Diprivan, and vecuronium was used for muscle relaxation. Anesthesia was maintained with perfusion of fentanyl and Diprivan. The operating room tem-perature was maintained at 24 to 25 °C. Initially, 2 mg/kg heparin was administered, followed by 50 mg every hour intraoperatively.
Intraoperative Flow Measurement
In TTFM, 2 piezoelectric crystals transmit ultra-sound through the blood vessel toward a reflector on the other side of the vessel. The volume of flow is cal-culated by measuring the difference between transit times upstream and downstream in the blood vessel.7
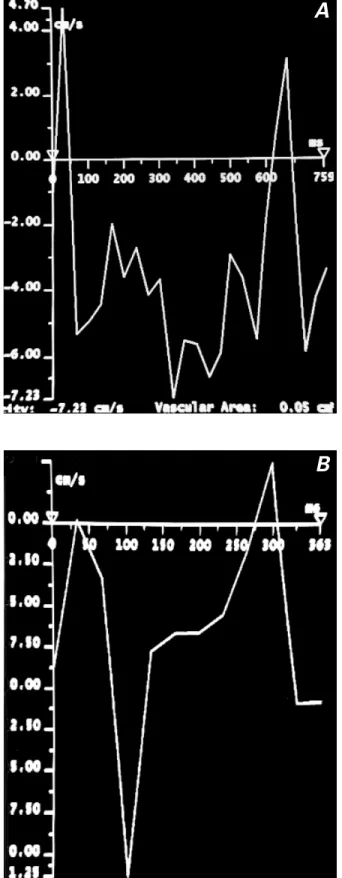
In a left coronary graft, blood flows predominantly during diastole, with a short peak during systole, be-cause the smaller intramyocardial vessels are com-pressed during left ventricular systole. Therefore, flow curves in a patent graft have a large diastolic pattern (Fig. 1A). In the right coronary artery, blood f lows predominantly during systole because the pressure dif-ferential is more favorable. Flow curves in a patent right coronary graft, then, have a large systolic pattern (Fig. 1B). In a case of stenotic anastomosis, the flow curves become smaller and reveal an irregular pattern (Fig. 1C).
Flow values and curves were measured by use of the Coronary FloMeter™System (CFM 100, Transonic
Systems Inc.; Ithaca, NY) before the sternum was closed. During this procedure, the mean systemic blood pressure and heart rate were kept at 84.5 ± 9.4 mmHg and 69.3 ± 7.3 beats/min, with a hemoglobin concen-tration of 8.9 ± 2.6 g/dL. Transit-time flow measure-ment values, flow curves, and the pulsatile index (PI) were calculated and evaluated. The PI was calculated by dividing the difference between the maximum and the minimum flow by the mean flow. According to D’An-cona and colleagues,2a PI value of 1 through 5 indicates
satisfactory quality of the anastomosis.
Several studies have been performed for validation of TTFM using different systems under various con-ditions (arterial or venous graft material, saline or blood-flow medium), and the results of these revealed that TTFM is a fast and reliable method.6,8 In our
study, the findings of the Coronary FloMeter were also validated by left internal mammar y arter y (LIMA) flow measurement. After flushing the LIMA with papaverine, we collected the blood in a basin while measuring the f low with TTFM for 60 sec-onds. The amount of collected blood was compared with TTFM measurement flow values. This proce-dure was repeated for 16 LIMA grafts.
Magnetic Resonance
Angiography and Flow Mapping
All patients underwent MR flow mapping and MR angiography for the assessment of graft patency dur-ing the 1st postoperative week. Two experienced radi-ologists evaluated both the flow measurements and the MR angiography images, and they were blinded to patients’ TTFM data obtained by intraoperative measurements. The blood pressure and heart rate of every patient was measured during MR imaging. The mean blood pressure and heart rate were 89.1 ± 5.4 mmHg and 74.6 ± 11.2 beats/min, with hemoglobin concentrations of 11.2 ± 2.3 g/dL.
Magnetic resonance imaging was performed with a 1.5 tesla (40mT/meter gradient strength) cardiac-Fig. 1 Transit-time flow curves: Panel A shows normal flow
pattern of LIMA–LAD graft; Panel B shows normal flow pattern of SVG–RCA; Panel C shows flow pattern of a stenotic SVG–RCA anastomosis.
LAD = left anterior descending artery; LIMA = left internal mammary artery; RCA = right coronary artery; SVG = saphe-nous vein graft
dedicated MR scanner (Magnetom Sonata, Siemens; Erlangen, Germany), using a phased-array body coil. For the visualization of bypass grafts, an electrocar-diography (ECG)-gated, black-blood, half-Fourier, single-shot, fast-spin echo sequence (HASTE) (TR [repetition time] = ∞; TE [echo time] = 60 msec) was performed in axial and coronal planes, with a 4-mm section thickness in a single breath-hold. Magnetic resonance f low-mapping was performed using an ECG-gated, breathing averaged, velocity encoded, phase-contrast, gradient echo sequence (Figs. 2A and 2B). The velocity window was set to 75 cm/sec. A single-slice, phase-contrast, gradient echo sequence was placed in a plane perpendicular to the imaged by-pass grafts, and imaging was performed for each graft separately. The following sequence parameters were used: TR = 30 msec, TE = 2 msec, FA (flip angle) = 70°, 2 averages, with an acquisition time of 6 to 8 min according to heart rate. Prospective ECG gating was used to acquire 20 frames covering the entire heart cycle. The acquisition matrix was 300 × 512, yielding a pixel size of 1.7 × 1.9. Contrast-enhanced MR an-giography was performed by use of a 3-dimensional (3-D) gradient echo sequence (Flash 3D) with the fol-lowing imaging parameters: TR = 4.6 msec, TE = 1.2 msec, FA = 25°, a matrix of 180 to 190 × 512, and a coronal slab with a thickness of 60 to 80 mm (60 to 80 partitions yielded slice thicknesses of 1 mm). Gadolinium chelate (Magnevist, Schering; Berlin, Germany) was administered at a dosage of 0.2 mmol/kg with a power injector (Medrad; Pittsburgh, Penn), at a rate of 3 mL/sec; this was followed by a flush of 10 mL of normal saline. For testing purposes, we in every case injected a gadolinium chelate bolus at a rate of 3 mL/sec before the 3-D gradient echo se-quence, in order to achieve accurate contrast timing.
Postprocessing of f low measurements was per-formed with the provided software at the MR scan-ner. Mean f low (in mL/min) and peak velocity (in cm/sec) were calculated automatically; volumetric re-construction of MR angiography images was per-formed at the 3D Virtuoso workstation (Siemens). Maximum-intensity projection images were color mapped, and bypass grafts were viewed at different angles.
Statistical Analysis
All the statistical analyses were performed by use of the SPSS 10.0 ( SPSS Inc; Chicago, Ill) statistical package. We tested the parametric assumptions of the variables first and then used Student’s t-test for paired samples, or the Wilcoxon signed test for assessment of the differences between 2 groups. All data were ex-pressed as mean ± standard deviation. P values less than 0.05 were considered statistically significant. In order to find the correlation between 2 variables, we
Fig. 2 Magnetic resonance flow mapping with use of the
phase-contrast technique. Flow velocity curves of 2 patent grafts: A) left internal mammary artery and B) saphenous vein.
A
calculated the Pearson coefficient of correlation. We applied a linear regression module to reveal the rela-tion between TTFM and MR f low-mapping tech-niques.
Results
Four LIMA grafts could not be evaluated with MR angiography because of problems encountered at the outset of the clinical trial, and these were excluded. A total of 49 coronary graft flows were evaluated in 20 patients. Graft flow parameters measured by intraop-erative TTFM and postopintraop-erative MR flow mapping are shown in Tables I and II, respectively.
One saphenous vein graft (SVG) was revised intra-operatively due to graft failure. Before revision, the mean flow was found to be 5.2 mL/min, and the PI value was 11.9 with abnormal flow pattern. After re-vision, the flow pattern improved, and the mean flow was found to be 30.3 mL/min with a PI value of 2.
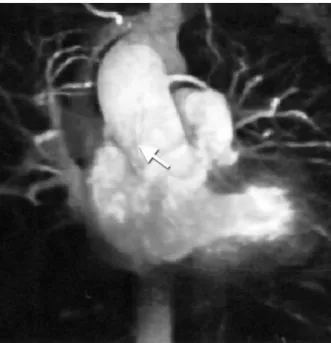
One graft had decreased f low and another graft had no flow on the MR flow analysis, which was also revealed by MR angiography (Fig. 3). Stenosis and occlusion of the grafts were also confirmed by con-ventional coronary angiography.
For the validation of findings by the Coronary Flo-Meter, the volume of the blood collected in a basin in 60 seconds was 72 ± 15.7 mL/min, and the TTFM
TABLE I. Flow Parameters* in 49 Grafts Measured by
Intraoperative TTFM
No. of Mean Flow
Grafts Grafts (mL/min) Pulsatile Index
LIMA–LAD 16 40.6 ± 21.3 1.8 ± 0.4 SVG 33 21.8 ± 6.8 2.1 ± 0.3 *Values are expressed as mean ± SD.
LAD = left anterior descending coronary artery; LIMA = left in-ternal mammary artery; SD = standard deviation; SVG = saphe-nous vein graft; TTFM = transit-time flow measurement
TABLE II. Flow Parameters* in 48 Grafts Measured by
Postoperative Magnetic Resonance Flow Mapping
No. of Mean Mean Peak Grafts Flow Velocity Velocity Grafts (mL/min) (cm/sec) (cm/sec) LIMA–LAD 16 51.4 ± 23.3 7 ± 2.6 14.7 ± 5.1 SVG 32** 27.2 ± 7.4 5 ± 1.5 9 ± 2.8
**Values are expressed as mean ± SD.
**One SVG was excluded because of graft occlusion. LAD = left anterior descending coronary artery; LIMA = left in-ternal mammary artery; SD = standard deviation; SVG = saphe-nous vein graft
Fig. 3 Magnetic resonance angiogram of a patient with
occlu-sion of a saphenous vein graft to the right coronary artery (arrow).
value was 79.9 ± 19.1 mL/min. The difference be-tween the 2 measurements was not significant (P >0.05), which validated the TTFM performed by the Coronary FloMeter.
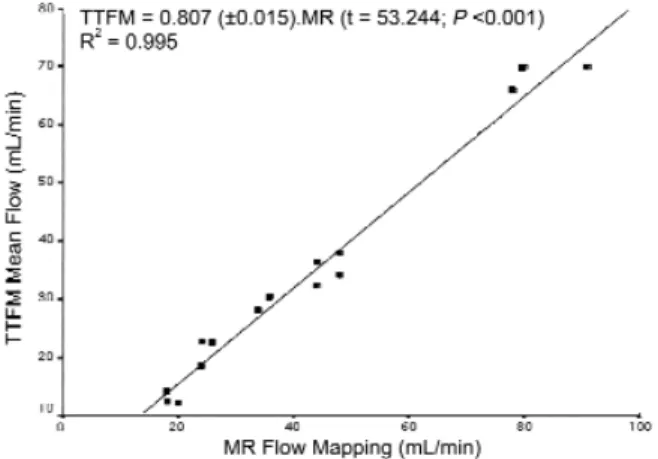
The mean LIMA–LAD flow value (n=16) was 40.6 ± 21.3 mL/min, and the PI value was found to be 1.8 ± 0.4 with perioperative TTFM and 51.4 ± 23.3 mL/min with postoperative MR f low mapping. There was a significant increase in LIMA–LAD flow values (z=3.517; P <0.01) and good positive correla-tion between TTFM and MR flow-mapping values (r=0.99; P <0.01) (Fig. 4). On MR flow mapping, the mean vessel area of LIMA–LAD grafts was 12.3 ± 5.7 mm2, and the average number of pixels in the grafts
was 3.8 ± 0.7.
The mean SVG flow value (n=33) was found to be 21.8 ± 6.8 mL/min, and the PI value was found to be 2.1 ± 0.3 with perioperative TTFM and 27.2 ± 7.4 mL/min with postoperative MR f low mapping (n=32). There was also a significant increase in SVG flow values (t=9.090; P <0.01) and good positive cor-relation between TTFM and MR flow-mapping val-ues (r=0.90; P <0.01) (Fig. 5). On MR flow mapping, the mean vessel area of SVG grafts was 15 ± 6.3 mm2,
and the average number of pixels in the vessel area was 4.1 ± 0.5.
Discussion
Measurement of coronary graft blood flow is of great clinical value in determining graft stenosis in
off-ment of the iron atoms in the hemoglobin complex, and such measurement techniques rely on the con-centration of serum hemoglobin. Therefore, minor changes in the probe angle affect the accuracy of the measurements.14However, measurements obtained by
using TTFM are not affected by the concentration of serum hemoglobin and probe angle. Since TTFM di-rectly measures the mean blood-f low value, it does not need a homogeneous distribution of the blood f low within the cross-sectional area of the vessel, whereas the ultrasound Doppler technique requires it.15Several studies have demonstrated that the
mea-surement of bypass grafts using TTFM is effective and reliable for intraoperative evaluation of coronary grafts.2,13,15Although TTFM appears to be an accurate
and reliable technique for intraoperative coronary graft flow measurements, it is not possible to measure coronary graft f low with this technique postopera-tively.
In the postoperative period, assessment of bypass grafts is important for the medical and interventional management of the patient. Coronary angiography has been considered the gold standard for the eval-uation of bypass grafts; however, it is an invasive pro-cedure and cannot be used as a screening method on every patient. There are some pitfalls of coronary an-giography in the evaluation of stenotic segments. Wiklund and colleagues16have reported that it is
dif-ficult to explain certain findings in early postopera-tive coronary angiography. They observed, by means of postoperative angiography, a large number of ste-noses without clinical symptoms. They also observed that the contrast medium sometimes displayed quick run-off from the graft into the anastomosed vessel, despite the angiographic appearance of significant ste-nosis, which could lead to overestimation or under-estimation of the stenosis.16 Angiography yields a
limited 2-dimensional view of coronary grafts, with-out supplying specific information abwith-out the hemo-dynamic characteristics of the anastomosis.
Coronary MR imaging has been considered a chal-lenging technique because of the small size of the coronary arteries, the abundant signal from surround-ing epicardial fat, and the significant motion associat-ed with both respiration and cardiac contractions. However, the relatively motionless position of the coronary bypass graft partly offsets many of the tech-nical obstacles of native-vessel coronary MR imag-ing.17,18Moreover, the bypass graft’s relatively straight
and predictable course enables the use of MR imaging techniques. Therefore, contrast-enhanced 3-D MR imaging has been used successfully for the evaluation of the bypass grafts4and stenotic segments, and the
results have correlated well with those of conventional angiography. With the use of cardiac-dedicated scan-ners, rapid and reproducible MR angiography will be pump coronary artery surgery. Intraoperative
assess-ment of bypass graft patency by flow measureassess-ment enables early intervention and revision, at the same session, of occluded grafts or failed anastomoses.5,9,10
Numerous flow measurement techniques are current-ly in use.11-13Recently, TTFM and MR imaging
tech-niques have been used to evaluate intraoperative and postoperative coronary graft blood flow, respectively.
Many authors have demonstrated the superiority of TTFM over Doppler systems in direct real-time detection of f low, regardless of vessel diameter and Doppler angle.11Electromagnetic wave flow
measure-ment of bypass grafts depends on the measuremeasure-ment of the deflection of magnetic force created by the move-Fig. 4 Correlation between TTFM and magnetic resonance
flow-mapping values in LIMA–LAD flow. r=0.99; P <0.01
LAD = left anterior descending artery; LIMA = left internal mammary artery; TTFM = transit-time flow measurement
Fig. 5 Correlation between TTFM and magnetic resonance
flow-mapping values in SVG flow. r=0.90; P <0.01
MR = magnetic resonance; SVG =saphenous vein graft; TTFM = transit-time flow measurement
performed routinely in the future. However, there are limitations to MR angiography: occlusion at the anas-tomotic site cannot be accurately visualized by con-trast-enhanced MR angiography alone,3nor can the
hemodynamics of bypass grafts be accurately evaluat-ed in cases of moderately severe stenoses (50%–75%) that display clinical symptoms.5
Because of these limitations, flow measurement of bypass grafts has been performed by the MR flow-mapping technique. This technique relies on the phase shifts of the flowing protons in the vessels. A flow speed needs to be set for the anticipated flow rate in the vessel, which has been chosen as 75 cm/sec in previous reports and also in our study. Our data correlated well with the results of our intraoperative measurements. In previous studies of MR flow measurements, adenosine was used to produce stress-induced flow changes for the purpose of evaluation.5In our study, we did not
produce stress-induced f low changes, because we wanted to approximate the conditions that existed during intraoperative flow measurements. Our results correlated with those of a previous study19that
com-pared intraoperative f low measurement with MR flow mapping, both in terms of comparative intraop-erative measurement values and postopintraop-erative MR flow quantification methods.
An important limitation of the MR flow-mapping technique is the problem of breathing artifacts, which can impair measurement. We used the breath-hold technique and the navigator-gated 3D-MRA tech-nique to perform controlled, artifact-free visualization of the bypass grafts during MR angiography. For the MR flow measurements, the breath-hold technique can be used despite inadequate spatial resolution (128–256 matrix) and fewer time points (phases).5,19, 20
Our technique of free-breathing, phase-contrast velocity imaging, as applied to MR f low measure-ments, yields images with better resolution, despite some blurring by the free breathing and by the mul-tiple averages incurred by the technique. The 512 matrix also enabled us to better evaluate internal mammary artery grafts, which have relatively small diameters.
One might ask why the MR measurement of flow for both the LIMA and SVG grafts is so much higher (approximately 30%) than that of the TTFM flow. In all likelihood, this can be accounted for by the intraoperative and postoperative differences in the patient’s hemodynamic condition. During surgery, myocardial contractions are depressed because of hi-bernation and stunning of the heart, and patients take vasopressors to tolerate this. Vasopressors, of course, affect arterial blood flow. In addition, one must con-sider the metabolic status of the patient in the periop-erative period, at which time metabolic acidosis often has a negative effect on myocardial blood flow.
Despite these differences between intraoperative and postoperative conditions during measurements, there was a good correlation between the results of the 2 techniques, with stable and statistically signifi-cant differences between the values. Another impor-tant limitation of our study is the fact that we derived most of our flow measurements and MR angiograph-ic data from grafts with normal intraoperative flow patterns. In 1 patient, MR angiography revealed an occluded graft that displayed normal intraoperative flow patterns during TTFM. Postoperative occlusion was attributed to kinking of the venous graft due to excessive length. This patient underwent coronary angiography, which also showed an occluded venous bypass graft of the right coronary artery, and was re-ferred to the department of cardiology for further management.
To better evaluate the specificity of MR imaging and TTFM in the assessment of stenotic graft seg-ments, correlative studies should be undertaken in larger series, and conventional angiography should be used postoperatively to confirm stenosis or occlu-sion.
Conclusion
Our data revealed good correlation between intraop-erative TTFM and postopintraop-erative MR flow measure-ment. The combined use of these techniques can evaluate the quality of the operative procedure and improve postoperative screening of patients. Further studies, undertaken on a larger scale and supple-mented postoperatively by conventional angiogra-phy, should reveal more clearly the value of f low measurements in application to stenotic and occlud-ed grafts.
References
1. Jaber SF, Koening SC, BhashkerRao B, VanHimbergen DJ, Cerrito PB, Ewert DJ, et al. Role of graft flow measurement technique in anastomotic quality assessment in minimally invasive CABG. Ann Thorac Surg 1998;66:1087-92. 2. D’Ancona G, Karamanoukian HL, Ricci M, Schmid S,
Bergsland J, Salerno TA. Graft revision after transit time f low measurement in off-pump coronary artery bypass grafting. Eur J Cardiothorac Surg 2000;17:287-93. 3. Vetter HO, Driever R, Mertens H, Kempkes U, Cramer
BM. Contrast-enhanced magnetic resonance angiography of mammary artery grafts after minimally invasive coronary bypass surgery. Ann Thorac Surg 2001;71:1229-32. 4. Wintersperger BJ, Engelmann MG, von Smekal A, Knez A,
Penzkofer HV, Hofling B, et al. Patency of coronary bypass grafts: assessment with breath-hold contrast-enhanced MR angiography value of a non-electrocardiographically triggered technique. Radiology 1998;208:345-51.
5. Langerak SE, Kunz P, Vliegen HW, Lamb HJ, Jukema JW, van Der Wall EE, de Roos A. Improved MR flow mapping in coronary artery bypass grafts during adenosine-induced stress. Radiology 2001;218:540-7.
14. Louagie YA, Haxhe JP, Buche M, Schoevaerdts JC. Intraop-erative electromagnetic flowmeter measurements in coro-nary artery bypass grafts. Ann Thorac Surg 1994;57:357-64.
15. Hirotani T, Kameda T, Shirota S, Nakao Y. An evaluation of the intraoperative transit time measurements of coronary bypass flow. Eur J Cardiothorac Surg 2001;19:848-52. 16. Wiklund L, Johansson M, Brandrup-Wongsen G, Bugge M,
Radberg G, Berglin E. Difficulties in the interpretation of coronary angiogram early after coronary artery bypass sur-gery on the beating heart. Eur J Cardiothorac Surg 2000; 17:46-51.
17. Dodge JT Jr, Brown BG, Bolson EL, Dodge HT. Lumen diameter of normal human coronary arteries. Influence of age, sex, anatomic variation, and left ventricular hypertro-phy or dilation. Circulation 1992;86:232-46.
18. Wang Y, Riederer SJ, Ehman RL. Respiratory motion of the heart: kinematics and the implications for the spatial reso-lution in coronary imaging. Magn Reson Med 1995;33: 713-9.
19. Walpoth BH, Muller MF, Genyk I, Aeschbacher B, Kipfer B, Althaus U, Carrel TP. Evaluation of coronary bypass flow with color-Doppler and magnetic resonance imaging techniques: comparison with intraoperative flow measure-ments. Eur J Cardiothorac Surg 1999;15:795-802. 20. Kim WY, Danias PG, Stuber M, Flamm SD, Plein S, Nagel
E, et al. Coronary magnetic resonance angiography for the detection of coronary stenoses. N Engl J Med 2001;345: 1863-9.
6. Beldi G, Bosshard A, Hess OM, Althaus U, Walpoth BH. Transit time f low measurement: experimental validation and comparison of three different systems. Ann Thorac Surg 2000;70:212-7.
7. Walpoth BH, Bosshard A, Genyk I, Kipfer B, Berdat PA, Hess OM, et al. Transit-time flow measurement for detec-tion of early graft failure during myocardial revasculariza-tion. Ann Thorac Surg 1998;66:1097-100.
8. Laustsen J, Pedersen EM, Terp K, Steinbruchel D, Kure HH, Paulsen PK, et al. Validation of a new transit time ultrasound f lowmeter in man. Eur J Vasc Endovasc Surg 1996;12(1):91-6.
9. Barstad RM, Fosse E, Vatne K, Andersen K, Tonnessen TI, Svennevig JL, Geiran OR. Intraoperative angiography in minimally invasive direct coronary artery bypass grafting. Ann Thorac Surg 1997;64:1835-9.
10. Goldstein JA, Safian RD, Aliabadi D, O’Neill WW, Shan-non FL, Bassett J, Sakwa M. Intraoperative angiography to assess graft patency after minimally invasive coronary by-pass. Ann Thorac Surg 1998;66:1978-82.
11. Canver CC, Dame N. Ultrasonic assessment of internal thoracic artery graft flow in the revascularized heart. Ann Thorac Surg 1994;58:135-8.
12. Louagie YA, Haxhe JP, Jamart J, Buche M, Schoevaerdts JC. Intraoperative assessment of coronary artery bypass grafts using a pulsed Doppler flowmeter. Ann Thorac Surg 1994;58:742-9.
13. Walpoth BH, Mohadjer A, Gersbach P, Rogulenko R, Wal-poth BN, Althaus U. Intraoperative internal mammary ar-tery transit-time flow measurements: comparative evaluation of two surgical pedicle preparation techniques. Eur J Cardio-thorac Surg 1996;10:1064-70.