Contents lists available atScienceDirect
Energy Strategy Reviews
journal homepage:www.elsevier.com/locate/esrAn analysis of price spikes and deviations in the deregulated Turkish power
market
Gizem Gayretli
a, Ahmet Yucekaya
b,*, Ayse Humeyra Bilge
b aGraduate School of Science & Engineering, Kadir Has University, Istanbul, TurkeybIndustrial Engineering Department, Kadir Has University, Istanbul, Turkey
A R T I C L E I N F O Keywords:
Market clearing price System marginal price Price spike Load shedding Load cycling
A B S T R A C T
The successful operation of a real time market is related to the planning in the day ahead market. We analyze the day ahead and real time market data for the Turkish power market for the period 2012–2015 to classify price spikes and their causes. We also focus on the levels of deviation between the day ahead market values and the real time market values. We define price deviation and load deviation ratios to measure the level of deviation both in price and demand. The analysis for the load is based on load shedding and cycling values. We analyze the mean and standard deviation in market prices and we determine the price spike as a two sigma deviation from the mean value. It is shown that 60% of the price deviation ratios are in the range of ( ± 20%), while 44% are in the range of ( ± 10%) and 35% are in the range of ( ± 5%). We also show that 56.9% of the spikes are due to problems in the generation of natural gas based power plants which affect the day ahead and real time prices. A total of 29.2% of the spikes are due to power plant and system failures that affect only real time prices. The share of high temperature based spikes is 13.9% which is a result of air conditioner usage.
1. Introduction
In deregulated markets, day ahead prices are considered as the re-ference prices. Unexpected situations in the planned operation of the system, such as deviations in demand, generating unit failures and other supply problems may lead to different prices in the real time market, which are called imbalance prices. These price movements are classified as “price spikes” and “price deviations”, based on statistical arguments. Those instances where the power prices rise to unexpected levels, are called price spikes. These instances need to be analyzed se-parately, as they can be considered to be outliers that do not conform to the market mechanism. On the other hand, fluctuations in prices within a certain range are called price deviations.
The price forecasting approaches proposed in the literature include time series analysis [1,2], agent based models [3], neural networks [4], support vector machines [5], and ARIMA models [6]. Conejo et al. (2005) compare time series analysis, neural networks and wavelets for electricity price forecasting in the PJM market [7]. Weron (2014) presents an extensive and rich resource on the literature, developments and future perspective of electricity price forecasting that covers the important research topics in the area [8]. The same can be said for load forecasting, as similar research is presented in the literature. Anand and Suganthi (2012) present a review of energy demand forecasting models,
discussing traditional methods such as time series analysis, regression, ARIMA and new methods such as support vector machines, ant colony and particle swarm optimization [9]; Hahn et al. (2009) present a survey of electricity load forecasting methods and tools for decision making [10].
On the other hand, studies that focus on price spikes are limited. Lu et al. (2005) and Zhao et al. (2007) use a data mining based approach [11,12]; Amjady and Keynia (2010) propose a hybrid data model that includes wavelet and time domain variables [13]; Amjady and Keynia (2011) also use probabilistic neural network and hybrid neuro-evolu-tionary systems [14]; Huisman (2008) analyzes the effect of tempera-ture on price spikes [15]; Mount et al. (2006) propose a stochastic re-gime-switching model to represent price volatilities and spikes [16]; Guan et al. (2001) analyze the historical bidding behavior in the Cali-fornia day-ahead market and analyze how bidding decisions increase prices and cause spikes [17].
In this paper, we use price and load data from the Turkish power market for the years 2012–2015. In Section2, we describe technical details for the data processing. In Section3.1, we classify price spikes that are demand or supply related and discuss major events. We then analyze the price and demand differences between the day ahead and the real time market in the Turkish power market. The load shedding and cycling also show the times when the day ahead forecast for the
https://doi.org/10.1016/j.esr.2019.100376
Received 12 August 2018; Received in revised form 17 June 2019; Accepted 6 July 2019 *Corresponding author.
E-mail address:[email protected](A. Yucekaya).
Available online 12 July 2019
2211-467X/ © 2019 Elsevier Ltd. This is an open access article under the CC BY-NC-ND license (http://creativecommons.org/licenses/by-nc-nd/4.0/).
T
results are used to assess the forecast accuracy of the operator. We provide conclusions in Section4.
2. Method and data processing
Abbreviations for the terms that are commonly used in the paper are given inTable 1.
As the real time demand deviates from the day ahead plan, it is expected that the real time price will be different from the day ahead price. The new prices in the load balancing market (DGP) are called the System Marginal Price (SMF). The system operator sheds or cycles re-quired load to balance the demand and constraints in the system. Bids for sheds or cycles are also considered and the winning offers are ac-cepted. In the load balancing market, the system operator cycles the load when the system shows an energy deficit and sheds the load when the demand in the system is lower than the supply. The market parti-cipants submit their final daily generation plans for the next day along with load shedding and cycling price offers.
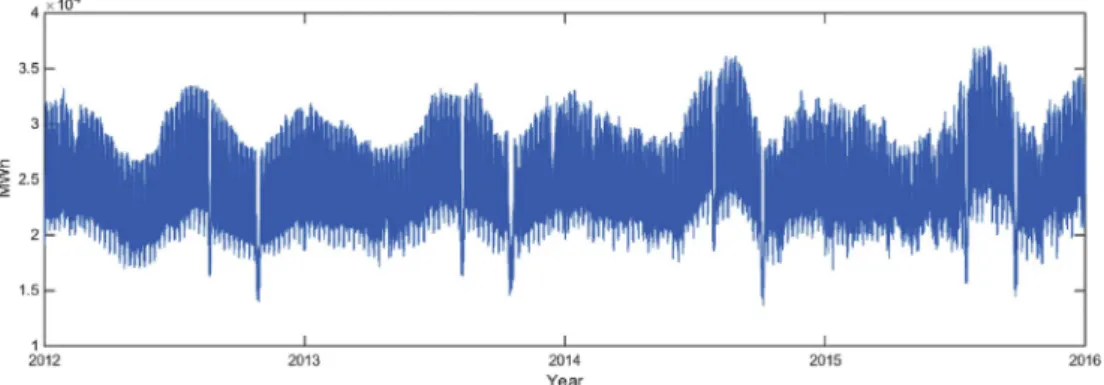
The data for the electricity market has been provided by the Independent System Operator EPIAS [18]. We use data for the whole country between 2012 and 2015.Fig. 1below shows the variations in demand for the period of 2012–2015 after adjustments for daylight savings time.
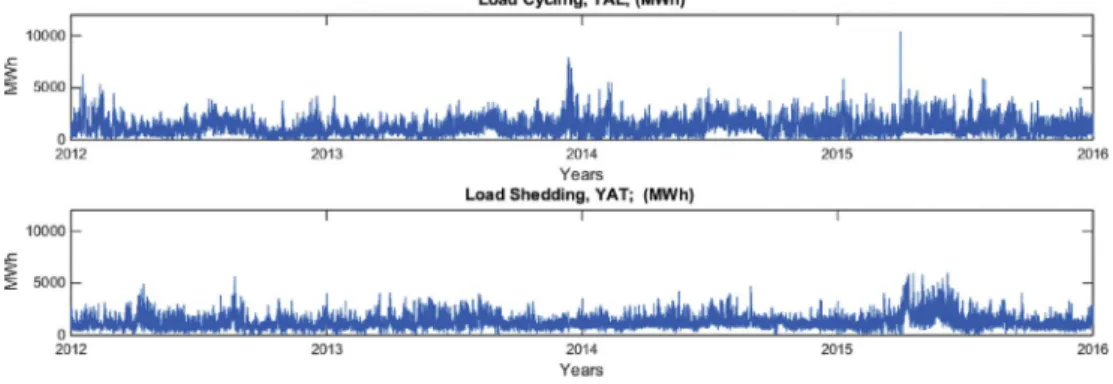
If the planned supply or demand in the real time market do not match the values determined in the day-ahead market, the system op-erator issues Load Shedding (YAT) or Load Cycling (YAL) instructions to balance the electricity surplus or deficit. Thus, the grid is balanced in terms of total supply and demand. The YAL orders are issued when more electricity is demanded than the quantity determined in the day ahead planning. The YAT orders are issued when the demand is less than the amount determined in the day ahead planning. Some electric power needs to be shaved from the system and the YAT orders are sent to the units which had won the bid to decrease generation. As the YAL and YAT offers are submitted separately and the market price is de-termined using a merit based order, a new price is realized.Fig. 2shows the YAL/YAT values for the period 2012–2015.
SMF is the imbalance price that shows the system direction in real time, whereas PTF is the reference price that occurs at the beginning of
PTF (1) = = LDR YTP YAL YTP YTP YAT YTP YAT YAL YTP (2)
In cases of energy deficits, the actual demand is greater than the planned demand and load cycling values are greater than the load shedding values. In this case, it is expected that the imbalance price SMF be greater than or equal to the reference price PTF. In a case of excess energy, the actual demand is less than the planned demand and load shedding is greater than the load cycling. Hence we expect the SMF to be less than or equal to the PTF. Load Deviation Ratio shows the ratio of total net deviation from forecasted load (YTP) for that hour. LDR itself is an important variable but in this paper it will be mainly used to explain the change in the price as the price is related with the load.
3. An analysis of price variations
3.1. The price spikes
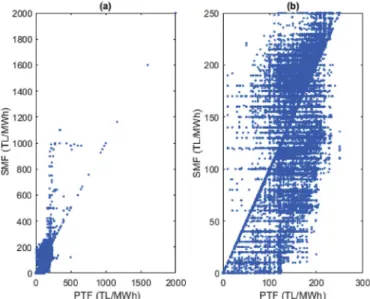
Fig. 3below shows the PTF and SMF prices between 2012 and 2015 for the Turkish Power Market.
The figure shows that PTF and SMF prices have similar patterns and fluctuations. In order to analyze the price spikes, we first determine the mean and standard deviation of PTF and SMF values and we define the price spike as a two sigma deviation from the mean value. The results show that a limit of 250 TL/MWh is appropriate to use for a spike. In Table 2, we present major price spikes in SMF indicating the times at which they occurred and their causes. *Table 2here *
The data inTable 2shows that the main cause for the price spikes is natural gas shortage. The annual percentage of natural gas based electricity generation is 43.8%, 47.9% and 38% for the years 2013, 2014 and 2015 respectively [18]. In general, cold weather conditions increase residential natural gas demand and make it difficult for natural gas fired power plants to get the required amount of natural gas to generate electricity. In addition, political conflicts sometimes bring unexpected supply problems for natural gas, effecting the electricity supply and prices.
Although the most drastic spikes in PTF and SMF values are due to
natural gas shortages during cold weather conditions, these prices are also affected by air conditioner usage. Such sudden problems experi-enced in real time might not affect PTF, but only affect SMF. Finally, power plant and system failures also lead to unexpected price move-ments. It has been observed that the causes of all price spikes fall in “natural gas shortage”, “hot weather” and “plant and system failure” categories, the latter including other random events and their percen-tages are displayed inFig. 4[19,20].
It can be seen that 56.9% of the spikes are due to problems in the generation of natural gas power plants which affect both the SMF and PTF. 29.2% of the spikes are due to other random events.
3.2. Analysis of load and price deviations
Day ahead and load balancing market prices: We recall that, the
day ahead price for each hour (PTF) is determined in the day ahead
Fig. 2. Load shedding (YAT) and load cycling (YAL) values (MWh) for 2012–2015.
Fig. 3. Hourly PTF and SMF (TL/MWh) values for 2012–2015. Table 2
The price spike occurrences and reasons in 2012–2015.
Year/Month Day of the month Reason Explanation
2012/January 17, 19–21, 23 Natural gas shortage Cold winter increased residential natural gas consumption 2012/February 3–17 Natural gas shortage Supply problems in international markets
2012/March 1,2 Natural gas shortage Cold winter increased residential natural gas consumption
2012/July 26 Plant outage Maintenance for major plants
2013/December 9-14, 16–18, 20, 23 Natural gas shortage Cold winter increased residential natural gas consumption 2014/February 6 Plant outage Cold winter increased maintenance requirements for some units 2014/February 7,11 Natural gas shortage Cold winter increased residential natural gas consumption
2014/July 23 Plant outage Maintenance for plants
2014/June 26, 30 Plant outage Maintenance for plants
2014/October 4 Plant outage Maintenance for plants
2014/November 25 Plant outage Maintenance for plants
2015/March 31 System Failure Maintenance for plants and the system
2015/April 1 System Failure Maintenance for plants and the system
2015/July 27,31 Plant outage/demand increase Maintenance for plants and increasing demand due to hot weather 2015/August 18–20
2015/September 2-4,7-8
market, based on the demand estimation (YTP). Variations in the de-mand and supply lead to load cycling (YAL) and load shedding (YAT) orders issued by the system operators and a bidding mechanism in the
It is shown that 60% of the PDR values are in the range of ± 20%, while 44% are in the range of ± 10%. In order to have a more precise evaluation, the distribution between ± 50% was re-examined with 0.05 intervals and given inFig. 6b. 35% of the data is in the range of ± 5% meaning that there is at most ± 5% difference between PTF and SMF. This shows that 35% of the PTF and SMF prices are equal or very close. This information is to show the percentage of cases where the day ahead price forecast is accurately reflected on the real time prices, i.e. they are equal.
Fig. 7presents the distribution of these cases. It is observed that 22.99% of the 35,064 hourly prices for PTF and SMF are equal, meaning that day ahead price match the real time price, i.e. the system operator was able to accurately forecast the demand and price. A total
Fig. 5. SMF and PTF values for 2012–2015 (a) Full data, (b) without spikes.
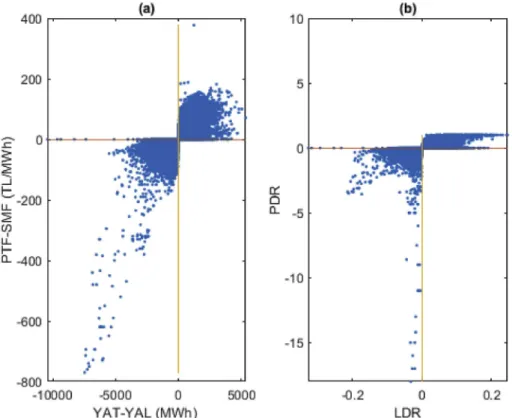
of 39.69% of the hourly PDR values are negative, i.e., PTF-SMF < 0 where the real time demand exceeds day ahead demand forecasts. A total of 36.49% of the deviations are positive, representing the hours when the real time demand is less than the forecast day ahead demand and PTF-SMF > 0. It is obvious that these instances represent occasions where the operator could not forecast the real time demand accurately. Note that there are 219 cases where SMF > PTF > 250 TL/MWh, 8 cases where PTF > SMF > 250 TL/MWh and 64 cases where SMF = PTF > 250 TL/MWh in the data set and they represent 0.83%. We have included PDR values for these instances to the histograms as it is
determined that they do not change the overall results.
The relation between load and price deviations: LDR values
were calculated using Eq.(2). If the value is negative, i.e. YAT < YAL, then it is expected that PTF < SMF and vice versa. In order to analyze the forecast accuracy, we classify the cases based on the PDR values.
There are 391 cases that do not follow the load deviation rule or price deviation rule. In 340 cases, corresponding to 1% of the total data, PTF > SMF when YAL > YAT while in 51 cases, SMF > PTF when YAT > YAL. Fig. 8a shows the (PTF-SMF) vs. (YAT-YAL) values for 35,064 values to show the amount of price and demand deviations.
Fig. 7. Distribution of price deviations.
Notice that a large part of the data concentrate in the 1st and 3rd quadrants, near the origin, as expected. This also verifies the price and demand relationship occurring between the day ahead market and the load balancing market, showing that when the demand is higher than expected, the real time price becomes higher than the day ahead price. On the other hand, the relationship between LDR and PDR should re-flect that they are also averaging to 0.Fig. 8b shows the relationship between LDR and PDR.
In addition to the PDR values depicted inFig. 8, it is also important to analyze the level of deviation between the day ahead and the real time price, i.e., PTF and SMF. The difference is calculated using the formula (PTF – SMF) andFig. 9shows the histogram for the distribu-tion. While 51% of the difference values are in the range of ± 20 TL/ MWh, 67% are in the range of ± 40 TL/MWh. PTF prices are lowest at the times when the lowest demand values are announced.
Fig. 10displays PTF and SMF values when the spikes are considered as outliers and replaced with the limit price of 250 TL/MWh. The de-viations are still observed, but are within a relatively acceptable range.
4. Conclusion
The extreme differences between the day ahead planning and real time market could be an indicator of system management problems. We have found that the most drastic price differences are due to natural gas shortage problems. We defined the load deviation and the PDR values to measure the deviation in the day ahead and real time demand and day ahead and real time price. We have found that the ratio of equal prices is 22.9%, the ratio when the PTF < SMF is 39.6% and PTF > SMF is 36.4% We have also found that 51% of the price
difference values are in the range of ± 20 TL/Mwh, while 67% are in the range of ± 40 TL/Mwh. It is shown that 60% of the PDR values are in the range of ± 20%, while 44% are in the range of ± 10% with 35% in the range of ± 5%. The results show that for 60% of the cases, the day ahead price forecast differed by ± 20% from the real time in which the cases where PTF-SMF > 0 is more.
References
[1] F.J. Nogales, J. Contreras, A.J. Conejo, R. Espinola, Forecasting next-day electricity prices by time series models, IEEE Trans. Power Syst. 17 (2) (2002) 342–348. [2] R.C. Garcia, J. Cotreras, M. Van Akkeren, J.B.C. Garcia, A GARCH forecasting model
to predict day-ahead electricity prices, IEEE Trans. Power Syst. 20 (2) (2005) 867–874.
[3] D.W. Bunn, Forecasting loads and prices in competitive power markets, IEEE Proc. 88 (2) (2000) 163–169.
[4] D. Singhal, K.S. Swarup, Electricity price forecasting using artificial neural net-works, Int. J. Electr. Power Energy Syst. 33 (3) (2011) 550–555.
[5] Z. Shao, S.L. Yang, F. Gao, K. Zhou, P. Lin, A new electricity price prediction strategy using mutual information-based SVM-RFE classification, Renew. Sustain. Energy Rev. 70 (2017) 330–341.
[6] J. Contreras, R. Espinola, F.J. Nogales, A.J. Conejo, ARIMA models to predict next-day electricity prices, IEEE Trans. Power Syst. 18 (3) (2003) 1014–1020. [7] A.J. Conejo, J. Contreras, R. Espínola, M.A. Plazas, Forecasting electricity prices for
a day-ahead pool-based electric energy market, Inter. J. Forecast. 21 (3) (2005) 435–462.
[8] R. Weron, Electricity price forecasting: a review of the state-of-the-art with a look into the future, Int. J. Forecast. 30 (4) (2014) 1030–1081.
[9] S.A. Anand, L. Suganthi, Energy models for demand forecasting—a review, Renew. Sustain. Energy Rev. 16 (2) (2012) 1223–1240.
[10] H. Hahn, S. Meyer-Nieberg, Stefan Pickl, Electric load forecasting methods: tools for decision making, Eur. J. Oper. Res. 199 (3) (2009) 902–907.
[11] X. Lu, Z.Y. Dong, X. Li, Electricity market price spike forecast with data mining techniques, Electr. Power Syst. Res. 73 (1) (2005) 19–29.
[12] J.H. Zhao, Z.Y. Dong, X. Li, K.P. Wong, A framework for electricity price spike Fig. 9. Histogram of the differences between market price values PTF-SMF, (TL/MWh).
analysis with advanced data mining methods, IEEE Trans. Power Syst. 22 (1) (2007) 376–385.
[13] N. Amjady, F. Keynia, Electricity market price spike analysis by a hybrid data model and feature selection technique, Electr. Power Syst. Res. 80 (3) (2010) 318–327. [14] N. Amjady, F. Keynia, A new prediction strategy for price spike forecasting of
day-ahead electricity markets, Appl. Soft Comput. 11 (6) (2011) 4246–4256. [15] R. Huisman, The influence of temperature on spike probability in day-ahead power
prices, Energy Econ. 30 (5) (2008) 2697–2704.
[16] T.D. Mount, Y. Ning, X. Cai, Predicting price spikes in electricity markets using a regime- switching model with time-varying parameters, Energy Econ. 28 (1) (2006) 62–80.
[17] X. Guan, Y.-C. Ho, D.L. Pepyne, Gaming and price spikes in electric power markets, IEEE Trans. Power Syst. 16 (3) (2001) 402–408.
[18] EPIAS, available online at:https://www.epias.com.tr/gun-oncesi-piyasasi/surecler. [19] EPIAS, available online at:https://rapor.epias.com.tr.