RESEARCH ARTICLE
Utilizing a responsive web portal for studying
disc tracing agreement in retinal images
Abdullah SarhanID1*, Andrew Swift2, Adam Gorner2, Jon Rokne1, Reda Alhajj1,3,4,
Gavin Docherty5, Andrew Crichton5
1 Department of Computer Science, University of Calgary, Calgary, Canada, 2 Cumming School of Medicine,
University of Calgary, Calgary, Canada, 3 Department of Computer Engineering, Istanbul Medipol University, Istanbul, Turkey, 4 Department of Health Informatics, University of Southern Denmark, Odense, Denmark,
5 Department of Ophthalmology and Visual Sciences, University of Calgary, Calgary, Canada
Abstract
Glaucoma is a leading cause of blindness worldwide whose detection is based on multiple factors, including measuring the cup to disc ratio, retinal nerve fiber layer and visual field defects. Advances in image processing and machine learning have allowed the develop-ment of automated approached for segdevelop-menting objects from fundus images. However, to build a robust system, a reliable ground truth dataset is required for proper training and vali-dation of the model. In this study, we investigate the level of agreement in properly detecting the retinal disc in fundus images using an online portal built for such purposes. Two Doctors of Optometry independently traced the discs for 159 fundus images obtained from publicly available datasets using a purpose-built online portal. Additionally, we studied the effective-ness of ellipse fitting in handling misalignments in tracing. We measured tracing precision, interobserver variability, and average boundary distance between the results provided by ophthalmologists, and optometrist tracing. We also studied whether ellipse fitting has a posi-tive or negaposi-tive impact on properly detecting disc boundaries. The overall agreement between the optometrists in terms of locating the disc region in these images was 0.87. However, we found that there was a fair agreement on the disc border with kappa = 0.21. Disagreements were mainly in fundus images obtained from glaucomatous patients. The resulting dataset was deemed to be an acceptable ground truth dataset for training a valida-tion of models for automatic detecvalida-tion of objects in fundus images.
Introduction
A study by Bourne et al. indicates that, as of 2015, there were approximately 444 million people living with visual impairments worldwide; 39 million of these were blind, 216 million had moderate to severe visual impairment, and 189 million had mild visual impairment [1]. A major contribution to these statistics comes from vision loss to glaucoma. It is the world’s sec-ond leading cause of irreversible vision loss after cataracts, accounting for 12% of cases of blindness annually [2]. It is estimated that the number of people between the ages of 40–80 a1111111111 a1111111111 a1111111111 a1111111111 a1111111111 OPEN ACCESS
Citation: Sarhan A, Swift A, Gorner A, Rokne J,
Alhajj R, Docherty G, et al. (2021) Utilizing a responsive web portal for studying disc tracing agreement in retinal images. PLoS ONE 16(5): e0251703.https://doi.org/10.1371/journal. pone.0251703
Editor: Yuchen Qiu, University of Oklahoma,
UNITED STATES
Received: July 23, 2020 Accepted: May 2, 2021 Published: May 25, 2021
Copyright:© 2021 Sarhan et al. This is an open access article distributed under the terms of the
Creative Commons Attribution License, which permits unrestricted use, distribution, and reproduction in any medium, provided the original author and source are credited.
Data Availability Statement: All relevant data
required to reproduce the results of this study can be accessed at the following link:https://data. mendeley.com/datasets/7xv5rzxgrh/1. Additional data can be accessed using the following link:
http://www.aisarhan.com/fundusportal/login. To obtain credentials to access this second portal, please contact the Corresponding Author at
Funding: This study was funded by the Calgary Eye
affected by glaucoma will increase from the present of 80 million to 111.8 million by 2040 [3]. Furthermore, 2.4% of all individuals and 4.7% of those over 70 are at risk of developing this condition [4].
The term glaucoma refers to a condition caused by a group of diseases that leads to the degeneration of retinal ganglion cells (RGCs). The death of RGCs leads to (i) structural changes to the optic nerve head and the nerve fiber layer and (ii) simultaneous functional con-striction of the visual field [4–6]. These two effects of glaucoma cause peripheral vision loss and, if left untreated, can eventually lead to blindness. One possible indicator of glaucoma is increased intraocular pressure (IOP), which can damage the RGCs, resulting in nerve fibre layer atrophy and thus structural changes to the optic nerve head.
Current approaches for glaucoma detection rely on manual interpretation of fundus images by optometrists and ophthalmologists. First patients would visit an optometrist who will then be referred to an ophthalmologist or not based on the interpretation of the fundus image. This interpretation is both critical and time-consuming and relies on the experience of the ophthal-mologist/optometrist. in particular, they have difficulties in detecting the initial stages of glau-coma. As a result, about 80% of early-onset glaucoma cases may go undiagnosed [7]. Thus, there is a critical need for automated tools to accurately detect glaucoma which will then have the potential to decrease blindness due to glaucoma [7].
The advent of machine learning has opened up new possibilities for the automatic analysis of medical images and in particular for analyzing and segmenting fundus images. for the detection of various eye conditions, such as glaucoma and diabetic retinopathy [6,8].
With the rise of deep learning comes the potential for achieving high performance when automating the segmentation of various objects from retinal images such as disc segmentation [9–11]. However, a common requirement for proper training for these models is the availabil-ity of a ground truth dataset. Creating such datasets with reliable ground truth labeling can be both subjective and time-consuming [12,13]. Furthermore, issues of subjectivity in the label-ing by experts add to the difficulty of developlabel-ing the dataset. To handle the time issue research-ers have been using crowdsourcing to annotate and label a large number of images, especially in telemedicine. Unfortunately, the application of this approach has not yet demonstrated that the results are reliable enough to be used as ground truths.
In the context reliable is defined in terms of several experts making the same identification of an object or objects in a fundus image. While this is a somewhat imprecise definition it reflects the underlying problem of making an absolute definition of objects in a fundus image. This problem also occurs in other deep learning approaches where it is overcome by also increasing the sizes of the datasets.
Most crowdsourcing approaches in the retinal field have focused on comparing the classifi-cation accuracy of non ophthalmologists/optometrists undergoing a brief training instead of comparing the tracing done for various anatomical retinal objects [14]. Mitry et al., [15] con-ducted a study utilizing the crowdsourcing technique that focuses on discriminating between normal and glaucomatous discs. Amazon’s Mechanical Turk platform was used to recruit par-ticipants known as knowledge workers (KW) from the online community [16] with the KWs that perform well being denoted as “masters”. The study obtained 2,540 classifications for 127 color fundus images within 24 hours and the performance of KWs with previous experience in performing such a task was compared to those without. The average area under curve (AUC)-a perform(AUC)-ance me(AUC)-asure for bin(AUC)-ary cl(AUC)-assifier where (AUC)-a v(AUC)-alue closer to 100 indic(AUC)-ates gre(AUC)-ater per-formance-achieved was 62.75%, with no significant difference between the two groups. How-ever, specificity was very low (38.9%). Further, they did not measure the agreement between KWs. Mitry et al., [17] performed another crowdsourcing study as an extension to the previous one they conducted [15]. In this study, they found an overall sensitivity of 71% and specificity machine to develop the system and conduct the
analysis. The funders had no role in study design, data collection and analysis, decision to publish, or preparation of the manuscript.
Competing interests: The authors have declared
of 87% for all classifications and a masters-only group achieved the highest performance, which was 10% superior to that of the non-masters.
The study conducted by Son et al., [18], measured the accuracy of KWs recruited using Amazon Mechanical Turk in correctly localizing abnormalities in 109,985 images. However, they neither localized the disc boundaries nor the peripapillary atrophy (PPA), which are indicators of glaucoma [19]. Another study measures the performance of experi-enced ophthalmologists instead of KWs [20]. On average, three experienced raters agreed that an abnormality was present for 46.4% of the images, whereas two raters were in agree-ment for 69.9% of the images. The agreeagree-ment rate when all three raters participated ranged from 5.7% to 43.3%. However, none of these approaches works when attempting to trace a disc.
None of the studies discussed above focused on comparing the tracing performed for the disc in retinal fundus images, nor did they investigate participants’ ability to discriminate between the disc border and the PPA, which is important when diagnosing glaucoma [19]. Rather, these studies mainly focused on image classification and/or identifying regions with abnormalities and did not measure the level of agreement between different groups of participants.
In this study, we investigate the tracing done by two doctors of optometry OD1 and OD2, for the retinal disc by utilizing a responsive web portal built for such purposes. This portal can also be used for the identification of other objects in the retina. Unlike other desktop applica-tions, such as MS-Paint that work on some devices with a specific operating system, the portal can also be used on any device with access to a browser and internet, including mobile phones, tablets, laptops, and desktops. Doing so allows users to perform tracing for fundus images regardless of the type of device they are using. Additionally, we compare the tracing performed by the two optometrists with previous ones performed by ophthalmologists which are pro-vided by the publishers of these datasets.
Exact tracing can be time-consuming, but it is required to develop a ground truth that can be used to train machine learning models for consistent and proper segmentation of retinal objects. For instance, it is important to be able to discriminate between disc bound-ary and PPA region when diagnosing glaucoma. Hence, the goal of this study is to investi-gate and compare the tracing of the disc performed by the two optometrists through the responsive online portal that we developed. To our knowledge, there is no publicly available portal similar to the one developed in this study. Our contributions can be listed as follows:
1. We demonstrated the level of agreement/disagreement between optometrists for disc tracing.
2. We demonstrated the level agreement/disagreement between ophthalmologists and optometrists.
3. We showed that using ellipse fitting for adjusting misalignments in the traced disc does not always perform well especially in the case of glaucoma.
4. We published the new tracings performed by the optometrists so that researchers can use the data as a ground truth dataset when developing their models.
5. We developed an online portal that can be used for annotating discs by multiple contribu-tors. This portal can be expanded to other retinal object and even be used for educational purposes.
Materials and methods
The doctors of optometry OD1 and OD2 and one ophthalmologist specializing in glaucoma were involved in this study. The two optometry doctors were responsible for tracing the disc and the glaucoma specialist investigated the images that had a high disagreement. Each optom-etry doctor traced the discs in retinal images independently, using their own laptops/tablets. They used the built-in features of the web portal to perform the tracing. This section discusses the datasets used, together with how the tracing was done and the statistical analysis
conducted.
Datasets
The publicly available datasets Drishti, [21], and ARIA, [22], were used in this study. A total of 159 images were used from these datasets. One of the reasons for using these datasets is that we wished to evaluate tracing variability when different retinal conditions were presented. Additionally, these datasets are the most commonly used datasets by researchers working in the field of ophthalmology and machine learning. Of the images, 69 depicted cases of glau-coma, 53 diabetic retinopathy, and 37 depicted normal cases. The normal and glaucomatous images were obtained from the Drishti dataset, while those depicting diabetic retinopathy (DR) were obtained from the ARIA dataset. The images in the ARIA dataset are taken from a 50-degree field of view and stored in “.tif” format, with dimensions of 768× 576 pixels, while those from the Drishti dataset are taken from a 30-degree field of view and stored in “.png” for-mat, with dimensions of 2,896× 1,944 pixels.
Each image obtained from these datasets had its own disc ground truth provided by a spe-cialist ophthalmologist. Hence, in our analysis, we considered the ground truth provided in these datasets as our reference if the two doctors of optometry properly trace the disc or not. When high disagreement occurred the glaucoma specialist would investigate the reason behind this disagreement. All tracings generated in this study are available online for research-ers to use for further investigation [23]. Note that we did not collect any new retinal images and hence we just used those publicly available datasets and compared the tracing performed in our study to the ground truth provided in these datasets. We did not need to obtain ethics approval as this was already performed by the researchers who collected the images and made them available.
Study design
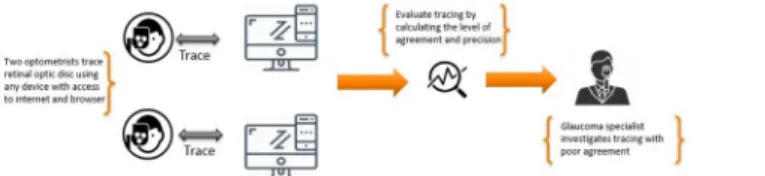
Two optometry doctors were involved in this study; their primary role was to trace the discs in the images obtained from the Drishti and ARIA datasets. These two datasets provided ground truth for discs obtained from the experienced ophthalmologists. Each optometrist involved in this study was assigned the sets of images (159 images in total) through the web portal, where they also traced the discs. The tracing was done independently and without consulting with each other.Fig 1summarizes the overall process by which this stage of the research was conducted.
Fig 1. Tracing and data collection flow adopted in this study. https://doi.org/10.1371/journal.pone.0251703.g001
Once the pop-up model appears, the user can start tracing. An erase option is presented should the user wish to erase any of the tracings. We keep track of the time when the users start tracing and when this tracing is finished. Once the tracing is done, the user can click on the submit button, which will allow the storage of tracing information on a dedicated server. Users have the option either to trace the whole disc at once or in steps. Upon successful sub-mission of the tracing, the traced image will be eliminated from the list of images on the trac-ing page and the number of untraced images at the top of the page,Fig 2, will also be
decreased. Once the data had been stored, the traced images could be compared, and the oph-thalmologist could investigate the reasons behind any significant disagreement mainly between optometrists.
Statistical analysis
Three statistical evaluation techniques are adopted in this study, namely the Cohen’s kappa statistic [24] (to measure inter-agreement between the optometrists and between optometrists and available ground truth), the dice coefficient (to measure the precision of locating of the disc region) and average boundary distance (to measure precision in detecting disc border). The kappa calculation was calculated usingEq 1wherePo is the observed proportionate
agree-ment andPe is the probability of both optometrists saying either yes or no concerning whether
a specific pixel should be considered as being in the disc region or not. When calculating the kappa value, we only included the area surrounding the disc. To do this we retrieved the lowest
x, lowest y, highest x, and highest y values among the disc ground truth and tracing done by
optometrists. Then we drew a bounding box which was used to calculate the kappa. There are various interpretations of kappa values; however, in this study, we adopted the most com-monly used interpretation [25]. The cut off values are as follows:
1. below 0 ) less than chance agreement 2. 0.01-0.2 ) poor agreement
3. 0.21-0.40 ) fair agreement 4. 0.41-0.60 ) moderate agreement 5. 0.61-0.80 ) substantial agreement 6. 0.81-0.99 ) almost perfect agreement
k ¼Po Pe
1 Pe
ð1Þ
Fig 2. Web portal showing images assigned to the optometrists along with the pop up dialogue displayed once an image is pressed.
For the dice coefficient (DC) calculation, we usedEq 2, whereA is the ground truth area
andB is the area traced by the optometrist. A DC value of 1 means that the tracing of the
optometrist agreed with the ground truth. However,DC does not indicate how precise the
optometrists were in identifying disc boundary. Hence, we used another evaluation technique for this task known as the average boundary distance (μd). This evaluation method compares
the disc ground truth with the tracing done by each optometrist [26]. We usedEq 3, wheredkg
anddpkare the distance from the ground truth’s tracing centroid to the intersection point with
the expert’s and optometrist’s tracings respectively at a given anglek. We calculated the
dis-tance in 12 directions namely 0˚, 20˚, 60˚, 90˚, 120˚, 150˚, 180˚, 210˚, 240˚, 270˚, 300˚, and 330˚. At each angle, a line is drawn from the centroid of the disc (Cg). Then the intersection
points between this line and ground truth, OD1, and OD2 tracing is detected at each of these 12 directions. An overview of the centroid and the 12 directions is shown inFig 3. Moreover, we also show the distance difference betweendgkandd
p k. DC ¼ 2 � AreaðA \ BÞ AreaðAÞ þ AreaðBÞ ð2Þ md¼1 n Xn k¼1 jdgk d p kj ð3Þ
While performing the analysis, we also noticed a calibration issue in that some of the trac-ings were misaligned. These misalignments were due to tractrac-ings deviating from their intended paths. While this issue could be fixed by erasing the misalignment, this process was fairly time-consuming. We hence used an approach called ellipse fitting to fix these misalignments by pro-ducing perfectly aligned ellipses; we then compared the tracings before and after the applica-tion of ellipse fitting. Another reason for using ellipse fitting is that various approaches claim that the discs tend to have an elliptic shape [6].
The least-square fitting approach identifies the smallest circle that can traverse all given traced pixels; specifically, we adopted the algorithm developed by Halir and Flusser [27].
Fig 3. Retinal images showing lines draw from the centroid to expert (green) and optometrist (blue) traced boundary in different directions.
GivenEq 4, where A,B,C,D,E, and F are the coefficients of the ellipse andB2− 4AC < 0, gener-ate an ellipse by minimizing the square of the algebraic distance of the points to the ellipsoid plane. This can be achieved by first calculating the design matrices as shown in matrices5and
6. These design matrices are then utilized to calculate the scattered plots as shown inEq 7. The scatter plots are then reduced using the constrained coefficient in matrix8to produce the reduced matrix usingEq 9where I and T represent the identity and transpose of the related matrices. The reduced scattered matrix is utilized to calculate eigenvectors and then extract the ellipse coefficients namely the center, width and height of the ellipse, and rotation angle. Addi-tional information about the effectiveness of this approach with respect to other ones can be found in [27]. Ax2 þBxy þ Cy2 þDx þ Ey þ F ¼ 0 ð4Þ D1¼ x2 1 x1�y1 y 2 1 .. . .. . .. . x2 n xn�yn y 2 n 0 B B B B @ 1 C C C C A ð5Þ D2¼ x1 y1 1 .. . .. . .. . xn yn 1 0 B B B B @ 1 C C C C A ð6Þ S1¼DT1 �D1;S2¼D1T�D2;S3¼DT2 �D2 ð7Þ C1 ¼ 0 0 2 0 1 0 2 0 0 0 B B B @ 1 C C C A ð8Þ M ¼ C1I� ðS 1 S2�SI3�S2 TÞ ð9Þ
Once the preceding steps were completed, we then measured the level of agreement between the two optometrists concerning the identification of the disc region both with and without ellipse fitting. We also investigated whether the level of agreement between the images taken from the Drishti and ARIA databases depended on the fundus status (i.e., normal, glau-coma, and diabetic retinopathy). Moreover, we investigated the level of precision with respect to the available ground truth for properly detecting the disc regions between the two datasets and among different retinal image statuses. Further, we study the level of agreement with regard to correctly detecting the disc boundary and how precise the optometrists were in doing so. All data generated in this study is publicly available for use by researchers [23].
Results
In this section, we discuss various analysis techniques applied on the tracing performed by OD1 and OD2 along with comparing them with ground truth. A summary of the results before and after applying ellipse fitting can be seen in Tables1and2respectively. Additionally,
Figs4and5demonstrate the performance of ellipse fitting in fixing the misalignment in the tracing of the optometrists. We realized that applying ellipse fitting does not always improve the precision in tracing. For instance, inFig 4when applying ellipse fitting the DC has increased 96.8% to 98.1% for the Drishti image while for the Aria image, the DC has increased from 95.6% to 96.1%. However, this was not the case inFig 4where the DC for the Drishti after applying ellipse fitting decreased from 90.59% to 89.35% and from 86.28% to 84.73% for the Aria image. We should emphasize that the Drishti dataset is mainly for glaucoma while the Aria dataset is for patients with diabetic retinopathy.
Tracing agreement
To measure the level of agreement between the two optometrists OD1 and OD2, we calculated the kappa value for the level of agreement between the optometrists in disc tracing. We calcu-lated the level of agreement in terms of locating the disc region in each dataset. Before the application of ellipse fitting, the level of agreement for the Drishti dataset was 0.86, while that for the ARIA dataset 0.84, which were both almost perfect. After applying ellipse fitting, the level of the agreement changed slightly, with the level for Drishti being 0.88 and for ARIA 0.86, as shown inFig 6. As can be seen in this figure, after applying ellipse fitting, we realized there was an improvement in some images in the Drishti dataset, as their kappa values increased from 0.94 to 0.96; meanwhile, the kappa values for some images from the ARIA set increased from 0.92 to 0.95. We also realized the kappa value for the image with the lowest agreement score in the Drishti dataset improved from 0.55 to 0.59. While this was not a significant improvement, it shows the effect of misalignment in tracing and how ellipse fitting can be used to address this issue in some images but not to all.
We took the analysis one step further by investigating whether there was a difference in determining the disc region as a result of retinal status. We measured the level of agreement with respect to the presence of retinal conditions, namely glaucoma, diabetic retinopathy (DR), and normal eyes (seeFig 6A and 6B). We compared the results with and without ellipse fitting. The levels of agreement before applying ellipse fitting for glaucoma, DR, and normal were 0.87, 0.84, and 0.84, respectively, which are slightly lower than the levels achieved after applying ellipse fitting, which were 0.91, 0.86, and 0.85, respectively. The major improvement has occurred in the images related to glaucoma. It is also clear how the distribution of kappa
Table 1. The values for DC, kappa, and boundary when comparing OD1 with OD2, OD1 with ground truth (G), and OD2 with ground truth (G) before applying ellipse fitting.
Dice Coefficient Kappa (region) Kappa (border) Boundary (pixels)
Drishti Aria Drishti Aria Drishti Aria Drishti Aria
OD 1 vs OD 2 - - 0.86 0.84 0.09 0.15 6.60 1.80
OD 1 vs G 0.95 0.92 0.86 0.80 0.015 0.09 6.90 3.20
OD 2 vs G 0.95 0.93 0.85 0.80 0.02 0.05 7.70 3.40
https://doi.org/10.1371/journal.pone.0251703.t001
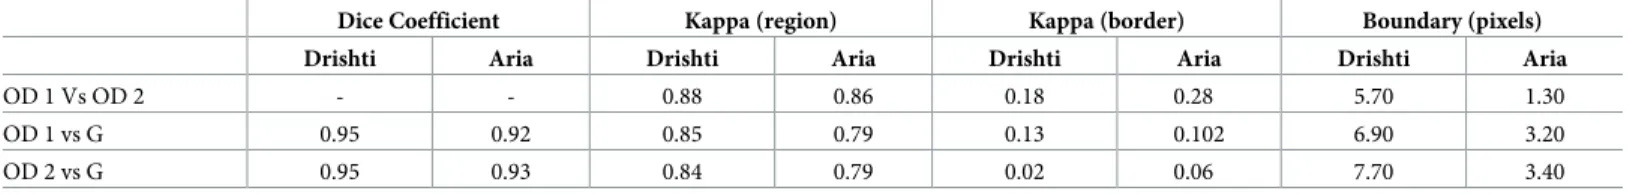
Table 2. This table summarizes the values for DC, kappa, and boundary when comparing OD1 with OD2, OD1 with ground truth (G), and OD2 with ground truth (G) after applying ellipse fitting.
Dice Coefficient Kappa (region) Kappa (border) Boundary (pixels)
Drishti Aria Drishti Aria Drishti Aria Drishti Aria
OD 1 Vs OD 2 - - 0.88 0.86 0.18 0.28 5.70 1.30
OD 1 vs G 0.95 0.92 0.85 0.79 0.13 0.102 6.90 3.20
OD 2 vs G 0.95 0.93 0.84 0.79 0.02 0.06 7.70 3.40
values for the images changed before and after ellipse fitting, as can be seen inFig 6C and 6D. This change is reflected by the fact that the image with the lowest level of agreement in the Drishti sample has a better level of agreement after the application of ellipse fitting. Such improvement in the level of agreement is mainly because one of the ODs encountered calibra-tion issues while tracing the disc. However, the applicacalibra-tion of ellipse fitting did not always lead to an improvement in results, checkFig 5, and highly dependant on how much miss alignment was produced by the optometrist when tracing the disc.
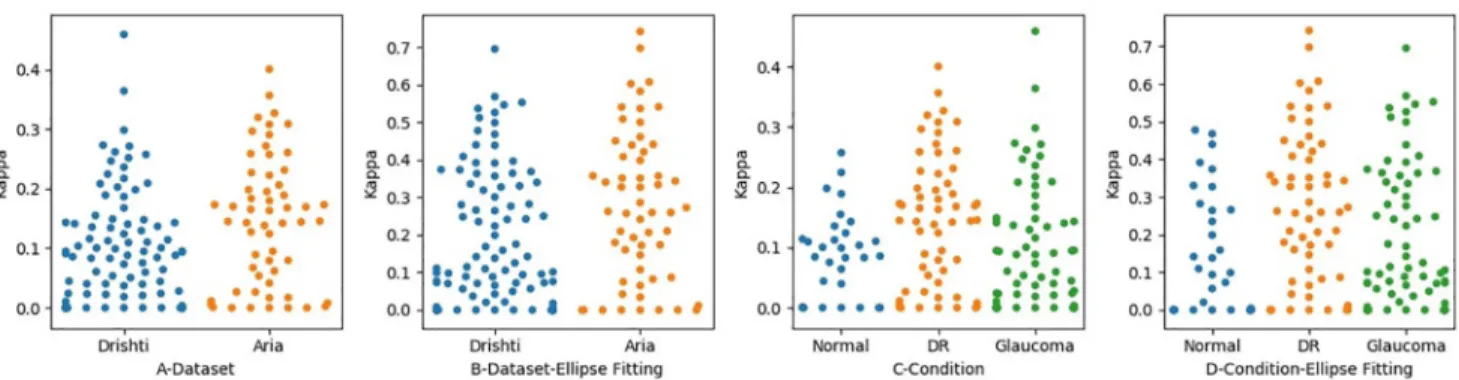
Measuring the level of agreement with regard to detecting the disc regions was found not reliable in determining the level of agreement in detecting disc borders. We also measured the level of agreement between OD1 and OD2 in locating the disc border. We first checked the level of agreement based on the dataset and then based on retinal condition, as shown inFig 7A and 7B. The levels of agreement between the two optometrists before applying ellipse fitting to the Drishti and ARIA datasets were 0.09 and 0.15 respectively, which are lower than the
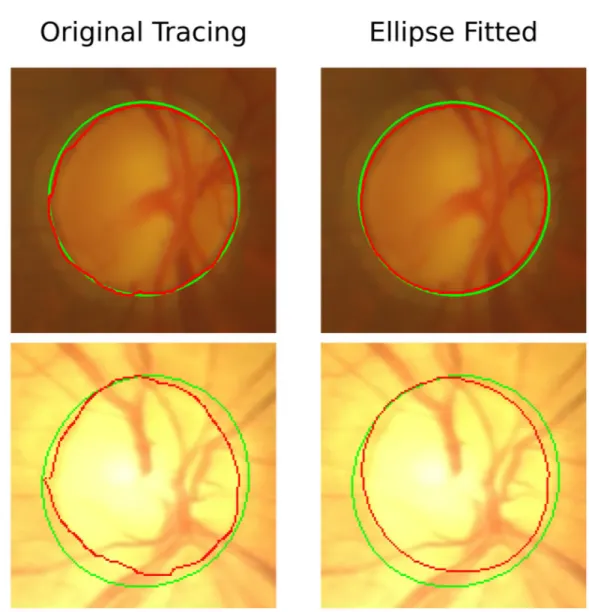
Fig 4. Images obtained from the Drishti and ARIA datasets showing improved disc tracing when ellipse fitting is applied. The first row represents an
image from the Drishti dataset before and after applying ellipse fitting. The second row is similar to the first one but for an image obtained from the Aria dataset. The green tracing represents the ground truth and the red represents the tracing performed by the optometrist. The application of Ellipse fitting led to an increase of DC from 96.80% to 98.10% for the Drishti image from 95.60% to 96.10% for the Aria image.
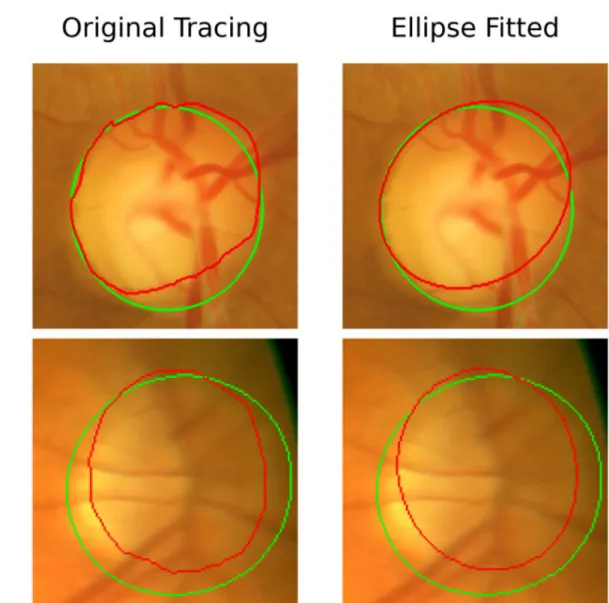
Fig 5. Images obtained from the Drishti and ARIA datasets showing ellipse fitting lead to lower precision in the traced disc region. The first row
represents an image from the Drishti dataset before and after applying ellipse fitting. The second row is similar to the first one but for an image obtained from the Aria dataset. The green tracing represents the ground truth and the red represents the tracing performed by the optometrist. The application of Ellipse fitting led to a decrease of DC from 90.59% to 89.35% for the Drishti image from 86.28% to 84.73% for the Aria image.
https://doi.org/10.1371/journal.pone.0251703.g005
Fig 6. The level of agreement between the optometrists when identifying disc region. Figures A and B Show the Level of Agreement in each Dataset.
Figures C and D show the Level of Agreement in Regard to Retinal Condition.
levels of agreement after applying ellipse fitting, which were 0.18 and 0.28, respectively. Thus, the level of agreement after applying ellipse fitting improved from poor to fair for the ARIA dataset but remained poor for the Drishti. We also found that the level of agreement with regard to the ARIA dataset was slightly better than that for the Drishti dataset before applying ellipse fitting; this is mainly because of the presence of PPA in glaucomatous images. The levels of agreement for some images in the Drishti and ARIA datasets improved from moderate to substantial agreement, which is considered a significant improvement. However, in some images, the level of agreement decreased to zero; this likely occurred due to misalignment towards the disc center and/or because ellipse fitting takes the minimal point, meaning that the disc boundary will change.
When we measured the level of agreement in detecting the disc region, we also measured the level of agreement in detecting the disc border based on retinal status (seeFig 7C and 7D). The levels of agreement for glaucoma, DR, and normal retinal images before applying ellipse fitting were 0.09, 0.15, and 0.08, respectively, which are considered to be very poor values and are lower than the levels of agreement achieved after the application of ellipse fitting (0.19, 0.3, and 0.2 for glaucoma, DR, and normal images, respectively, with these values being considered to represent fair levels of agreement). Applying ellipse fitting helped to improve the level of agreement from poor to fair in boundary identification, particularly for images related to glau-coma. However, this level of agreement is still low and may have a negative impact on patient referrals, especially for those with glaucoma. We can also realize that glaucomatous images have the lowest level of agreement among other images.
Tracing precision
Measuring inter-agreement between the optometrists made it possible to obtain a value for the level of agreement, but it did not indicate how precise the optometrists were. To measure the level of precision in detecting the disc region, we calculated the dice coefficient usingEq 2. We calculated the dice coefficient for OD1 and OD2 with respect to the available ground truth. The dice coefficient is useful when measuring precision as dependent on the volume of a traced object but not when measuring precision in detecting an object’s boundary. For this task, we used another approach called average distance boundary as discussed in section 1. We appliedEq 3to each image for the tracing done by each optometrist.
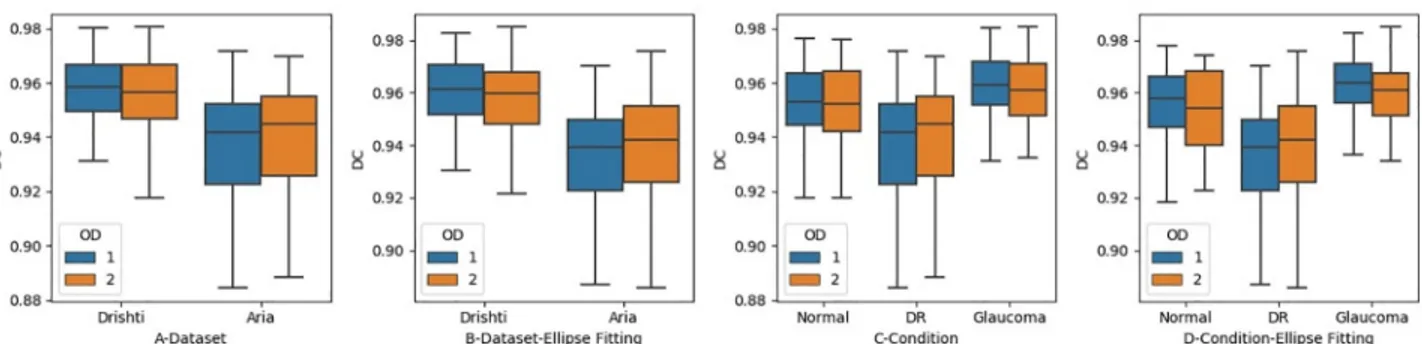
We first measured the level of precision in detecting the disc region in each dataset, regard-less of the retina status, before and after applying ellipse fitting, as shown inFig 8A and 8B. The DC values obtained by OD1 were 0.95 for the Drishti dataset and 0.92 for the ARIA
Fig 7. The level of agreement between the optometrists when identifying disc region. Figures A and B Show the Level of Agreement in each Dataset.
Figures C and D show the Level of Agreement in Regard to Retinal Condition.
dataset, while OD2 achieved 0.95 for the Drishti dataset and 0.93 for the ARIA dataset. The level of precision did not improve significantly after the application of ellipse fitting, as it stayed almost the same (seeFig 8). However, images with low levels of tracing precision improved after the application of ellipse fitting. Both optometrists performed almost the same in identifying disc region.
We also investigated whether the level of precision in terms of detecting the disc region was affected by retinal status, both before and after the application of ellipse fitting, as shown inFig 8C and 8D. The levels of precision for OD1 before applying ellipse fitting were 0.95, 0.92, and 0.94 for glaucoma, DR, and normal retinal images, respectively, while those for OD2 were 0.95, 0.92, and 0.95. However, ellipse fitting did not lead to improvement in the precision, as the values remained roughly the same. We can also realize that ellipse fitting helped to slightly improve the tracing precision for OD2. However, for some images, ellipse fitting has a negative effect when being compared with the ground truth. This is depending on where the misalign-ment occurred, and how frequently it happened. Overall, we can see improvemisalign-ment in the lower and upper bounds inFig 9before and after applying ellipse fitting. Moreover, the levels of precision in glaucoma and normal images for both optometrists remained almost the same after the application of ellipse fitting, but we can realize improvements in the upper and lower bounds along with the median value.
In addition to measuring the level of agreement in detecting the disc border, we also mea-sured the level of precision in correctly identifying the disc boundary by OD1 and OD2 both before and after applying ellipse fitting to each dataset, as shown inFig 9A and 9B. Instead of using the dice coefficient, we used the average boundary distance measure described earlier to measure boundary tracing precision with respect to the available ground truth. The average
Fig 9. The level of precision between the optometrists when identifying disc border. Figures A and B Shows the Level of Precision in each Dataset.
Figures C and D show the Level of Precision in Regards to Retinal Condition.
https://doi.org/10.1371/journal.pone.0251703.g009
Fig 8. The level of precision between the optometrists when identifying disc region. Figures A and B Show the Level of Precision in each Dataset.
Figures C and D show the Level of Precision in Regards to Retinal Condition.
boundary distance before applying ellipse fitting for OD1 were 6.9 and 3.2 pixels for the Drishti and ARIA datasets, respectively, while those for OD2 were 7.7 and 3.4 pixels. These results revealed some information that could not be discovered using only DC values. DC val-ues showed perfect precision in identifying disc region, but this was not the case when trying to check for the boundary. Moreover, in some cases, the difference between ground truth and optometrist tracing distance reached 53 pixels. It can thus be concluded that the optometrists were unable to correctly detect the disc boundary mainly in the Drishti dataset. This can also be correlated to a poor level of agreement achieved in detecting disc boundary. The application of ellipse fitting did not affect the overall results forμd. Moreover, the results showed poor tracing precision in the glaucomatous dataset (Drishti). OD1 performed better than OD2 and this can be clearly seen inFig 9. Such observations can not be achieved without using evalua-tions similar to the boundary distance one.
A similar measurement was applied to gauge the average boundary distance in terms of determining retinal image status for the two optometrists before and after applying ellipse fit-ting (Fig 9C and 9D). The levels of boundary distance for OD1 before applying ellipse fitting were 6.6, 3.2, and 7.4 for glaucoma, DR, and normal retinal images, respectively, while those for OD2 were 7.3, 3.4, and 8.6. We did not observe significant improvement in the overall results after applying ellipse fitting. Actually, ellipse fitting negatively affected the tracing done for some images especially for those traced by OD2. The overall performance in terms of cor-rectly detecting the disc border in all retinal conditions was low; indeed, in some cases, it was as low as zero. Images with DR had the highest level of precision while those with glaucoma had the lowest as can be observed from high average boundary distance. This is mainly related to the level of subjectivity when trying to distinguish the disc border from PPA.
Discussion
This study evaluated the level of agreement and precision for tracing the disc in fundus images. This involved the development of a customized web portal for disc annotation. We found that optometrist tracings showed high levels of agreement for identifying the disc region. However, there was poor agreement for correctly identifying the disc boundary. The application of ellipse fitting helped in adjusting for misalignment in some images.
Two optometrists OD1 and OD2 produced a set of disc and disc-boundary traces of fundus images. A glaucoma specialist went over the tracings and found that the two optometrists had a great variance in detecting the disc boundary and distinguishing it from PPA in the inferior and superior regions of the disc in various images. One of the reasons for this variance is that the disc border was not very clear in certain images, and hence the bend of blood vessels was used instead, which does not allow the actual disc border to be identified correctly in all cases. Another reason was the calibration challenge faced by optometrists when tracing the whole disc at once. Although an eraser was provided with which to remove incorrect tracing, this fea-ture did not prevent this issue from occurring. We used ellipse fitting to address misalign-ments in tracing, which helped to improve the levels of agreement and precision for some images. The low resolution and poor disc visibility in some of the images were additional rea-sons for the poor performance of the optometrists. In some of the images obtained from the ARIA dataset, the disc border was not very clear, and it was occasionally blurred by back-ground illumination. However, optometrists performed better in locating disc boundary in images from the ARIA dataset as compared with the Drishti dataset.
On average, OD1 took 80 seconds to completely trace the disc, which was longer than OD2’s 30 seconds. In general, OD1 performed better than OD2 in tracing the disc, which is reflected in a higher DC values and lower average boundary distance achieved than that of
OD2, particularly with regard to the disc border. Both optometrists achieved high kappa and DC in identifying disc regions, but this was not the case when locating the disc boundary espe-cially in the images from the glaucomatous dataset.
In general, the portal is a great tool for disc tracing instead of using a desktop application. Users can use any device with an internet browser that has access to the internet. Once access is established they can start tracing the images assigned to them and share their results. We also showed that applying ellipse fitting to tracings is not always helpful. The effectiveness of ellipse fitting is highly dependent on the misalignment of tracing caused by the user and in some cases the shape of the disc is not close to elliptic. One of the limitations of this study is that, for some of the images, the optometrists found it difficult to use the pencil and eraser, which led to more time being spent on specific images. Future work could be done using a cus-tomized object with a rotation feature, which can be used to compare participants’ results. Another limitation is that the system does not currently provide live feedback, which is a fea-ture that we intend to add. We would like to expand this system to include annotation of other retinal anatomical objects, such as the fovea and PPA. Additionally, we would like to develop a semi-supervised approached that could help in speeding up the tracing process. While the sys-tem has the potential to be applied in any field that involves tracing, our research mainly focuses on the field of ophthalmology, in particular glaucoma.
In this study, the levels of precision and agreement were very low when it comes to cor-rectly detect the disc border especially when working with glaucomatous retinal images. Hence, developing an automated approach that could assist in correctly detecting the disc border in a precise, consistent, and rapid fashion is very important in this field. Such an approach would have the potential to be helpful in detecting glaucomatous discs, influencing decisions concerning treatment, offering appropriate referrals, as well as in other areas. The developed portal in this study could serve as a model for generating sufficient ground truth to develop an automated system for identifying cup to disc ratio and helping to improve the identification of individuals who may have glaucoma, allowing for more timely referrals and management. We also demonstrated that there is a degree of subjectivity in tracing the disc. Using the average boundary distance evaluation approaches revealed information related to optometrists’ precision in disc boundary tracing that was not revealed when using DC. Using kappa and average boundary distance identified where disagreement is happening which we then investigated.
Author Contributions
Data curation: Abdullah Sarhan, Andrew Swift, Adam Gorner. Formal analysis: Abdullah Sarhan.
Funding acquisition: Abdullah Sarhan, Jon Rokne, Reda Alhajj, Andrew Crichton. Investigation: Abdullah Sarhan, Andrew Swift, Adam Gorner, Gavin Docherty, Andrew
Crichton.
Methodology: Abdullah Sarhan, Andrew Swift, Adam Gorner, Jon Rokne, Reda Alhajj,
Andrew Crichton.
Project administration: Abdullah Sarhan. Software: Abdullah Sarhan.
Supervision: Jon Rokne, Reda Alhajj. Validation: Abdullah Sarhan.
Visualization: Abdullah Sarhan.
Writing – original draft: Abdullah Sarhan, Andrew Swift, Adam Gorner, Jon Rokne, Reda
Alhajj, Gavin Docherty, Andrew Crichton.
Writing – review & editing: Abdullah Sarhan, Andrew Swift, Adam Gorner, Jon Rokne, Reda
Alhajj, Gavin Docherty, Andrew Crichton.
References
1. Bourne RR, Flaxman SR, Braithwaite T, Cicinelli MV, Das A, Jonas JB, et al. Magnitude, temporal trends, and projections of the global prevalence of blindness and distance and near vision impairment: a systematic review and meta-analysis. The Lancet Global Health. 2017; 5(9):e888–e897.https://doi. org/10.1016/S2214-109X(17)30293-0PMID:28779882
2. Fu H, Xu Y, Lin S, Zhang X, Wong DWK, Liu J, et al. Segmentation and quantification for angle-closure glaucoma assessment in anterior segment OCT. IEEE transactions on medical imaging. 2017; 36 (9):1930–1938.https://doi.org/10.1109/TMI.2017.2703147PMID:28499992
3. Tham YC, Li X, Wong TY, Quigley HA, Aung T, Cheng CY. Global prevalence of glaucoma and projec-tions of glaucoma burden through 2040: a systematic review and meta-analysis. Ophthalmology. 2014; 121(11):2081–2090.https://doi.org/10.1016/j.ophtha.2014.05.013
4. Mookiah MRK, Acharya UR, Lim CM, Petznick A, Suri JS. Data mining technique for automated diagno-sis of glaucoma using higher order spectra and wavelet energy features. Knowledge-Based Systems. 2012; 33:73–82.https://doi.org/10.1016/j.knosys.2012.02.010
5. Kumar BN, Chauhan R, Dahiya N. Detection of Glaucoma using image processing techniques: A review. In: 2016 International Conference on Microelectronics, Computing and Communications (Micro-Com). IEEE; 2016. p. 1–6.
6. Sarhan A, Rokne J, Alhajj R. Glaucoma detection using image processing techniques: A literature review. Computerized Medical Imaging and Graphics. 2019; p. 101657.
7. Thienes B. Canadian association of optometrists pre-budget submission. 2016;.
8. Park SH, Kressel HY. Connecting technological innovation in artificial intelligence to real-world medical practice through rigorous clinical validation: what peer-reviewed medical journals could do. Journal of Korean Medical Science. 2018; 33(22).https://doi.org/10.3346/jkms.2018.33.e152
9. Akram MU, Tariq A, Khalid S, Javed MY, Abbas S, Yasin UU. Glaucoma detection using novel optic disc localization, hybrid feature set and classification techniques. Australasian physical & engineering sciences in medicine. 2015; 38(4):643–655.https://doi.org/10.1007/s13246-015-0377-y
10. De La Fuente-Arriaga JA, Felipe-Rivero´n EM, Garduño-Caldero´n E. Application of vascular bundle dis-placement in the optic disc for glaucoma detection using fundus images. Computers in biology and med-icine. 2014; 47:27–35.https://doi.org/10.1016/j.compbiomed.2014.01.005
11. Panda R, Puhan N, Panda G. Robust and accurate optic disk localization using vessel symmetry line measure in fundus images. Biocybernetics and Biomedical Engineering. 2017; 37(3):466–476.https:// doi.org/10.1016/j.bbe.2017.05.008
12. Cheplygina V, de Bruijne M, Pluim JP. Not-so-supervised: a survey of semi-supervised, multi-instance, and transfer learning in medical image analysis. Medical image analysis. 2019; 54:280–296.https://doi. org/10.1016/j.media.2019.03.009
13. Litjens G, Kooi T, Bejnordi BE, Setio AAA, Ciompi F, Ghafoorian M, et al. A survey on deep learning in medical image analysis. Medical image analysis. 2017; 42:60–88.https://doi.org/10.1016/j.media.2017. 07.005PMID:28778026
14. Howe J. The rise of crowdsourcing. Wired magazine. 2006; 14(6):1–4.
15. Mitry D, Peto T, Hayat S, Blows P, Morgan J, Khaw KT, et al. Crowdsourcing as a screening tool to detect clinical features of glaucomatous optic neuropathy from digital photography. PloS one. 2015; 10 (2).https://doi.org/10.1371/journal.pone.0117401PMID:25692287
16. Amazon Mechanical Turk;.https://www.mturk.com/.
17. Mitry D, Zutis K, Dhillon B, Peto T, Hayat S, Khaw KT, et al. The accuracy and reliability of crowdsource annotations of digital retinal images. Translational vision science & technology. 2016; 5(5):6–6.https:// doi.org/10.1167/tvst.5.5.6PMID:27668130
18. Son J, Kim S, Park SJ, Jung KH. An Efficient and Comprehensive Labeling Tool for Large-Scale Anno-tation of Fundus Images. In: Intravascular Imaging and Computer Assisted Stenting and Large-Scale Annotation of Biomedical Data and Expert Label Synthesis. Springer; 2018. p. 95–104.
19. Vianna JR, Malik R, Danthurebandara VM, Sharpe GP, Belliveau AC, Shuba LM, et al. Beta and gamma peripapillary atrophy in myopic eyes with and without glaucoma. Investigative ophthalmology & visual science. 2016; 57(7):3103–3111.https://doi.org/10.1167/iovs.16-19646
20. Park SJ, Shin JY, Kim S, Son J, Jung KH, Park KH. A novel fundus image reading tool for efficient gen-eration of a multi-dimensional categorical image database for machine learning algorithm training. Jour-nal of Korean medical science. 2018; 33(43).https://doi.org/10.3346/jkms.2018.33.e239PMID: 30344460
21. Sivaswamy J, Krishnadas S, Joshi GD, Jain M, Tabish AUS. Drishti-gs: Retinal image dataset for optic nerve head (onh) segmentation. In: 2014 IEEE 11th international symposium on biomedical imaging (ISBI). IEEE; 2014. p. 53–56.
22. Bankhead P, Scholfield CN, McGeown JG, Curtis TM. Fast retinal vessel detection and measurement using wavelets and edge location refinement. PloS one. 2012; 7(3).https://doi.org/10.1371/journal. pone.0032435PMID:22427837
23. Tracing Done By Optometrists;.https://data.mendeley.com/datasets/7xv5rzxgrh/1.
24. Fleiss JL, Cohen J, Everitt BS. Large sample standard errors of kappa and weighted kappa. Psychologi-cal bulletin. 1969; 72(5):323.https://doi.org/10.1037/h0028106
25. Viera AJ, Garrett JM, et al. Understanding interobserver agreement: the kappa statistic. Fam med. 2005; 37(5):360–363. PMID:15883903
26. Joshi GD, Sivaswamy J, Krishnadas S. Optic disk and cup segmentation from monocular color retinal images for glaucoma assessment. IEEE transactions on medical imaging. 2011; 30(6):1192–1205. https://doi.org/10.1109/TMI.2011.2106509
27. Halır R, Flusser J. Numerically stable direct least squares fitting of ellipses. In: Proc. 6th International Conference in Central Europe on Computer Graphics and Visualization. WSCG. vol. 98. Citeseer; 1998. p. 125–132.