! ! !
KADIR HAS UNIVERSITY
GRADUATE SCHOOL OF SCIENCE AND ENGINEERING
CLASSIFICATION OF DISTINCT CONFORMERS OF BETA-2
ADRENERGIC RECEPTOR BASED ON BINDING AFFINITY OF
LIGANDS THROUGH DOCKING STUDIES
GRADUATE THESIS
GONCA DİLCAN
May, 2017! !
! ! ! ! !! Go nc a Di lc an M. S. T he sis 2017
CLASSIFICATION OF DISTINCT CONFORMERS OF BETA-2
ADRENERGIC RECEPTOR BASED ON BINDING AFFINITY OF
LIGANDS THROUGH DOCKING STUDIES
GONCA DİLCAN
Submitted to the Graduate School of Science and Engineering in partial fulfillment of the requirements for the degree of
Master of Science in
COMPUTATIONAL BIOLOGY AND BIOINFORMATICS
KADIR HAS UNIVERSITY May, 2017
i
CLASSIFICATION OF DISTINCT CONFORMERS OF BETA-2 ADRENERGIC RECEPTOR BASED ON BINDING AFFINITY OF LIGANDS THROUGH
DOCKING STUDIES Abstract
β2AR is an important drug target and plays a critical role in the relaxation of pulmonary tissues and cardiovascular physiology. We have developed a strategy for classifying various β2AR conformers as active or inactive states, based on binding mode of selected ligands with known activities. Previously, distinct conformational states of the ligand’s binding pocket were obtained from a 2.8 µs MD simulation. Snapshots were clustered based on RMSD value of five key residues at the binding site. Clustering analysis yielded a total of 13 distinct conformers to which five agonists, four inverse agonists, and four antagonists were docked separately, using seven different scoring functions. Best ligand poses with the highest score value were selected and evaluated based on their vicinity to five key residues. Poses that were not in this neighborhood were discarded and remaining ones were sorted based on their score. Before treating MD conformers, this classification scheme was applied first to both active/inactive state crystal structures for critical assessment. MD conformers found in top five in all scoring functions were selected and assigned to be either active or inactive. Finally, selected MD conformers were used to screen a small database to further investigate their discriminatory power. As a result, MD conformers performed more selective screening than inactive state crystal structure for antagonists/inverse agonists. Generating alternative conformations of the receptor and classifying them as active or inactive is an important practice in the drug design studies that were often limited to one snapshot obtained from X-ray studies.
ii
BETA-2 ADRENERJİK RESEPTÖRÜNÜN FARKLI
KONFORMASYONLARININ DOCKİNG ÇALIŞMALARI İLE TEŞHİS EDİLMESİ
Özet
β2AR reseptörü, akciğerlerin rahatlamasında ve kardiyovasküler fizyolojide rol oynamasıyla önemli bir ilaç hedefidir. Bu çalışmada, çeşitli β2AR konformasyonlarını aktif veya inaktif olarak sınıflandırmak amacıyla, aktivitesi bilinen ligantlar seçilerek onların bağlanma şekillerine göre bir sınıflandırma stratejisi oluşturulmuştur. Önceki bir çalışmada gerçekleştirilen, reseptörün inaktif halinin 2.8 µs’lik MD simülasyonunda, ligandın bağlanma bölgesinin farklı konformasyonları elde edilmiştir. Snapshotlar derlenerek bağlanma bölgesindeki beş anahtar rezidünün RMSD değerlerine göre gruplandırılmıştır. Toplamda 13 farklı konformasyon elde edilmiş ve 5 agonist, 4 ters agonist ve 4 antagonist molekülü her bir konformasyona ayrı ayrı ve 7 farklı skor fonksiyonu kullanılarak dock edilmiştir. En iyi yerleşen konformasyonlar bağlanma bölgesindeki anahtar rezidülerle olan yakınlığına göre seçilmiş ve hesaplanmıştır. Anahtar bölgeye yaklaşamayanlar elenmiş, kalanlar ise skor değerlerine göre sıralanmıştır. Bu sınıflandırma, kritik değerlendirme yapabilmek için MD konformasyonlarından önce aktivitesi bilinen aktif/inaktif kristal yapılara uygulanmıştır. Her skor fonksiyonu tarafından seçilen ve ilk 5’te bulunan MD konformasyonları aktif ve inaktif olarak sınıflandırılmıştır. Son olarak, MD konformasyonlarının ayırt ediciliğini analiz edebilmek için, seçilen bu konformasyonlar ile küçük bir dataset kullanılarak sanal tarama yapılmıştır. MD konformasyonlarının inaktif kristal yapıya göre antagonist/ters agonistler için daha seçici olduğu gözlemlenmiştir. Reseptörün alternatif konformasyonlarını üretmek ve onları sınıflandırmak, genellikle tek bir snaphot X-ray örneği ile sınırlandırılmış ilaç tasarımı çalışmalarında önemli rol oynamaktadır.
iii
Acknowledgements
I would like to present my intimate thanks to my thesis advisor Assoc. Prof. Demet Akten who helped me throughout this work in all possible ways. I am very greatful to have the opportunity to work with her, it was intellectually rewarding and fulfilling.
I also want to mention my gratitude for graduate scholarship ensured by TÜBİTAK for my M.S. studies via the project number 213M544.
I would like to thank to my family for their trust in me and support all the time. Lastly, I want to thank to my friends Yiğit Durdağ, Teodora Djikic, Erdi Durmuş, Abdullahi İbrahim Uba and Deniz Hız for their support and believing in my work throughout my thesis. This thesis is dedicated to them.
iv
Table of Contents
Abstract i Özet ii Acknowledgements iii List of Tables vi List of Figures viiList of Abbreviations x
1 Introduction 1
2 Human Beta-2-Adrenergic Receptor: Structure, Function and Dynamics 4
2.1 G-Protein Coupled Receptors……….. 4
2.2 X-ray Crystal Structures of β2AR...………. 7
2.3 Interactions and Signaling Pathways in β2AR……… 8
2.4 Structural Dynamics of β2AR………. 13
3 Materials and Methods 17
3.1 Generation of the Target Conformers………. 17
3.2 Scoring Functions and Docking Studies..………... 21
3.2.1 AutoDock………...……… 22
3.2.2 GOLD………..……….. 24
3.2.3 DSX………... 26
3.2.4 GLIDE………... 27
3.3 Docking-Based Virtual Screening……….. 28
3.4 Receiver Operating Characteristic (ROC) Curves………. 29
4 Results and Discussion 32
4.1 Key Residues at the Ligand-Binding Site…...……… 32
4.2 Evaluation of the Classification Protocol……… 35
4.3 Docking Experiments of MD Conformers………. 40
v
4.3.2 Alprenolol Binding………. 51
4.3.3 Carazolol Binding………... 52
4.4 Virtual Screening Experiments…...………....55
5 Conclusions 62
References 65
Appendix A Representation of 57 compounds that used for virtual screening 70
Appendix B Distance values of 13 MD conformers 79
Appendix C Binding results of the crystal structures 80
Appendix D Interactions table of ligands 84
Appendix E Binding results of the ligands with their score values 86
vi
List of Tables
Table 4.1 Binding results of inverse agonist carazolol with crystal
structures ... 39
Table 4.2 Binding results of the eight ligands with crystal structures ... 40
Table 4.3 Docking results of the crystal structures with all the ligands 42 Table 4.4 Docking results of the crystal structures ... 43
Table 4.5 Docking results of MD conformers with agonists ... 44
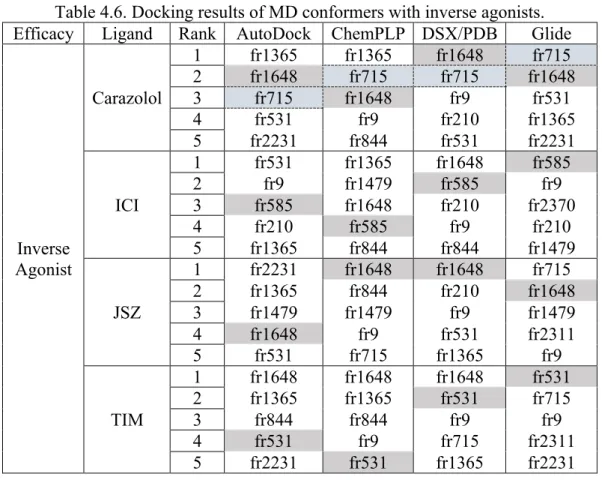
Table 4.6 Docking results of MD conformers with inverse agonists ... 45
Table 4.7 Docking results of MD conformers with antagonists ... 45
Table 4.8 Docking summary of the 9 successful MD conformers ... 46
vii
List of Figures
Figure 2.1 Schematic representation of GPCRs ... 5
Figure 2.2 Transmembrane domains of GPCRs ... 6
Figure 2.3 β2AR activation/inactivation cycle ... 11
Figure 2.4 Two different signaling pathways of GPCRs ... 13
Figure 3.1 Five key residues at the binding site and 13 different MD snapshots ... 18
Figure 3.2 Cluster profile of 2800 ns MD trajectory ... 19
Figure 3.3 13 MD snapshots ... 20
Figure 3.4 ROC curve model ... 31
Figure 4.1. The key residues at the ligand-binding site and the distance restraints between these seven residues ... 33
Figure 4.2. The distance plot of the MD conformers between key residues at the ligand binding site ... 34
viii
Figure 4.3. X-ray snapshots of inactive/active states aligned and seven
transmembrane helices ... 36
Figure 4.4. Molecular schemes of the ligand molecules that are known and used in crystal structures. ... 37
Figure 4.5. The binding protocol used for classification ... 38
Figure 4.6. Ligand interactions at the binding site.. ... 38
Figure 4.7. Molecular schemes of the additional ligands with known activities ... 41
Figure 4.8 Ligand interactions of frame1648 ... 47-48 Figure 4.9. Extracellular view of active crystal structure 3SN6 and frame210. ... 51
Figure 4.10. Extracellular view of inactive crystal structure 3NYA, frame585 and frame1648 ... 53
Figure 4.11. Extracellular view of inactive crystal structure 2RH1, frames 715 and 1648 ... 54
Figure 4.12. ROC curves of the inactive structure PDB id: 2RH1 ... 56
Figure 4.13. ROC curves of the active structure PDB id: 4QKX ... 56
ix
Figure 4.15. ROC curves of frame1618 ... 58
Figure 4.16. ROC curves of frame210 and frame1365 ... 59
Figure 4.17. ROC curves for all frames and crystals that have been used. ... 61
x
List of Abbreviations
Å Angstrom Asn Asparagine Asp Aspartic Acid AUC Area Under Curve
β2AR Human Beta-2 Adrenergic Receptor Gs Alpha Subunit of G-protein
GPCR G-protein Coupled Receptor ICL3 Intracellular Loop 3
MD Molecular Dynamics
NMR Nuclear Magnetic Resonance PDB Protein Data Bank
RMSD Root Mean Square Deviation Ser Serine
TM Transmembrane
1
Chapter 1
Introduction
G protein-coupled receptors (GPCRs) are the largest family of eukaryotic membrane proteins. They are also known as seven transmembrane domain receptors (7TM), and involved in signal transduction across membranes in many different physiological pathways. GPCRs control many cellular responses to hormones, neurotransmitters, peptides, ions, photons, proteins and small molecules. Many diseases are related to the functioning of GPCRs and making them important targets for drug design. Today, more than 50% of the marketed drugs act on these receptors. Human β2– adrenergic receptors (β2AR) belong to the class A GPCRs responding to hormones adrenaline and noradrenaline and are the targets of current asthma and cardiac drugs which comprise the mainstream of research (Rosenbaum, Rasmussen and Kobilka, 2009; Li and III, 2010).
In 2007, after the discovery of the first explained X-ray crystal structures of human β2AR in the inactive states by Rasmussen and his coworkers, one with the anchor protein T4-lysozyme and inverse agonist carazolol (PDB id: 2RH1; Cherezov et al., 2007) and two with the Fab5 complex (PDB ids: 2R4R, 2R4S, Rasmussen et al., 2007), a new gate has opened for drug design studies. In the following years, the active states of the receptor were also revealed with X-ray crystallography studies,
2
however, the conformational transition between active and inactive states is still not fully understood (Dror et al., 2011).
In order to understand the effect of intracellular loop 3 (ICL3) on the intrinsic dynamics of the receptor, Ozcan et al. performed MD simulations using the inactive crystal structure of human β2AR which was found in complex with the inverse agonist carazolol and T4-lysozyme (PDB id: 2RH1) as the initial conformation. Carazolol and T4-lysozyme were removed prior to the MD simulations and two different models called loop and clipped were performed. In the loop model, the missing ICL3 region was added, while in the clipped model the transmembrane helices 5 (H5) and 6 (H6) were covalently bonded to each other. Both models were subjected to 1 µs MD simulation, as a result, the loop model was found in a very inactive conformation after around 600 ns which is characterized by a further movement of the H6 towards to receptor’s core region, and a close packing of ICL3 underneath the membrane blocking the G-protein binding site. The Ser207-Asp113 distance at the binding pocket was found to increase from 11 Å to 18 Å showing that there is a strong coupling between the extracellular and intracellular regions of the receptor (Ozcan et al., 2013).
In this thesis, a total of 13 distinct conformations of β2AR that has been obtained from the loop model of Ozcan et al.’s work after clustering the MD trajectory based on RMSD value of the binding site region, were used for a series of molecular docking experiments to bring out the distinctiveness of each conformer interacting
3
with different ligands with various efficacies (Ozcan et al., 2013). In addition, the presence of ICL3 region in all these conformers provides a more realistic model, which takes into account the allosteric effect between intracellular (G-protein binding site and ICL3) and extracellular (ligand-binding site) region for the first time. Using a classification protocol developed in this study, these conformations were classified as active or inactive states, which were then used in virtual screening experiments and were found to be more selective over antagonists/inverse agonists than any known inactive state crystal structures.
4
Chapter 2
Human Beta-2 Adrenergic Receptor (β
2AR): Structure, Function
and Dynamics
2.1. G-Protein Coupled Receptors
Human β2AR is a member of the G protein coupled receptors (GPCRs) superfamily which has a critical role in cell and tissue communication. All GPCRs have seven membrane-spanning helices, thus they are known as seven transmembrane (7TM) receptors (Nygaard et al., 2009). These helices are separated by three extracellular loops and three intracellular loops as shown in Figure 2.1 (Johnson, 2006). Composed of 400 to 500 amino acids, GPCRs initiate the signaling pathway through binding of extracellular ligands such as neurotransmitters, hormones, or peptides, which trigger specific conformational changes in the ligand-binding site. Most physiological processes such as olfaction, taste, smell, vision, cardiovascular and pulmonary functions mostly depend on GPCRs (Latek et al., 2012).
5 (b)
Figure 2.1. Schematic representation of GPCRs. (a) The seven-transmembrane α-helix structure of a G protein–coupled receptor (b) 2D representation of β2AR
embedded in the membrane (Wikipedia, 2016; Rasmussen et al., 2007). GPCR members share more than 20% sequence identity and have been classified into five families according to their conserved sequence regions and their structure. These families are rhodopsin (family A), secretin (family B), glutamate (family C), adhesion and Frizzled/Taste2 (family O). Family A receptors, which are the most studied one, are also divided into subgroups called opsin, amine, peptide, cannabinoid and olfactory receptors. Furthermore, according to localization and ligand specificity, the amine subgroup diverges into subfamilies as α and β. β2 -adrenergic receptor (β2AR) is the member of rhodopsin-like A family, amine group β subfamily (Vauquelin, 2007; Rosenbaum et al., 2009).
6
The overall sequence identity within the members of class A is low and limited to a few highly conserved key residues as highlighted in Figure 2.2.
(a)
(b)
Figure 2.2. Transmembrane domains of GPCRs. (a) Superimposition of the TM domains. TM1 (white), TM2 (yellow), TM3 (red), TM4 (grey), TM5 (green), TM6
(dark blue), and TM7 (light blue). The highly conserved N1.50 (white), D2.50 (yellow), R3.50 (red), W4.50 (grey), P5.50 (green), P6.50 (dark blue), and P7.50
(light blue) are shown as spheres. (b) Sequence alignments of TMs. Structure conservation of GPCR family is associated with the highly conserved amino acid in
each helix (shown in red) (Filizola, 2014).
18 A. Gonzalez et al.
Fig. 2.1 Comparison of the TM bundle of GPCRs. The structures of
bRho (PDB code 1U19), “2R (2RH1), D3R (3PBL), H1R (3RZE), M2R, 5HT1bR (4IAR), A2AR (4EIY), CXCR4 (3ODU), !OR (4DKL), NTSR1 (4GRV), PAR1 (3VW7), and S1P1R (3V2Y) are
shown. The colour code of the helices is TMs 1 in
white, 2 in yellow, 3 in red, 4 in grey, 5 in green, 6 in
dark blue, and 7 in light
blue. The highly conserved N1.50 (in white), D2.50 (in
yellow), R3.50 (in red), W4.50 (in grey), P5.50 (in
green), P6.50 (in dark
blue), and P7.50 (in light
blue) are shown as spheres
Fig. 2.2 Sequence alignments of TMs 1–7 of GPCRs with known structures. The highly conserved amino acids in
each helix, used as reference points in TM sequence alignments are boxed in red
among different receptor subfamilies within the extracellular side, near the binding site crevices, responsible for recognition and selectivity of diverse ligands.
Moreover, comparison among the crystal structures of GPCRs revealed backbone anomalies, in the form of kinks and bulges, in the majority of TM helices. These non-canonical elements are frequent in TM proteins,
modulating the polytopic membrane protein architecture (Riek et al.2001). Deviations from the regular ’-helical context have been associated to prolines (Von Heijne1991), glycines (Senes et al.2000), serines and threonines (Deupi et al. 2004,2010), or to the insertion or deletions (indels) of residues within the TMs (Deville et al. 2009). Moreover, specific intra- and interhelical interactions involving polar side
18 A. Gonzalez et al.
Fig. 2.1 Comparison of the TM bundle of GPCRs. The structures of
bRho (PDB code 1U19), “2R (2RH1), D3R (3PBL), H1R (3RZE), M2R, 5HT1bR (4IAR), A2AR (4EIY), CXCR4 (3ODU), !OR (4DKL), NTSR1 (4GRV), PAR1 (3VW7), and S1P1R (3V2Y) are shown. The colour code of the helices is TMs 1 in white, 2 in yellow, 3 in red, 4 in grey, 5 in green, 6 in dark blue, and 7 in light blue. The highly conserved N1.50 (in white), D2.50 (in yellow), R3.50 (in red), W4.50 (in grey), P5.50 (in green), P6.50 (in dark blue), and P7.50 (in light blue) are shown as spheres
Fig. 2.2 Sequence alignments of TMs 1–7 of GPCRs with known structures. The highly conserved amino acids in
each helix, used as reference points in TM sequence alignments are boxed in red
among different receptor subfamilies within the extracellular side, near the binding site crevices, responsible for recognition and selectivity of diverse ligands.
Moreover, comparison among the crystal structures of GPCRs revealed backbone anomalies, in the form of kinks and bulges, in the majority of TM helices. These non-canonical elements are frequent in TM proteins,
modulating the polytopic membrane protein architecture (Riek et al.2001). Deviations from the regular ’-helical context have been associated to prolines (Von Heijne 1991), glycines (Senes et al.2000), serines and threonines (Deupi et al.
2004, 2010), or to the insertion or deletions (indels) of residues within the TMs (Deville et al. 2009). Moreover, specific intra- and interhelical interactions involving polar side
7 2.2. X-ray Crystal Structures of β2AR
Previous studies on GPCRs were based on a low-resolution model of bovine rhodopsin, which was expected to share a conserved structure with other GPCRs (Unger and Schertler, 1995). Later in 2000, the first crystal structure of rhodopsin was visualized by Palczewski et al. in complex with 11-cis-retinal, representing an inactive conformation (Palczewski et al., 2000). This structure has been extensively used as a template for homology modeling for other GPCRs such as β2AR (Ballesteros, Shi and Javitch, 2001; Stenkamp et al., 2002; Montero et al., 2005).
Afterwards in 2007, the first X-ray crystal structure of the inactive form of human β2AR GPCR bound to inverse agonist carazolol was revealed; one bound to a monoclonal antibody (Fab5) (PDB ids: 2R4R, 2R4S, Rasmussen et al., 2007) and one with the anchor protein T4 lysozyme (PDB id: 2RH1; Cherezov et al., 2007). Since β2AR has a flexible and unstable structure, Fab5 and T4 lysozyme molecules have been used to help for crystallization in order to provide conformational stability (Cherezov et al., 2007; Rasmussen et al., 2007). Cherezov et al. identified that the poorly structured intracellular loop 3 (ICL3) was obstructive for crystallization, thus, T4-lysozyme (T4L) has been inserted in place of ICL3.
After the identification of the first crystal structures, other inactive conformations of β2-AR have been reported in complex with a partial inverse agonist timolol (Hanson et al., 2008) and antagonist alprenolol (Wacker et al., 2010). While the hydrogen
8
bonding with Ser203, Ser204, Ser207, Asp113, Asn312 and Tyr316 was conserved for carazolol, timolol and alprenolol, additional hydrogen bonds and hydrophobic interactions were observed for each ligand with different binding affinities. Although these specific interactions define the pharmacological response, they have a minor impact on the overall structure of the receptor (Dror et al., 2011).
In 2011, Rasmussen and his coworkers have determined two active structures of β2AR bound to full agonist BI-167107 in complex with a nanobody (Søren G F Rasmussen et al., 2011) and Gs-protein (Soren G F Rasmussen et al., 2011). Comparison of the active and inactive states has revealed minor differences on the ligand binding site region of the receptor. The key change was the interaction with Ser203, Ser204 and Ser207 residues on TM5. The hydrogen bond between the ligand and serines causes an inward movement of TM5 followed by an outward swing of the lower half of TM6. This outward displacement of TM6 upon activation is the largest change observed in β2AR and is around 11 Å in nanobody bound structure and 14 Å in Gs-protein bound structure (Rasmussen et al., 2011; Chung et al., 2012; Liapakis et al. 2000).
2.3. Interactions and Signaling Pathways in β2AR
β2AR has a rich variety of ligands classified according to their effect on basal activity; full agonists maximize the activity by promoting the binding of G-proteins, inverse agonists suppress the basal activity by closing the G-protein binding cavity,
9
partial agonists cause partial activation and neutral antagonists do not affect the activity while blocking the binding site for other ligands (Rosenbaum et al., 2009).
When it is not stimulated, the receptor tends to stay in an inactive state. Binding of an agonist lowers the energy barrier between the inactive and active states and enables the interaction with G-protein. Heterotrimeric G-protein binding enables the signaling from extracellular ligand-binding site to intracellular region by changing the receptor conformation from inactive to active state. Studies have shown that the presence of an agonist molecule is not sufficient by itself to shift the equilibrium from an inactive to an active state in the absence of a G-protein (Galandrin and Bouvier, 2006; Dror et al., 2011).
The active receptor conformation is defined by limited access to ligand binding site. DeVree et al. have provided functional evidence that nucleotide free G-protein coupling of β2AR stabilizes closed receptor conformation by inducing the transition of ligands to the orthosteric binding site. G-protein activation blockades the association with other ligands while hindering the dissociation of the bound ligand. On the other hand, agonist or hormone binding enhances G-protein coupling via active formation of the receptor and loss of nucleotide from G-protein (DeVree et al., 2016).
In order to understand the effect of different ligand types on the dynamics of β2AR and Gs protein, Bai et al. performed 800 ns long MD simulations β2AR-Gs protein
10
complex bound to agonist (BI-167107), antagonist (alprenolol), inverse agonist (ICI 118,551) and their unliganded form. The results showed that binding of different types of ligands to β2AR has different effect on the behavior of Gα and Gβγ domain. The inverse agonist ICI 118,551 has triggered the dissociation of Gα and Gβγ domain by changing the conformation of the receptor. On the other hand, Gα and Gβγ domain kept the stable distance if agonist, antagonist or no ligand was bound to β2AR. Also, each ligand had different hydrogen bonding with the receptor; the inverse agonist ICI 118,551 formed hydrogen bonds with Asp113 and Asn312, while the antagonist alprenolol had similar hydrogen bonding except lower bonding with Tyr308. The agonist BI-167107 had hydrogen bonds with Ser203, Ser207 and Asn293 besides Asp113 and Asn312. These different binding modes effect the conformation of the receptor by effecting the binding pocket’s volume (Bai et al., 2013).
G-proteins function as a switch inside the cell and belong to GTPase family of enzymes. Heterotrimeric G-proteins consist of three subunits, alpha (α), beta (β) and gamma (γ). β2AR activates itself by binding of an agonist molecule from the extracellular region that enables the interaction with the G-protein heterotrimer. Following this interaction, guanosine diphosphate (GDP) leaves the Gα subunit while guanosine triphosphate (GTP) enters the same pocket and activates Gα protein. The binding of GTP to the subunit causes dissociation of the complex, releasing Gα and Gβγ from the receptor. The activated Gα subunit binds to and activates adenylyl cyclase enzyme, which in turn catalyzes the conversion of ATP into cyclic adenosine
11
monophosphate (cAMP). The Gβγ subunits can regulate different types of effector proteins like Ca2+ channels, kinases and other enzymes. Hydrolysis of GTP to GDP in α subunit causes reassembling of heterotrimeric G-protein and inactivation of Gα protein (Figure 2.3) (Soren G F Rasmussen et al., 2011).
Figure 2.3. β2AR activation/inactivation cycle.
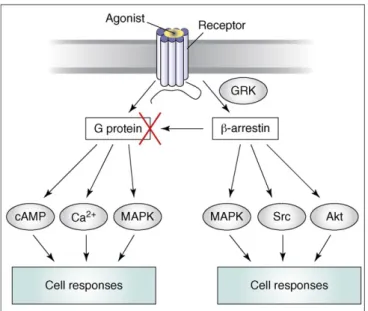
Another major signaling pathway of β2AR is through beta-arrestins. The activated receptors are also substrates for G-protein coupled receptor kinases (GRKs). Phosphorylation of the GRKs, trigger the binding of beta-arrestins to the receptor. Beta-arrestins can limit the G-protein signaling and trigger a parallel set of signals. Inverse agonists for G-protein pathway, such as ICI 118;551 and propranolol, have shown positive agonist activity for beta-arrestin GRK. This indicates G-protein and beta-arrestin efficacies can differ and beta-arrestins can be completely independent from G-protein signaling pathway (Figure 2.4) (Violin and Lefkowitz, 2007; Kenakin, 2007).
12
The coupling of the receptor with beta-arrestins and G-proteins trigger selective modulation of the downstream effects. Biased ligands selectively choose to couple either beta-arrestins or G-proteins. This indicates a difference in the receptor core that allows coupling with only one of these effectors and prevent coupling with the other effector (Shukla, Singh and Ghosh, 2014). 19F-labeled NMR spectroscopy studies of β2AR with biased ligands have shown unique conformational changes and different signaling in G-protein and beta-arrestin pathways. Binding of full agonists induced a conformational change on TM6 and TM7 whereas beta-arrestin biased ligands such as carvedilol and isoetharine had shown to have a strong impact on shifting the conformational equilibrium of TM7 towards the active state. While the conformational changes in TM7 did not directly effect the G-protein binding and signaling, it has a crucial role in the beta-arrestin signaling pathway (Liu et al., 2012).
Another conserved interactions in β2AR are the ionic lock and the rotamer toggle switches. These switches stabilize the movements of helices and thereby help the intracellular part of the receptor to be accessible for G-protein binding, in other words to turn the receptor into an active state. Rather than two state on and off switches, they are able to maintain the continuity of conformations (Rosenbaum et al., 2009). The ionic lock is the salt bridge between Asp130/Arg131 pair on TM3 and Glu268 residues on TM6, whereas the rotamer switch is the bending of TM6 resulting from the interactions between aromatic ring of the ligand and aromatic residues Trp286 and Phe290. The activation of receptor through micro-switches
13
varies from different ligands to different GPCRs (Kobilka and Deupi, 2007; Katritch, Cherezov and Stevens, 2013). Studies have shown that catechol binding activates the toggle switch whereas ionic lock is not activated. Also, salbutamol binding activates ionic lock but does not activate toggle switch, suggesting that these micro-switches are not coupled (Kobilka, 2007).
Figure 2.4. Two different signaling pathways of GPCRs. While G-proteins trigger second messengers such as calcium, cyclic adenosine monophosphate (cAMP) and mitogen activated kinases (MAPK); beta-arrestins which phosphorylated by GRKs terminate G-protein signaling pathway. Beta-arrestins also trigger another signaling
such as activation of Src, Akt and MAPK. These signaling pathways can stimulate by classical agonists and each of them couples with different signaling pathway
(Violin and Lefkowitz, 2007).
2.4. Structural Dynamics of β2AR
The structural dynamics of active to inactive transitions of GPCRs is still not fully understood. While agonists shift the existing equilibrium to more active states, the dynamic equilibrium of the receptors remains heterogeneous and even in the high concentrations of agonists, receptor can still adopt an inactive state. On application
14
of muscarinic M2 receptor all-atom MD simulations, Bock et al. suggested that an ensemble of active and inactive agonist-receptor complexes in which agonists adopt multiple binding modes indicates different agonist efficacies and that agonists can stabilize inactive agonist-receptor complexes (Bock et al., 2016).
Since the binding site of the receptor is located away from G-protein binding site, key residues in the TM domain mediate the allosteric communication between extracellular and intracellular regions. Although the sequence similarity is low among GPCRs, high structural similarity results to a common mode of activation. Bhattacharya et al. suggested that similar residues were involved in the activation mode of class A GPCRs and their MD simulation studies have shown that allosteric communication pipelines were conserved among the six biogenic amine receptors. Also, among the receptors studied, β2AR showed the highest level of fluctuation in TM6 and TM7 due to its basal activity (Bhattacharya et al., 2016).
To investigate how agonists with different efficacies modulate β2AR’s active and inactive conformations, Staus et al. have used positive allosteric nanobody Nb80 stabilizing the active state and a negative allosteric nanobody Nb60 stabilizing the inactive state of the receptor. They found out that in the presence of Nb80 the agonist isoprenaline has 15,000-fold higher affinity to β2AR than in the presence of Nb60. Also Nb60-bound β2AR has affinity approximately! 100-fold lower than the previously described low-affinity inactive state. In other words, there exist an average of multiple, rapidly interconverting inactive and active states. 17 ligands
15
with varying efficacy to β2AR have been used in the absence and presence of Nb80 and Nb60 and showed a wide range of efficacies (downstream response) indicating that the receptor has at least three different equilibrium states (Staus et al., 2016). Another MD simulation performed by Shan et al. have showed that binding of full agonist, partial agonist and inverse agonist induces distinct conformational changes and different responses (Shan et al., 2012).
The structural dynamics of β2AR has been studied by Manglik et al. and showed that unliganded and inverse-agonist-bound β2AR conformations exist predominantly as two distinct inactive states that can be exchanged within hundreds of microseconds. On the other hand, agonists shift the equilibrium toward a conformation capable of engaging cytoplasmic G proteins and this results in increased conformational heterogeneity and the coexistence of inactive, intermediate, and active states. This findings indicates a loose allosteric coupling between the binding pocket and G-protein binding site that might be responsible for the complex signaling behavior observed for GPCRs (Manglik et al., 2015).
To investigate GPCRs activation mechanism, Dror et al. performed MD simulation of β2AR that deactivates itself upon the removal of G-protein or its mimetic nanobody. This shows that the agonist is not sufficient enough to keep the receptor in the active state, further indicating the loose coupling between ligand binding site and G protein binding site. Simulations also revealed that receptor adopts an intermediate conformation during the deactivation process (Dror et al., 2011).
16
Kohlhoff et al.’s MD simulation studies revealed that β2AR has multiple activation pathways and that agonists and inverse agonists interact distinctively with these pathways, which can be an important finding for drug design. Results have shown that binding of agonist molecule BI-167107 stabilizes the active-like conformations by strengthening the extra and intracellular interactions; while the inverse agonist carazolol and apo simulations do not show active state conformations and deactivating the receptor rapidly. The apo receptor simulation showed uncoupled interactions while carazolol disconnects the coupling between the extra and intracellular regions indicating that ligands trigger the receptor dynamics through different signaling pathways (Kohlhoff et al., 2014).
17
Chapter 3
Methods and Materials
3.1. Generation of the Target Conformers
In this study, the trajectory of 2.8 µs long MD simulation of β2AR conducted by Ozcan et al. was used for determining the target conformations. In Ozcan’s work, MD simulations were performed using the inactive crystal structure of the receptor obtained from the complex with partial inverse agonist carazolol and the anchor protein T4 lyzozyme (PDB id: 2RH1) as the initial conformation. After removal of carazolol and T4L, the ICL3 region has been modeled between residues 230 and 266 in place of T4L. A total of 2800 snapshots were collected from MD simulations at every 1 ns and clustered based on their RMSD value of five key residues shown in Figure 3.1a (Asp113, Val117, Ser203, Ser207 and Asn312) at the binding site using kClust algorithm (Wolf and Kirschner, 2013). Clustering goes through each snapshot of the MD trajectory and repeatedly places each conformation to a cluster based on its RMSD value with respect to that cluster’s centroid (average structure) and updates the centroid for that cluster. After all frames were assigned to a cluster, the conformation that is closest to the centroid is selected as the representative snapshot for that cluster. The clustering analysis in Ozcan’s work yielded a total of 13 distinct conformers for an RMSD cut-off value 1.5 Å Figure 3.2 (Ozcan et al., 2013).
18
(a)
(b)
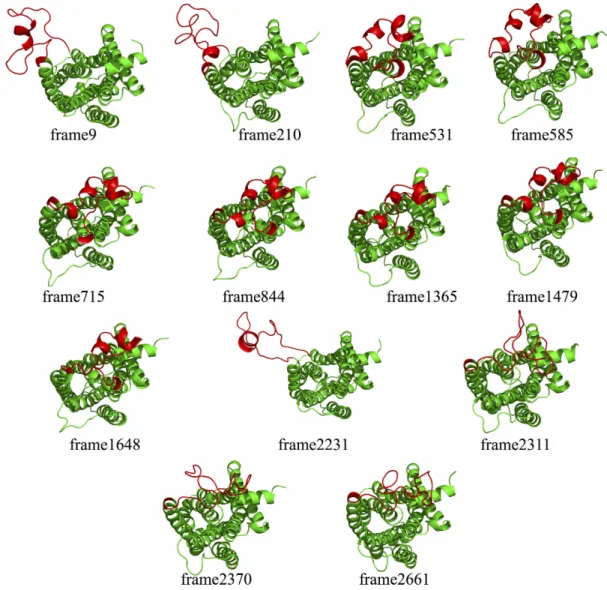
Figure 3.1. Five key residues at the binding site (a) and 13 different MD snapshots (frame9, frame210, frame531, frame585, frame715, frame844, frame1365, frame1479, frame1648, frame2311, frame2231, frame2661 and frame2370) aligned
to each other based on transmembrane region (b). Blue spheres represent the key residues at ligand-binding site (Serines, Asn312 and Asp113).
19
Figure 3.2. Cluster profile of 2800 ns MD trajectory (1): 0-999: Original 1 µs MD run, (2): 1000-1499: 1st continued MD run (same initial velocity), (3):1500-1999: 2nd continued MD run (different initial velocity), (4-5–6): 2000-2299: Short 100 ns
MD runs, (7): 2300-2799: Constrained released MD run, 2800-2810: 11 crystal structures.
According to MD simulation, ICL3 starts to pack under the receptor at around 600ns and keep a stationary state until the end of 1 µs. After that, in order to observe how long ICL3 region would remain in this packed state, two independent 500 ns long simulations were performed representing the very inactive state of the receptor. In this continuation runs no restrains were applied. The first continued run starts with the same velocity of the previous 1 µs long simulation and carries out 500 ns which ICL3 does not change its packed form. The second continued 500 ns run starts with a different velocity, resulting ICL3 to move away from the receptor at around 220 ns before returning back to its packed position. In order to see the effect of restraints on the dynamics of ICL3 and receptor, a total of five independent MD runs performed which were different sets of constraints applied. And one 500 ns long MD run were performed which all distance restraints are released (see Figure 3.2) (Ozgur, Doruker
20
and Akten, 2016). The 13 frames from MD runs were named according to their MD trajectories, for example frame9 is the snapshot from the original 1 µs long simulation at around 9 ns or frame1648 is the 148th frame of the second continued MD run. These 13 frames and the position of ICL3 is shown in Figure 3.3.
21 3.2. Scoring Functions and Docking Studies
Molecular docking aims to predict the most favorable conformation of a ligand bound to a target receptor, which is evaluated by a scoring function. This process begins with a search algorithm that tries to generate all possible ligand poses in the binding cavity accompanied by calculating the score value of each pose that simply predicts the binding affinity of that ligand for the receptor. In general, scoring functions are divided into three categories; physics-based (force-field based), empirical and knowledge based. Each of them uses different parameter sets to end up with a reasonable result. Some docking tools combines different parameters from different scoring function categories. They usually consider the short-range interactions between the ligand and the protein while disregarding the long-range interactions in order to save time.
In general, physics based scoring functions are designed to compute potential energy in the gas phase and some of them were improved by solvation energy terms like Poisson−Boltzmann (PB) or Generalized Born (GB) models. Most of the physics-based scoring functions are physics-based on or composed of molecular mechanics force-fields such as AMBER, CHARMM, GROMOS and OPLS-AA. Interactions between ligand and receptor are computed using noncovalent energy terms, van der Waals and the electrostatic energy terms. While the van der Waals term is given by Lennard-Jones potential function, Coulombic formulation is used for electrostatic terms. Advantage of this method is that, they are applicable on modern force fields, quantum mechanics and solvation models.
22
Empirical scoring functions compute the final binding energies by summing up the individual uncorrelated energy terms. It relies on regression analysis to derive the weight factors for each term. For the regression analysis protein-ligand complexes with known structures and binding affinity data is required. Unlike the physics based methods that depend on theoretical framework, empirical scoring functions are more intuitive.
Knowledge-based scoring functions compute the energetic factors by summing up pairwise statistical potentials between protein and ligand. Their derivation is based on statistical analysis of the resolved structures of the protein-ligand complexes. They are computationally simple and effective to reproduce protein-ligand binding poses rather than binding energy (Kitchen et al., 2004; Liu and Wang, 2014).
Throughout this thesis, docking experiments were performed with AutoDock, GOLD with ChemPLP scoring function, DSX-CSD and DSX-PDB rescoring functions and Glide molecular docking tool. Their detail algorithm and scoring functions are discussed in the following sections.
3.2.1. AutoDock
AutoDock 4.0 is a free software tool that uses a physics-based scoring function that is derived from AMBER force-field and a genetic algorithm to explore the conformational space. In this so-called Lamarckian Genetic Algorithm (LGA) used by AutoDock, the pose of a ligand is defined as a chromosome, which is made up of genes. The genes are defined as ligand’s torsional angles of all possible rotatable
23
bonds, overall rotation and translation in space. The genetic algorithm starts by generating a population that is composed of 200 different ligand conformations with randomly assigned rotatable bonds, which are used to produce new generations through crossover and mutation events. Crossover is the combination of torsion angles from two randomly selected ligand conformations, and mutation is simply a change in one of the torsion angles. AutoDock’s scoring function is as given in the following equation 1. ∆"#=# ∆"vdW#∑i,j# /,-. -.01−# 3-. /-.4 +##
∆"hbond#∑i,j#∆"hbond#∑i,j#E ; # /<-. -.01−#
=-.
/-.0>+#?@ABCD + ∆"elec∑i,j H-H.
I /-. /-.+∆"torNtor +
∆"sol#∑i,j#Si#VjPQ R-.1
1S1#########################################################################################################################################################################(3.1)
The first term of the equation is the 12-6 Lennard-Jones potential, while the second term is 12-10 Lennard-Jones potential. rij indicates the distance between protein atom
i and ligand atom j, Aij and Bij are the vdW parameters. E(t) function provides
directionality based on the angle t from ideal hydrogen bonding geometry. The third term is the Coulomb formulation for electrostatic interactions while ε(rij) represents
distance-dependent dielectric constant, qi and qj are the atomic charges. Last term is
the desolvation potential that V represents the volume of the atoms and S represents the solvation parameter (Huey et al., 2007).
24
In this thesis, docking experiments were performed selecting Lamarckian genetic algorithm and a total of 20 runs were performed for each docking experiment. Grid box size was set to 44 x 44 x 44 with a spacing of 0.375 Å and the number of energy evaluations was set to 30 millions. For each docking experiment, the pose with the lowest ∆G (or the highest score) was selected as the most probable solution for that complex.
3.2.2. GOLD
GOLD (Genetic Optimization for Ligand Docking) is a molecular docking program provided by the Cambridge Crystallographic Data Centre (CCDC). It uses a genetic search algorithm to determine favorable binding poses. A population of chromosomes is manipulated and assigned to a fitness score value (Jones et al., 1997). GOLD has four different fitness functions. The GoldScore molecular mechanics-like function is the original scoring function provided with GOLD. It takes into account H-bonding, van der Waals, metal interactions and ligand torsion strain as shown in equation 2, where Shb_ext stands for the protein-ligand hydrogen
bond score and SvdW_ext standsfor the protein-ligand van der Waals score. Shb_int and
SvdW_int stand for the internal hydrogen bonding and van der Waals scores of the
ligand (Verdonk et al., 2003).
"TUV#WX;YPZZ = # [@A_]^_− [`Da_]^_− [@A_bC_− [`Da_bC_ (3.2)
Chemscore is one of the oldest scoring functions parameterized from 82 complexes of known binding affinities. It incorporates a protein-ligand atom clash term and an
25
internal energy term as shown in the equations 3 and 4. It includes terms for loss of covalent bonding, hydrophobic contact area, hydrogen bonding, acceptor-metal and lipophilic interactions (Verdonk et al., 2003).
∆"AbCDbCc = # ∆"d+ ∆"@ABCD#[@ABCD + ∆"e]_fg#[e]_fg+#∆"gbhB#[gbhB + ∆"/B_#[/B_ (3.3) ∆"i
AbCDbCc= # ∆"jklmkln− Eogfp@− EbC_− EoB` (3.4)
The Astex Statistical Potential (ASP) fitness function is a knowledge based scoring function provided with GOLD and is based on atom-atom distance potentials derived from a database of protein-ligand complexes. It uses some of the Chemscore terms such as clash term, hydrogen bonding and internal energy term.
ChemPLP fitness function is the default empirical scoring function provided with GOLD that uses Chemscore hydrogen bonding term. It treats van der Waals and repulsive interactions with a piecewise linear potential (PLP). It is faster to calculate ChemPLP than Chemscore and Goldscore. Overall, ChemPLP is generally more effective in pose prediction and virtual screening.
ƒrs,tuv#wxyz{|{ = ƒhgh+ ƒ@A + ƒ@A—o@+ ƒ@AQ<~+ ƒe]_+ ƒe]_QoBB/D + ƒe]_Qo@+ ƒe]_QoBB/DQo@ + ƒogfp@+ ƒ_B/p+ cpb_] (3.5)
The scoring function is shown as in equation 5, where ƒplp stands for piecewise
repulsive/attractive interactions and ƒhb, ƒhb-ch, ƒhb-CHO stand for distance and angle
26
ƒmet-coord, ƒmet-ch, ƒmet-coord-ch terms. ƒclash stands for empirical heavy-atom potential, to
avoid from internal ligand clashes. ƒtor is the torsional potential while csite is for
additional contributions outside the binding site (Korb, Stu and Exner, 2009).
In this thesis, GOLD/ChemPLP scoring function was used to perform docking experiments. The binding site is defined as a spherical region with a radius of 10 Å that covers key residues in the cavity. A total of 20 runs were selected for each complex.
3.2.3. DSX
DSX (DrugScore eXtended) is a knowledge-based scoring function that is used to re-evaluate the existing docked poses. In knowledge-based scoring functions, crystallographic data of protein-ligand complexes are required to determine pair distribution functions in order to extract pairwise potentials. Protein Data Bank (PDB) and Cambridge Structural Database (CSD) are used to derive these pairwise potentials for DSX (Neudert and Klebe, 2011). Drugscore calculates binding scores between the protein I and the ligand J as the sum of all existing atom-atom interactions as shown in equation 6, where ∆Wi,j stands for specific interactions
between atoms of type i and j, located at a distance r.
27
In this thesis, the DSX-online webserver was used to perform the rescoring. 20 binding poses generated by AutoDock were rescored using both DSX-CSD and DSX-PDB scoring functions for each protein-ligand complex.
3.2.4. GLIDE
GLIDE (Grid-based Ligand Docking with Energetics) is a molecular docking program provided by the Schrödinger Suite which uses an empirical scoring function and an OPLS-AA force-field. To find the best binding pose of the ligand, GLIDE uses a series of hierarchical filters. It represents the shape and properties of the receptor on a grid by several different sets of fields in order to find the most accurate binding poses. These filters are; distance matching on a 2 Å spaced grid, clash test for ligand atoms, prescreening of the initial set of ligands, greedy scoring and refinement. The prescreening process reduces computationally expensive energy and gradient evaluations. GLIDE has two scoring functions GlideScore Standard Precision (SP) and GlideScore Extra Precision (XP) and both functions are based on ChemScore, with differences in the hydrogen-bonding term, metal-ligand interaction term and additional solvation terms as shown in the equation 7 (Friesner et al., 2004, 2006).
àâ#"äXãP[åçÜP = # ?oBég+ ?`Da+ ?AbCD + ?h]Cfg_è
?AbCD = ?@èD_]CogBpé/]+ ?@A_CC_eB_bê + ?@A_oo_eB_bê+ ?rÅ + ?@A_hfb/ + ?h@BAbo_hfb/
28
In this thesis, GlideScore XP was selected to perform the docking experiments for higher accuracy. Inner box was set to 15 x 15 x 15 and outer box was set to 35 x 35 x 35 size, where the inner box defines the volume that the ligand center explores during the exhaustive site-point search and outer box defines the volume in which the grid potentials are computed. Other parameters were set to default features and 20 runs were selected for each protein-ligand complex.
3.3. Docking-Based Virtual Screening
With the developments in genomics projects, NMR and crystallographic studies, docking based virtual screening approach (DBVS) become a very important first step in lengthy drug discovery process. DBVS is the rapid evaluation of large chemical compound libraries in order to select the best candidates using a docking program. To achieve an optimal complementarity, docking program virtually docks each compound in the library to the target protein. Using a search algorithm, it predicts the possible binding poses and ranks these docking results with a scoring function. At the end of screening, a small group of top-ranked compounds are selected as candidate (hit) molecules for later experimental assays (Tuccinardi, 2009; Cheng et al., 2012).
In this thesis, GOLD with ChemPLP scoring function was selected to perform virtual screening. The same classification protocol with the binding test was applied (Figure 3.8), but this time only the conformers found in top five in all four docking results for at least one ligand molecule were selected for virtual screening and these are
29
frame9, frame210, frame531, frame585, frame715, frame844, frame1365, frame1479 and frame1648, a total of nine conformers. For comparison, one active crystal structure (PDBid: 2RH1) and two inactive crystal structures (PDBids: 3SN6, 4QKX) were also selected for screening. Default features were used and radius spacing was selected to be 10 Å for the grid box. For each compound, number of runs was selected to be 20. The small compound dataset used for the screening was composed of 26 antagonists and 31 agonists for β2AR. These 57 ligands were generated from ChEMBL (Gaulton et al., 2012) and GPCR Ligand and Decoy Sets (Gatica and Cavasotto, 2012) databases. MarvinSketch program was used to transform these molecules into 3D mol2 format (Marvin 15.1.26, 2015, ChemAxon). These molecules were depicted in Appendix A.
3.4. Receiver Operating Characteristic (ROC) Curve
Receiver Operating Characteristic (ROC) curve is a common method used to evaluate the performance of virtual screening tools. Also it provides a way to compare the selectivity of different target molecules; the one with steeper slope curve has better discriminatory power for ligands with desired activities over the others in the database. ROC curves were obtained using the sensitivity (Se) value on y-axis, and the specificity (1-Sp) on x-axis. Se is the true positive rate and gives the ratio of the selected active molecules over the number of all active molecules;
30
where TP represents true positives and FN represents false negatives. Sp is the false positive rate and gives the ratio of the inactive molecules that is not selected by target over all inactive molecules;
[ì = =bpof/D]D#bCfo_b`]p,gg#bCfo_b`]p =utëírut (3.9)
where TN represents true negatives and FP represents false positives. Therefore, 1- Sp is;
1 − [ì =utëírír (3.10)
ROC curves starts with the top scored molecule on the hit list and continues according to their score values. While a curve between the ideal and the random curve represents a better performance, a curve under the random curve represents ineffective performance (see Figure 3.4) (Sotriffer, 2006).
In this thesis, the results were analyzed through ROC curves based on both ChemPLP score values and its normalized forms using number of heavy atoms (N) to prevent biasing towards large molecules,
[CB/efgbï]D = #tvñ (3.11)
where the power a is taken as 1/10, 1/3, 1/2, 3/4 and 1 as shown in the equation 11 (Pan et al., 2003).
31
Figure 3.4. ROC curve model (Sotriffer, 2006).
In order to provide a value for enrichment comparison than the visual analysis, for each ROC curve, AUC (Area Under the ROC Curve) values were also calculated. The AUC value can be calculated by the following equation 12;
óòô = # [ [Pb bëõ ([ìb − [ìbëõ)]# (3.12)
The AUC value is limited between 0 and 1. An AUC value of 0.5 represents a random prediction, thus, an AUC value of > 0.5 indicates predictions better than random. The higher AUC value means a higher early recognition of active compounds. The AUC values of 0.5-0.7 are considered to represent poor model performance while values of 0.7-0.9 are considered moderate.
32
Chapter 4
Results and Discussions
4.1. Key Residues at the Ligand-Binding Site
As the intracellular loop 3 (ICL3) links the transmembrane helices V and VI (TM5 and TM6), and the size of the ligand-binding site is identified by the positioning of the TM5, TM6 and TM7, ICL3 has an important role in the allosteric mechanism of the receptor which was previously revealed in a simulation study conducted by Ozgur et al. (Ozgur, Doruker and Akten, 2016) through applying specific distance restraints between key residues at the ligand-binding site. These restraints helped us to understand the correlation between the changes at the extracellular ligand-binding site and its effect on the conformational change of the lower half (intracellular) of the receptor, which consists of ICL3 and the G protein-binding site. These restrained distances between Asp113 located on TM3 and Ser203, Ser204, Ser207 located on TM5, Phe289 and Asn293 located on TM6 and Asn312 located on TM7 were shown as in Figure 4.1 adopted from the work by Ozgur et al. (Ozgur, Doruker and Akten, 2016).
33
Figure 4.1. The key residues at the ligand-binding site and the distance restraints between these seven residues (Ozgur, Doruker and Akten, 2016).
Especially, Asp113 on TM3 and Ser207 on TM5 are the two important residues at the ligand-binding site, due to the fact that the distance between these residues greatly influences the binding capability of the ligand. They form multiple hydrogen bonds and/or close contacts with ligands where Ser207 interacts with the ligand’s aromatic ring and Asp113 with the polar end of the ligand. The distance range of experimental measurements between the two side chain atoms, O! atom of Ser207 and C! atom of Asp113 is 8 Å to 10 Å when the receptor is in its active state, while the receptor changes its conformation to inactive state the distance is around 11 Å to 12 Å (Simpson et al., 2011). Asp113 Asn312 Phe289 Asn293 Ser204 Ser207 Ser203
34
The very inactive state of the receptor was characterized by a further movement of the lower half of TM6 towards the receptor core, and simultaneous close packing of ICL3 underneath the membrane completely blocking the G-protein binding site. All together, the extracellular ligand-binding site expands with the increasing distance between Ser207 and Asp113. In the MD conformers this distance varies from 8.3 Å up to 16.7 Å as shown in Figure 4.2 and more detailed results are provided in Appendix B. Most of the MD snapshots have higher distances than the experimentally known inactive structures.
Figure 4.2. The distance plot of the MD conformers between key residues at the ligand binding site. Both inactive and active x-ray structures (PDB ids: 2RH1 and
3SN6) also added for comparison. 4 6 8 10 12 14 16 18 20 fr 9 fr 2 1 0 fr 5 3 1 fr 5 8 5 fr 7 1 5 fr 8 4 4 fr 1 3 6 5 fr 1 4 7 9 fr 1 6 4 8 fr 2 2 3 1 fr 2 3 1 1 fr 2 3 7 0 fr 2 6 6 1 2R H 1 3S N 6 Di st a n c e ( Å ) S203Oγ-N113Cγ S204Oγ-N113Cγ S207Oγ-N113Cγ S293Cβ-N113Cβ S289Cβ-N113Cβ S312Cβ-N113Cβ S289Cβ-N312Cβ
35 4.2. Evaluation of the Classification Protocol
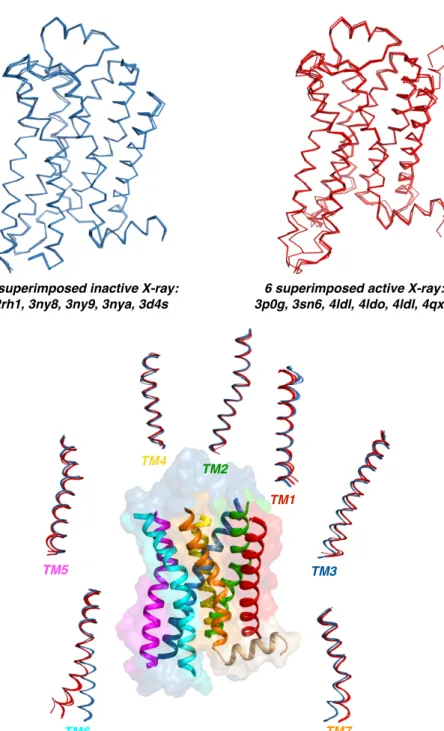
A total of eleven crystal structures of β2AR of which five represent inactive (PDBids: 2RH1, 3D4S, 3NYA, 3NY8, 3NY9) (Figure 4.3) and six represent active states (PDBids: 3POG, 3SN6, 4LDE, 4LDL, 4LDO, 4QKX) (Figure 4.3) were used as targets to their experimentally known ligands carazolol, ICI 118;551, a novel compound (JSZ), alprenolol, timolol, BI-167107 (POG), hydroxybenzylisoproterenol (XQC) and epinephrine (see Figure 4.4) in order to bring out the ability of scoring functions to distinguish active states from inactive states. AutoDock, GOLD with three scoring functions ChemPLP, GoldScore and ChemScore, two rescoring functions DSX-CSD and DSX-PDB and finally the Glide software tool with Glide XP (extra precision) scoring function were selected to perform the dockings.
36
Figure 4.3. X-ray snapshots of inactive (blue) and active (red) states aligned and seven transmembrane helices.
TM3 5 superimposed inactive X-ray:!
2rh1, 3ny8, 3ny9, 3nya, 3d4s
6 superimposed active X-ray:! 3p0g, 3sn6, 4ldl, 4ldo, 4ldl, 4qxc TM1 TM4 TM6 TM5 TM7 TM2
37
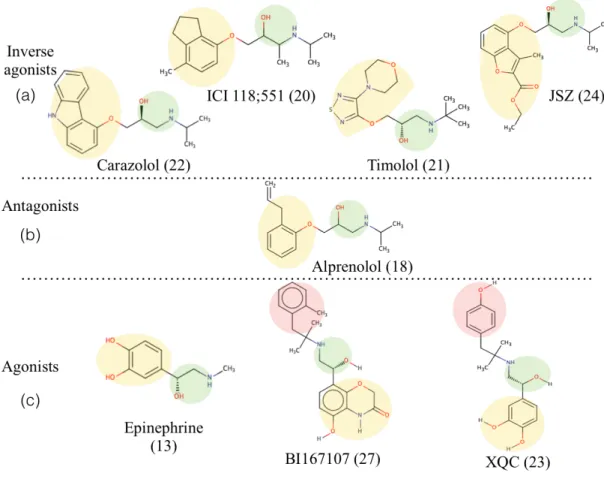
Figure 4.4. Molecular schemes of the ligand molecules that are known and used in crystal structures. (a) Four inverse agonists carazolol (PDB id: 2RH1), ICI 118;551 (PDB id: 3NY8), timolol (PDB id: 3D4S) and a novel molecule (PDB id: 3NY9). (b)
Antagonist molecule alprenolol (PDB id: 3NY8). (c) Three agonists epinephrine (PDB id: 4LDO), BI167107 (PDB id: 3P0G) and XQC (hydroxybenzylisoproterenol)
(PDB id: 4LDL). Yellow circle: ring (I), Green circle: ethanolamine, Red circle: ring (II). The numbers next to ligand names indicate number of heavy atoms.
Each ligand was docked to its own receptor in the complex crystal structure and also cross-docked to the other ten crystal structures. A classification protocol (see Figure 4.5) was applied for the docking results based on their activity state. The poses with the highest score value (best pose) were selected and evaluated based on their vicinity to five key residues at the ligand-binding site. The best pose should interact with either Asp113 (TM3) or Asn312 (TM7) on one side, and with Ser203 or Ser204
38
or Ser207 (TM5) on the other side of the binding pocket (See Figure 4.6). The poses that were not in this neighborhood were simply discarded and the remaining ones were sorted based on their score values. Conformers that were found in the top five were evaluated based on their activity state.
Figure 4.5. The binding protocol used for classification.
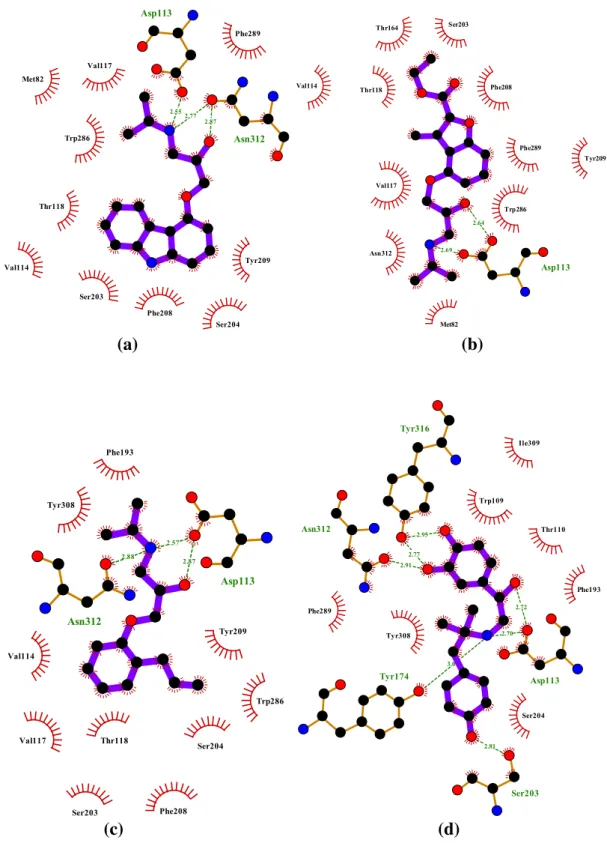
Figure 4.6. Ligand interactions at the binding site. The interactions of inverse agonist carazolol (PDBid: 2RH1) with the five key residues. It fits the binding protocol by interacting with Serines (pink) with the aromatic head group while interacting with
Asp312 (blue) and Asp113 (red) on the other side.
Docking N receptor conformers For each conformer
Pose with highest score selected = A total of 11 best poses
Binding mode test (either Asp113 or Asn312
AND
either Ser203, Ser204 or Ser207) X (≤ N) conformers sorted by score Top 5 conformers selected N n
39
Carazolol is one of the experimentally known inverse agonists which preferentially binds to the inactive state of the receptor. The binding results of carazolol were significant as shown in Table 4.1 in which the top five consists solely of inactive states of the receptor in all seven scoring functions. Similar calculations for the remaining ligands (ICI 118;551, a novel compound (JSZ), alprenolol, timolol, BI-167107, XQC, epinephrine) were performed and their corresponding tables with ranked structures were provided in Appendix C.
Table 4.1. Binding results of the inverse agonist carazolol docked to 11 crystal structures sorted by their score values in decreasing order. The active states are
shown in red and inactive states are shown in blue.
Finally, all docking results were summarized as in Table 4.2 which shows the number of active states found in top five if the ligand is an agonist or if the ligand is an inverse agonist or antagonist, the number of inactive states found in top five. Accordingly, AutoDock and GOLD/ChemPLP were found to be the most successful scoring function with 37 conformers (out of 40) with correct states placed in the top five, while GOLD/GoldScore showed the weakest performance (29 conformers out of 40). On the other hand, when the same docking results were evaluated according
Rank Auto Dock Chem PLP Gold Score Chem Score DSX/ CSD DSX/ PDB Glide 1 3D4S 2RH1 3D4S 3NYA 2RH1 3D4S 2RH1 2 2RH1 3D4S 2RH1 2RH1 3D4S 2RH1 3D4S
3 3NY9 3NY9 3NYA 3NY9 3NYA 3NY9 3NYA
4 3NYA 3NYA 3NY8 3D4S 3NY9 3NYA 3NY9
5 3NY8 3NY8 3NY9 3NY8 3NY8 3NY8 3NY8
6 3SN6 4LDL 3SN6 3POG 3SN6 3SN6
7 3POG 3SN6 4LDE 4LDE 4LDE 4LDE
8 4LDO 4LDE 3SN6 4QKX 4LDL
9 4LDE 4LDO 4QKX
10 3POG 3POG
40
to the docked ligand, ICI 118;551 had the least amount of correct predictions in top five (only 16 out of 35), which might indicate that its specificity is not very strong.
Table 4.2. Binding results of the eight ligands with crystal structures. If the ligand is agonist, results are corresponding to the number of active states found or if the ligand
is an inverse agonist or antagonist it corresponds to the number of inactive states.
Efficacy Ligand Au to - Do ck Ch em PL P Go ld Sc or e Ch em Sc or e DS X/ CS D DS X/ PD B Gl id e To ta l Inverse Agonist Carazolol 5 5 5 5 5 5 5 35 ICI 118;551 4 3 0 2 1 3 3 16 JSZ 5 5 5 5 5 5 4 34 Timolol 4 5 4 3 5 5 4 30 Antagonist Alprenelol 4 5 1 3 3 4 2 22 Agonist BI-167107 5 4 5 3 3 3 5 28 XQC 5 5 4 5 5 5 5 34 Epinephrine 5 5 5 5 5 5 5 35 TOTAL 37 37 29 31 32 35 33
To summarize, among seven different scoring functions, four of them (AutoDock, ChemPLP, DSX-PDB and Glide XP) were relatively successful in ranking the correct state in top five therefore they were selected to proceed further docking analysis of MD conformers.
4.3. Docking Experiments of MD Conformers
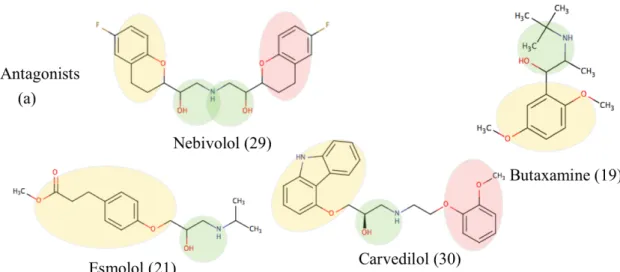
After the elimination of scoring functions, six new molecules with known activities were also added to the ligand list; four antagonists (nebivolol, carvediolol,esmolol and butaxamine) and two agonists; one of them is long-acting agonist (formoterol), the other is a short-acting agonist (salbutamol) as shown in Figure 4.7. However, these ligands do not have any resolved structures and this enables us to further
41
evaluate the classification scheme in distinguishing the active states from the inactive ones. These new ligands were docked to eleven crystal structures using only four most successful scoring functions, AutoDock, ChemPLP, DSX-PDB and Glide XP.
Figure 4.7. Molecular schemes of the additional ligands with known activities. (a) Four antagonists nebivolol, carvedilol, butaxamine and esmolol. (b) Two agonists
salbutamol and long acting formoterol. Yellow circle: ring (I), Green circle: ethanolamine, Red circle: ring (II). The numbers next to ligand names indicate
number of heavy atoms.
The summary of all the ligands’ docking results is given in Table 4.3 which shows the number of states in top five with correct activity state, i.e., active if the ligand is agonist and inactive if the ligand is an inverse agonist and/or antagonist. Accordingly, butaxamine which is one of the antagonists in the list was found to be the least successful in distinguishing inactive states from the active states, and was
42
discarded from the ligand list for further docking analysis of MD conformers. The most successful case was the inverse agonist carazolol, which predicted all inactive states in top five in all docking experiments. Alternatively, the same docking results were presented using the target structure in the column, which receives a tick mark if that crystal structure was seen in top five in all four docking results (See Table 4.4). Although ICI118;551 only selected one of the inactive crystal structures (3D4S), most of the ligands selected the structure with the activity state that matches the ligand efficacy. On the other hand, in Table 4.4 esmolol was not selected by any crystal structure and was discarded from the ligand list. This results both support the reliability of the classification scheme and the docking tools as well.
Table 4.3. Docking results of the crystal structures with all the ligands. Biological
Effect Ligand AutoDock ChemPLP DSX/PDB Glide Total Inverse Agonist Carazolol 5 5 5 5 20 Timolol 4 5 5 4 18 ICI 4 3 3 3 13 JSZ 5 5 5 4 19 Antagonist Alprenolol 4 5 4 2 15 Nebivolol 3 4 4 4 15 Butaxamine 0 3 1 4 8 Esmolol 4 0 5 5 14 Carvedilol 5 3 3 4 15 Agonist Formoterol 5 5 5 3 18 Salbutamol 5 5 5 4 19 XQC 5 5 5 5 20 BI167107 5 4 3 5 17 Epinephrine 5 5 5 5 20 TOTAL 59 57 58 57