Fossil and Active Hydrothermal Alteration in the Hisaralan Geothermal Field, Kocabas vd.
AKÜ FEMÜBİD 16 (2016) 015801 (132‐154)
AKU J. Sci. Eng. 16 (2016) 015801 (132‐154)
DOI: 10.5578/fmbd.10852 Araştırma Makalesi / Research Article
Clay Mineralogy and Geochemistry of Fossil and Active Hydrothermal
Alteration in the Hisaralan Geothermal Field (Sındırgı‐Balıkesir), western
Turkey
Cumhur KOCABAŞ
1, Murat TOKÇAER
2, and Mümtaz ÇOLAK
21Balıkesir University, Department of Geological Engineering, Çağış Campus, 10145, Balıkesir. 2Dokuz Eylül University, Department of Geological Engineering Tınaztepe Campus, 35160, Buca, İzmir. e–mail. [email protected], [email protected], [email protected] Geliş Tarihi: 22.12.2015; Kabul Tarihi;17.02.2016 Abstract
Hisaralan (Sındırgı–Balıkesir–Batı Anadolu) Jeotermal Sahasında Fosil ve
Aktif Hidrotermal Alterasyonun Kil Mineralojisi ve Jeokimyası
Özet Anahtar kelimeler Volkanik; Jeotermal; Hidrotermal Alterasyon; Karışık tabakalı Illit– Smectit; Simektit.Hisaralan jeotermal sahası Simav Grabeni ile İzmir–Balıkesir Transfer Zonu (IBTZ)’nin kesişim yerinde bulunmaktadır. Alan Erken Miyosen dasidik ve riyolitik volkaniklerden oluşmaktadır. Kil mineralojisi güncel ve fosil hidrotermal alterasyonu belirlemek için araştırılmıştır. HS–2 sondaj kuyusu ve yüzey örneklerinin mineralojisi XRD, SEM ve optik mikroskop ile çalışılmıştır. R2 I–S ve simektit yüzeye yakın kesimlerde baskınken saf illit ve R3 I–S jeotermal alanın derin kesimlerdeki baskın kil mineralleridir. Fosil hidrotermal sistem iki evrede gerçekleşmiştir. İlk olarak, piropilitik alterasyonu işaret eden Fe‐zengin klorit, kalsit ve pirit oluşmuştur. Bunu takip eden, saf illit ve illitçe zengin I–S piropilitik alterasyonu üzerlemiştir. Rb/Sr izotop verileri illitik minerallerin (illit ve/veya I–S) Erken Miyosen volkanizması ile yaş ve köken bakımında eş olduğunu göstermektedir. Diğer taraftan, aktif hidrotermal alterasyonun dioktahedral simektit çökelttiği varsayılmaktadır. Element aktiviteleri termal suların 100 ⁰C ve altında simektit ile dengede olduğunu göstermektedir. Çatlaklarda ve önceki alterasyon ürünlerinin yüzeyinde sıvamalar şeklinde bulunan halloysit geç evre oluşumudur. Killere ait O ve H izotop verileri simektit mineralinin aktif jeotermal sisteme ait olduğunu ve halloysitin meteorik kökenli düşük sıcaklıklı sulardan çökeldiğine işaret eder. Düşük sıcaklıklı jeotermal sistemler simektit çökeltmektedir ve fay zonlarının kesişim yerleri Hisaralan ve çevresindeki güncel jeotermal alanlar için karakteristiktir. © Afyon Kocatepe Üniversitesi Keywords Volcanics; Geothermal; Hydrothermal Alteration; Mixed Layer Illite– Smectite; Smectite.
Hisaralan geothermal field is located at the intersection between Simav Graben and İzmir–Balıkesir Transfer Zone (IBTZ). The area is hosted by Early Miocene dacitic and rhyolitic volcanics. Clay mineralogy was investigated for the purpose of identifying the present and fossil hydrothermal systems. HS–2 drillhole and surface clay mineralogy were examined by XRD, SEM and optical microscopy. R2 I–S and smectite are dominant clay mineral close to the surface while discerete illite and R3 I‐S are the dominant clay minerals at the deeper parts of the geothermal field. The fossil hydrothermal system developed at two stages. Initially, Fe–rich chlorite, calcite and pyrite indicative of propylitic alteration occurred. Subsequently, discrete illite and I‐S postdated the propylitic alteration. Rb/Sr isotope data from illitic minerals (illite and/or I–S) shows they are coeval and cogenetic with Early Miocene volcanism. On the other hand, active hydrothermal system is supposed to precipitate dioctahedral smectite. Activity of elements indicates the thermal waters are in equilibrium with smectite at temperatures below 100 °C. Halloysite found in the cracks and coating on the surfaces of former alteration products indicates a late phase precipitation. O and H isotopes of clay minerals indicate that low temperature geothermal systems precipitate clay minerals as smectite, and intersection of fault zones are characteristic for present day geothermal fluids Hisaralan and ıts surroundings.
1.Introduction
WNW‐ESE trending Simav Graben is the latest products of N–S extentional tectonics (Seyitoğlu, 1997). Kaolin, alunite and epithermal ore deposits are regarded as products of fossil hydrothermal systems and coeval and cogenetic with Miocene volcanism along Simav Graben (Oygür and Erler, 2000; Mutlu and Sarıiz, 2005; Ece et al. 2013; Yılmaz et al. 2013). In addition to fossil hydrothermal alteration active geothermal systems are characterised by sinter precipitations and hot springs (Oygür & Erler, 2000). Hydrothermal alteration in Hisaralan geothermal field is an example for existing of both past and present hydrothermal alteration where active Simav graben faults meets with NE‐SW trending strike slip faults.
Dioctahedral clay minerals such as smectite, mixed layer illite–smectite (I–S) and ilite provides information about thermal and geochemical conditions of hydrothermal alteration both in extinct and active geothermal systems (Inoue et al. 2004). Smectite to illite transition via mixed layered I–S is considered to be used as geothermometer in geothermal fields (Horton, 1985; Beaufort et al. 1990; Harvey and Brown 1991; Inoue, 2004). On the other hand, factors such as fluid chemistry, time and W/R ratio are important factors affecting the formation of I–S. Although using clay minerals as a geothermometer is controversial (Essene and Peacor, 1995), smectite, I‐S, illite and aqueous solutions can be attained equilibrium and activities of components can be used (Aagard and Helgeson, 1983; Aja, 1992).
Our ettempt is to characterize the clay mineral assemblage in Hisaralan geothermal field to seperate active and fossil hydrothermal systems. For this reason, the relation between the solid phases and aqueous solutions are compared. O and H isotopic compositions of clay minerals and chemistry of fluids should be used for separation of active and fossil geothermal systems. 2. Materials and Methods Surface samples were collected 30‐40 cm beneath the surface to eliminate the weathering effects. Whole rock and clay mineralogy were determined by X‐ray diffraction (XRD) using a Phillips X’Pert Pro diffractometer with Ni‐filtred, CuKα radiation. Scanning speed was 1 °2/min. The clay mineralogy was determined after separating <2μm fraction in distilled water by santrifuge method. The clay fraction was spread on glass slides. XRD analyses were carried out on air dried, and ethylene glycole saturated samples (Brown and Brindley, 1980).
The morphology of clays as well as other secondary minerals were examined by using scanning electron microscope (SEM) FEI Quanta 250 FEG equipped with an energy‐dispersive
spectroscopy (EDS). Microanalyses were
performed on gold coated samples.
Whole rock chemical analyses were carried out by
inductively coupled plasma emission
spectrometry (ICP‐MS) following a lithiumborate fusion and dilute acid digestion of a 0,2 g sample in ACME Analytical Laboratories (Canada).
Element analyses of water samples were carried out by ICP‐MS (ACME, Canada). Two polyethlene bottles of water were collected for each sample. The waters have been passed on a 0.45 μm filter paper. One of them was acidified with concentrated HNO3 for cation analyses. No
preservation was made to the other bottle collected for anion analyses. Temperature, pH, Eh
,electrical conductivity (EC) and HS– were
determined in‐situ. Bicarbonate was determined in the field by titration method using 0,1 M HCl to prevent changes as a function of pH. The activity of elemens were calculated by PHREEQC computer code. The diagrams were selected on the basis of clay mineralogy of the outcrop and drillinghole samples.
The mobility of elements are determined by comparing the chemical composition of the fresh rock with respect to altered rocks (Gresens, 1967). The mass change was taken into consideration and following simplified equation was used (Grant,
1986, MacLean and Kranidiotis, 1987).
ΔCi=(CxPCiD/CxD)–CiP. If ΔCi=0 which indicates
immobility, CiP should be taken to the left side of
the equation for the purpose of evaluating the mobility of elements in a logaritmic scale the following calculation is used; CiP/(CxPCiD/CxD)=1
which indicates immobility. Al2O3 is taken
immobile by binary plot of immobile elements which displays a linear line passing from the origin. CiP and CiD represents concentration of element in the fresh and altered rock respectively. CxP and CxD represents concentration of immobile component Al2O3. Oxygen and hydrogen isotopic composition of clay minerals were determined using the analytical techniques of Clayton and Mayeda (1963). The hydrogen isotope analysis of clay minerals was carried out on a Thermo Finnigan TC–EA interfaced with a Thermo Finnigan Delta‐Plus XL mass spectrometer, using the reference materials NBS22 (oil; δDSMOW = –117 ‰), IAEA–CH–7
(polyethylene foil; δDSMOW = –100 ‰) and an in‐
house standard (kaolinite; δ DSMOW = –65 ‰). The
oxygen isotope analysis was carried out using a laser fluorination line interfaced with a Finnigan MAT 252 mass spectrometer, using UWG‐2 garnet (δ18O = 5.8‰) (Valley et al., 1995) as reference
material. The analytical precision was 1 ‰ for the dD measurements and 0.2 ‰ for the 18O
measurements.
18O and D/H isotope ratios in liquid water samples
using a Laser Water Isotope Analyzer V2. For 18O
and D/H at natural abundance, each sample is injected 8 times. The first 4 injections are discarded to eliminate memory effects and the average of injections # 5–8 is used for isotope ratio calculations. Sample isotope ratios are
standardized using a range of working standards that have been calibrated against IAEA standard
reference materials (VSMOW, GISP, and
SLAP). Precision for water samples at natural abundance is typically ≤0.3 permil for 18O and ≤0.8
permil for D/H. Final 18O/16O and D/H values are
reported relative to VSMOW.
Sr isotopic ratios were measured on a Fisons‐VG‐ Micromass 54–30 Sector multicollector mass spectrometer. Sr was loaded in 1 N HNO3 on a Ta
single filament. Sr isotopic ratios were corrected for mass discrimination using 86Sr/ 88Sr = 0,1194.
Replicate analyses of separate loads of NBS‐987 yielded a mean 87Sr/86Sr = 0,710250 ± 0,000010
(2). Rb–Sr isotope ratio was determined using an inductively coupled plasma mass spectrometry (ICP–MS). Detailed information on analytical procedures for ICP‐MS analyses is given in Niu and Batiza (1997). The two sigma errors for the
87Rb/86Sr ratio were estimated at 2%, and that of
the 87Sr/86Sr ratio was estimated at ±0.05%. Rb–Sr
isochron ages were calculated using the Isoplot code of Ludwig (1996).
3. Tectonic and Geological Setting
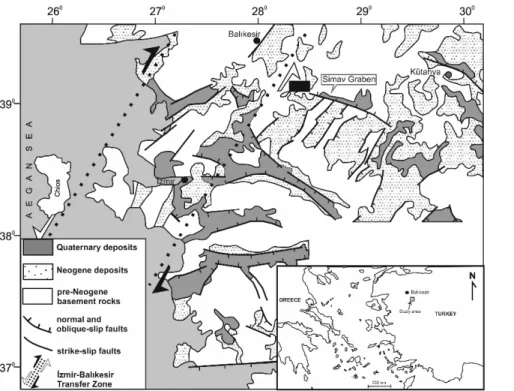
The study area is located at the intersection between eastern part of İzmir‐Balıkesir Transfer Zone (IBTZ) and western end of Simav Graben (Figure 1). The Simav Graben is regarded as one of the latest product of N‐S extentional tectonics which affected the Eagean region in the Latest Oligocene‐Early Miocene times (Seyitoğlu, 1997). On the other hand IBTZ is a transform fault in the Late‐Cretaceous and acted as a transfer fault zone during Neogene (Okay and Siyako, 1991). IBTZ is intermittently reactivated since Miocene and present day reactivitation is also suggested (Özkaymak and Sözbilir, 2008; Uzel and Sözbilir, 2008). The autors are also determined that NE trending transfer zone includes NE‐SW and NW‐SE strike‐slip and E‐W striking normal faults which developed synchronously and are sysmically active.
Figure 1. Simplified tectonic map of Western Anatolia showing Neogene/Quaternary basins and location of IBTZ (modified from Bozkurt, 2001). The black box represents the location of the study area.
Simav region at the west of the study area is characterized by extentional basins and hosts Early to Middle Miocene magmatic rocks (Çoban et al. 2012). Sındırgı volcanites involving the volcanics in the study area represents the begining of the Early Miocene extension (Erkul et al. 2005).
The basement rocks of the study area comprise of limestone olistoliths and ophiolitic rocks of the Bornova Flysch Zone (Okay and Siyako, 1991). The basement rocks are uncomformably overlain by Miocene volcanic series. These volcanic rocks are referred as Sındırgı volcanics which is a part of Bigadiç volcano‐sedimentary succession (Helvacı, 1995; Erkul et al. 2005). Sındırgı volcanics consist of dacitic to rhyolitic intrusions, lava flows and pyroclastic rocks. The age of the Sındırgı volcanites are Early Miocene 20.2 ±0.5 Ma for rhyolitic and 19.0± 0.4 Ma for dacitic rocks according to K/Ar ages (Erkul at al., 2005).
The volcanic rocks in the study area are described as ignimbrite (Yılmaz et al. 2013). Ignimbrites are seperated into two units as lower and upper ignimbrite (Figure 2). Lower ignimbrite is a crystal rich unit and consists of K‐feldspar, plagioclase,
biotite, amphibole and rare pyroxene. The Lower ignimbrite is overlain by upper ignimbrite unit which is a pumice rich pyroclastic flow deposit. The 40Ar/39Ar age of the lower ignimbrite unit is
19.82 ± 0.14 Ma. and the upper ignimbrite unit is 18.96 ± 0.11 Ma (Yılmaz et al. 2013).
The thermal waters are discharged along the intersection between the Simav Graben and the NE trending strike slip faults. The water, altered rock samples and HS‐2 drillhole location are given in Figure 3.
Figure 2. Geological map of the study area (Modified from Yılmaz et al. 2013). Figure 3. Sample location map of the Hisaralan geothermal field. 4. RESULTS 4.1. Mineralogy 4.1.1 Optical Microscopy
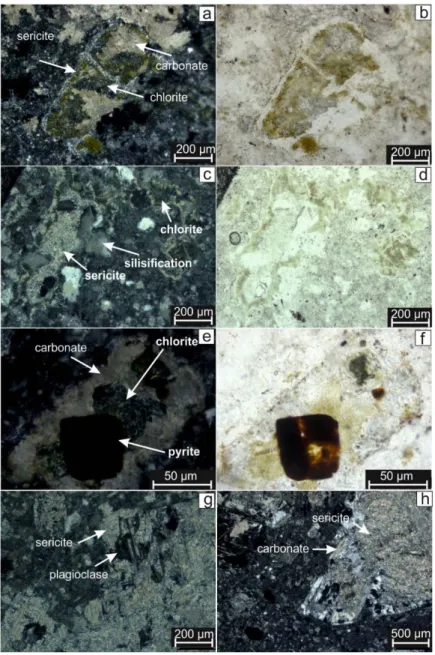
The petrographic studies show that the fossil hydrothermal alteration in the Hisaralan geothermal field has developed at two stages. The chloritization and carbonatization is the first stage and are followed by sericitic alteration and silisification at the second stage. The sericite cross‐ cutting chlorite indicates that chlorite is postdated by sericite (Figure 4a,b). The sericitization and chloritization of the matrix is common (Figure 4c,d). Pyrite is probably formed by the excess Fe outcome of alteration of chlorite under reducing conditions (Figure 4e,f). The petrographic studies show that the common alteration in the Hisaralan geothermal field is sericitization of feldspar in lower ignimbrite unit. The plagioclases are altered to sericite (Figure 4g). Carbonatization accompanied to sericitization is observed (Figure 4f).
Figure 4. Photomicrographs: a) Chlorite, carbonate and sericite alteration probably formed from a feldspar; cross nicols (H345) , b) Paralel nicols of the previous view, c) Silisification, sericite and chlorite in the matrix of H16, d) Paralel nicols of the previous view, e) Chlorite and carbonate indicative of propylitic alteration. Pyrite crystallised probably from the remainning Fe. f) Paralel nicols of the previous view. g) Sericitization of plagioclase; cross nicols (Sample H16), h) carbonate alteration of feldspar and sericitization of plagioclase, cross nicols (Sample OR32).
4.2 Clay mineralogy of HS‐2 drillhole and outcrop samples
Clay mineralogy of the drillhole samples were examined down to 464 m because volcanic sequence passes to the basement rocks below this level. XRD patterns of ethylene glycolated clay fractions (<2μm) of the HS–2 drillhole samples are given in Figure 5 and out crop samples in Figure 6. HS–2 drillhole samples include illite and/or I–S, chlorite and smectite while outcrop samples include kaolinite and halloysite as well. Random to R1 ordered I–S occurres in samples containing 60– 70 % illite layers and the full R2 ordering appears in I–S containing >75% illite layers while R3 ordering occurres for >85 % illite layers (Bethke et al. 1986). In addition, an increase in the degree of ordering with increasing illite layers is referred for I–S as follows; R=0, R=1 and R>3 ordering (Nadeau and Reynolds, 1981). If a reflection occurres between
5.3° and 8.7 °2θ the interstratifications is ordered (Srodon, 1980). All the samples including I–S display ordered interstratification in HS–2 drillhole and outcrop samples. Reichweite ordering and the proportion of smectite within I–S is determined by
plotting the angular differences Δ2θ2 (5,1‐7,6 °2θ and 8,9‐10,2°2θ) and Δ2θ1 (16,1‐17,2°2θ and 8,9‐ 10,2°2θ) which are sensitive to variation of ordering (Watanabe, 1981; Inoue and Utada, 1983). Drillhole samples 36m and 48m and outcrop samples H345, H348 and KU contain R2 I‐S (Figure 7a). The degree of ordering is determined by the diagram displaying the relationship between Δ2θ1 and smectite content (%) of I‐S (Srodon, 1980). The samples 36m, 48m, H345, H348 and KU are ISII ordered I‐S (Figure 7b).The samples from 190 to 464 are R3 I–S according to the Δ2θ estimation for identification Reichweite (Moore and Reynolds, 1997; Table 1).
Figure 5. XRD pattern of <2μm clay fraction of ethylene glycolated HS‐2 drillhole samples. The dashed lines represent air dried pattern. Sme: smectite, Chl: chlorite, I‐ S: Mixed layered illite–smectite. The numbers above the peaks indicate d spacings (Å). Figure 6. XRD pattern of <2μm clay fraction of ethylene glycolated outcrop samples. The dashed lines represent aird dried pattern of smectite. Sme: smectite, I‐S: illite‐ smectite mixed layers, Kln: kaolen, Chl: chlorite. Table 1. XRD data for illite and/or I–S mixed layer for HS–2 drillhole and outcrop sample. Sample %illite layers
in I–S Reichweite Ir Type of illite
HS–2 drillhole samples 36m 85‐90 % 8.19 – R2 I–S 48m 80‐85 % 8.08 – R2 I–S 120m 90–95 % 7.72 – R3 I–S 190m >95% 8.75 – R3 I–S 254m – 8.87 2.07 I and/or I–S 296m – 8.91 1.25 I and/or I–S 390m – 8.90 1.39 I and/or I–S 436m – 8.89 1.26 I and/or I–S 464m – 8.83 1 Illite Outcrop samples H335 80 % 7.91 – R2 I–S H336 95‐100 % 8.63 – R3 I–S H345 80 % 7.84 – R2 I–S H346 80 % R2 I–S H348 85–90 % 8.08 – R3 I–S H349 – – – I and/or I–S H350 – – – I and/or I–S H351 – – 1.58 I and/or I–S H352 – – 1.25 I and/or I–S H353 – – 1.36 I and/or I–S KA ~10 % 8.53 – R3 I–S KU 85–90 % 8.34 – R3 I–S
The d001 values of smectites between 14.89 to 15.28 Å indicates Ca‐smectite while the d001 values are between 12‐12.5 Å indicates Na‐smectite (Brown and Brindley, 1980). The basal spacings of 12.32 and 12.53 Å of air‐dried XRD patterns for 36m and 48m indicates Na‐smectite (Figure 5). The peaks shift toward ~17 Å after ethylene glycol saturation. The d060 at near 1.50 reveals dioctahedral character of smectite. The chlorite is determined by the reflections at 001, 002, 003 and 004 and the peaks belong to these reflections are ~14.20 Å, ~7.10 Å, ~4.72 Å and ~3.54 Å respectively (Moore and Reynolds, 1997; Figure 5).
The surface samples collected inside and around the geothermal field contains smectite, I‐S and chlorite (Figure 6a, b). Smectite is the dominant clay mineral in sample H335 and d060 at near 1.50 Å reveals dioctahedral character. The samples H350, H351, H352, H353 are also contain Na‐ smectite (Figure 6b). The distinction between kaolinite and chlorite is determined by the peak at 3.58 Å for kaolinite and 3.54 Å for chlorite. H335, H345 and H346 consists of R2 I‐S while H336, KA, KU and H349 to H353 include R3 I‐S (Table 1). In additon H335 includes kaolin mineral (probably kaolinite) determined by the 7.17 Å and 3.58 Å peaks. Halloysite is determined in H350 by the 7.42 Å and 3.58 Å peaks (Figure 6b). The halloysite is also supported by SEM analysis.
The smectite content of I‐S is the highest (20 %) for samples H345 and H346 (Figure 8). The samples H349 to H353 has both discrete illite and I‐S because they fall the illite field on the diagram of Srodon (1980) and is shown in Figure 8. The Ir values are higher than 1 (Table 1).
The illite and/or I‐S were plotted (002) versus (003) reflections on the diagram (Figure 8; Srodon, 1984). The samples below the illite field are regarded as pure I‐S mixed layer minerals. The samples in the illite field are discrete illite or a
mixture of illite and I‐S mixed layers. Then the intensity ratio
Figure 7. a) Diagram displaying Δ2θ1 versus Δ2θ2 for
determining Reichweite ordering and the proportion of smectite within I‐S (Watanabe, 1981; Inoue and Utada, 1983), b) Plot of Δ2θ1 versus proportion of smectite of I‐S for estimation degree of ordering (Srodon, 1980). Figure 8. Plot of 002 and 003 reflections of I‐S and/or illite for HS‐2 drillhole and outcrop samples. Solid lines: IS type ordering Dashed lines: ISII type ordering (Srodon, 1984).
(Ir) can be checked for these samples to identify amount of expandable material (Srodon, 1984). The peak heights ratio of 001 and 003 reflections from air‐dried and ethylene glycolated samples represents intensity ratio (Ir). Ir=1 indicates the sample consists of discrete illite while the Ir >1 means sample is a mixture of discrete illite and I‐ S.
The drillhole samples 36m, 48m, 122m and 190m are pure I‐S lacking discrete illite because the samples are below the illite field (Figure 8). The 294 m and 436 m have both illite and I‐S. The deepest sample of the well 464 m has (Ir) value equal to 1 and contain discrete illite lacking I‐S (Table 1). The amount smectite component of I‐S and Ir values are given in Table 1.
4.3 SEM studies
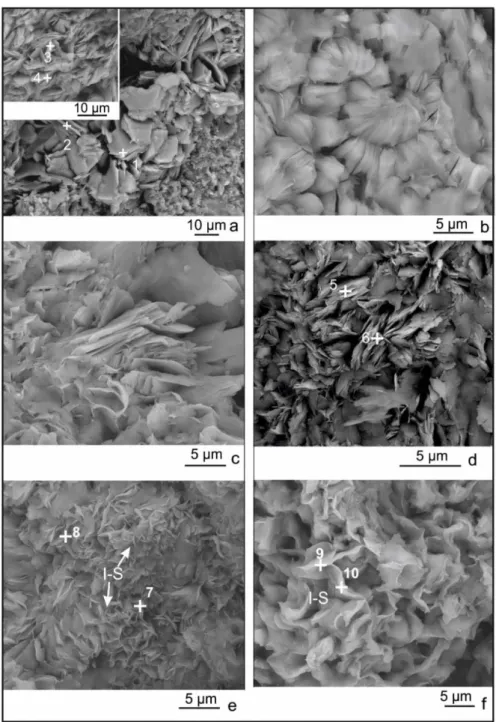
Chlorite is characterized by thin stacks, pseudohexagonal and lath shaped plates with 5‐ 10 μm crystal thickness (Figure 9a). The SEM image to the left upper side of the Figure 9a consists completely of random oriented thin plates of chlorite. Chemical analyses by EDS determines the chlorite is iron rich (Table 2). Vermicular form of chlorite is also observed by SEM analysis and is probably formed by transformation of amphibole determined also by petrographic analysis. Chlorite crystals covered by I–S indicates chlorite was formed earlier than illitic minerals (illite/or I–S) (Figure 9c). The sample from drillhole 328 m displays somewhat curved and lath shape morphology (Figure 9d). Lath shaped coarse crystals are characteristic for illite rich I–S . The EDS analyses from the morphology for highly illite bearing I–S minerals were reported
by SEM and TEM studies (Keller, 1986; Inoue et al. 1987). On the other hand, highly expandable I–S with ~20 % illite layers displays a honeycomb morphology (Figure 9e and 9f). In addition, the K2O
contents of 328m (drillhole sample) is higher than H345 and H335. There is no evidence for a transition or an over growth in these morphology as suggested by Pollastro (1985). It is concluded that illite is formed by direct precipitation and it is not formed by smectite to illite transformation. Morphology of illitic minerals changes with increasing illite content.
Kaolin minerals transformed to I‐S indicates that kaolinite formation belongs to a past hydrothermal system probably related to epithermal veins which can be found nearby geothermal field (Figure 10a). Rosetta shape hematite is determined in sample H345 (Figure 10b). The occurrence of hematite on the surface of clay minerals may indicate late phase and probably present day precipitation from geothermal fluids. Halloysite is determined in the fissures of the surface samples H350 (Figure 10c). The spiral tube shaped morphology of halloysite in H336 is given in the magnified SEM image (Figure 10d). This kind of halloysite formations are precipitated from low temperature weathering profiles (Papoulis et al. 2004; Ece and Schroeder, 2007).
Figure 9. a) Pseudohexagonal chlorite crystals (H346) and randomly oriented chlorite crystals (upper left image), b) Vermicular form of chlorite (H345), c) Chlorite crystals covered by I‐S (H345), d) Lath shaped > 5 μm subhedral crystals of I–S from drilling (sample 328), e) Highly expandable I–S displaying honeycomb morphology from sample H345, and f) H335. The numbers represent EDS analyses points. Table 2: EDS analyses of mixed layer clay minerals (I–S) and chlorite (chl). EDS points 1 chl 2 chl 3 chl 4 chl 7 I–S 8 I–S 5 I–S 6 I–S 9 I–S 10 I–S Sample H346 H346 H345 H345 H345 H345 H328 H328 H335 H335 SiO2 36.65 35.04 39.38 36.29 55.23 54.78 50.59 51.63 59.62 58.68 Al2O3 24.96 24.88 21.81 23.97 32.35 33.08 32.25 32.41 26.51 28.17 FeO 25.90 28.61 25.87 22.27 1.90 2.01 3.67 3.44 4.19 3.03 MgO 11.09 10.33 9.82 14.42 1.30 1.46 3.79 3.02 2.29 2.03 CaO 0.68 0.45 1.50 0.87 0.74 1.03 0.48 – 0.23 0.33 Na2O 0.38 0.68 0.12 0.41 0.18 0.18 0.28 – 1.33 1.31 K2O 0.34 – 1.51 1.26 8.30 7.48 8.93 9.51 5.01 5.16 TiO2 – – – – – – – – 0.83 1.30
Figure 10. a) Transformation of kaolen minerals into I‐S in sample H335; (b) Rosetta shaped hematite crystal on the sample surface; (c) Halloysite crystals in the voids of fissures (H350) and (d) Spiral tube shaped structure of halloysite (H336). 5. Geochemistry
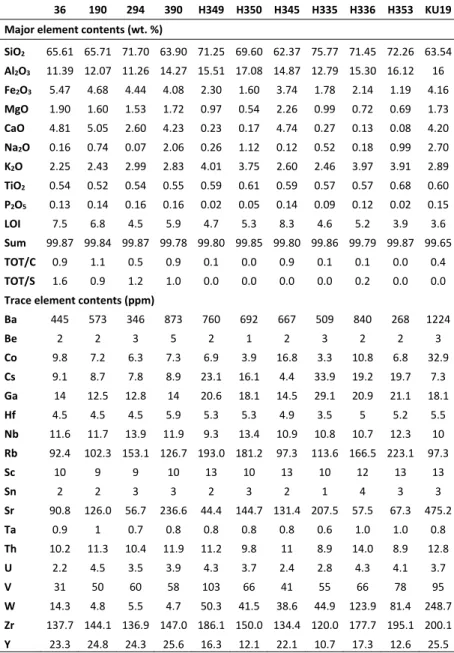
The major and trace element contents of fresh rock (KU19) and altered rocks are given in Table 3. The chemical index of alteration and mobilization of elements during alteration is discussed. 5.1 Chemical indices
An alternative index of chemical weathering derived from unweathered igneous rocks and their weathering profiles is used. MFW ternary diagram determines the extent of alteration and composition of the parent rock (Ohta and Arai, 2007). The M and F vertices characterize mafic and felsic rock sources while W determines the degree of weathering. An increase in the W value is an indication of increase in the abundance of phyllosilicates. A combined diagram of A–CN–K and CIA classifying the alteration intensity is used (Shao et al. 2012). The samples are also controlled
with respect to loss on Ignition (LOI). The formulas for weathering indices are given in Table 4. The samples KU19, 390m, 464m fall on the igneous trend and have dacitic to andesitic composition Figure 11a. These samples are very close to a value 50 for CIA and displays no weathering according to the A–CN–K diagram (Figure 11b). 464m is observed as the least altered sample among the others with close to 40 CIA value, but it can not be a fresh rock with a high LOI value. The lowest LOI value belongs to the KU19 so the sample was chosen for normalization calculations. None of the altered samples in Hisaralan geothermal field display strong weathering (Figure 11b). The drillhole samples fall into weak weathering field while outcrop samples fall into the intermediate weathering.
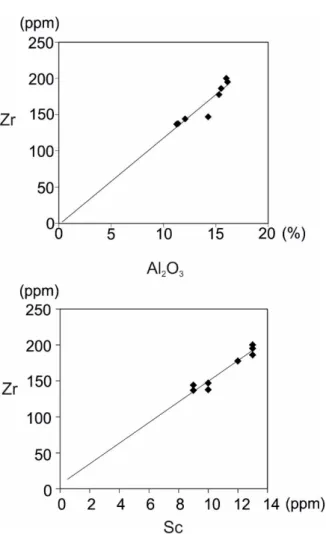
Table 3. Major (wt. %) and trace element (in ppm)analysis of fresh and altered samples in Hisaralan geothermal field. Table 4. Formulas for weathering indices. The immobile elements are determined by using binary plots of elements that show a linear trend passing from the origin and high correlation coefficient (MacLean and Kranidiotis, 1987). The Sc–Zr and Al2O3–Zr gives the highest correlation
coefficient 0.97 and 0.93 respectively (Table 5).
Binary plots of these elements display a linear trend passing from the origin and it is concluded that these elements are immobile (Figure 12). The sample H335 is extracted from the calculations because it’s low Zr content which indicates a loss probably due to high alkali environment of surface conditions 36 190 294 390 H349 H350 H345 H335 H336 H353 KU19 Major element contents (wt. %) SiO2 65.61 65.71 71.70 63.90 71.25 69.60 62.37 75.77 71.45 72.26 63.54 Al2O3 11.39 12.07 11.26 14.27 15.51 17.08 14.87 12.79 15.30 16.12 16 Fe2O3 5.47 4.68 4.44 4.08 2.30 1.60 3.74 1.78 2.14 1.19 4.16 MgO 1.90 1.60 1.53 1.72 0.97 0.54 2.26 0.99 0.72 0.69 1.73 CaO 4.81 5.05 2.60 4.23 0.23 0.17 4.74 0.27 0.13 0.08 4.20 Na2O 0.16 0.74 0.07 2.06 0.26 1.12 0.12 0.52 0.18 0.99 2.70 K2O 2.25 2.43 2.99 2.83 4.01 3.75 2.60 2.46 3.97 3.91 2.89 TiO2 0.54 0.52 0.54 0.55 0.59 0.61 0.59 0.57 0.57 0.68 0.60 P2O5 0.13 0.14 0.16 0.16 0.02 0.05 0.14 0.09 0.12 0.02 0.15 LOI 7.5 6.8 4.5 5.9 4.7 5.3 8.3 4.6 5.2 3.9 3.6 Sum 99.87 99.84 99.87 99.78 99.80 99.85 99.80 99.86 99.79 99.87 99.65 TOT/C 0.9 1.1 0.5 0.9 0.1 0.0 0.9 0.1 0.1 0.0 0.4 TOT/S 1.6 0.9 1.2 1.0 0.0 0.0 0.0 0.0 0.2 0.0 0.0 Trace element contents (ppm) Ba 445 573 346 873 760 692 667 509 840 268 1224 Be 2 2 3 5 2 1 2 3 2 2 3 Co 9.8 7.2 6.3 7.3 6.9 3.9 16.8 3.3 10.8 6.8 32.9 Cs 9.1 8.7 7.8 8.9 23.1 16.1 4.4 33.9 19.2 19.7 7.3 Ga 14 12.5 12.8 14 20.6 18.1 14.5 29.1 20.9 21.1 18.1 Hf 4.5 4.5 4.5 5.9 5.3 5.3 4.9 3.5 5 5.2 5.5 Nb 11.6 11.7 13.9 11.9 9.3 13.4 10.9 10.8 10.7 12.3 10 Rb 92.4 102.3 153.1 126.7 193.0 181.2 97.3 113.6 166.5 223.1 97.3 Sc 10 9 9 10 13 10 13 10 12 13 13 Sn 2 2 3 3 2 3 2 1 4 3 3 Sr 90.8 126.0 56.7 236.6 44.4 144.7 131.4 207.5 57.5 67.3 475.2 Ta 0.9 1 0.7 0.8 0.8 0.8 0.8 0.6 1.0 1.0 0.8 Th 10.2 11.3 10.4 11.9 11.2 9.8 11 8.9 14.0 8.9 12.8 U 2.2 4.5 3.5 3.9 4.3 3.7 2.4 2.8 4.3 4.1 3.7 V 31 50 60 58 103 66 41 55 66 78 95 W 14.3 4.8 5.5 4.7 50.3 41.5 38.6 44.9 123.9 81.4 248.7 Zr 137.7 144.1 136.9 147.0 186.1 150.0 134.4 120.0 177.7 195.1 200.1 Y 23.3 24.8 24.3 25.6 16.3 12.1 22.1 10.7 17.3 12.6 25.5 Indice Formula CIA Al2O3/(Al2O3+CaO+Na2O+K2O)100 A–CN–K (Al2O3–CaO)+ Na2O–K2O M=0.395×ln(SiO2)+0.206×ln(TiO2)0.316×ln(Al2O3)+0.160×ln(Fe2O3)+0.246×ln(MgO)+0.368×ln(CaO)+0.073×ln(Na2O) –0.342×ln(K2O)+2.266. F=0.191×ln(SiO2)–0.397ln(TiO2)+0.020ln(Al2O3)–0.375×ln(Fe2O3)–0.243 ln(MgO)+0.079 ln(CaO)+0.392×ln(Na2O)+0.333×ln(K2O)–0.892 W=0.203×ln(SiO2)+0.191×ln(TiO2)+0.296×ln(Al2O3)+0.215×ln(Fe2O3)‐0.002×ln(MgO)‐0.448× ln(CaO) –0.464×ln(Na2O)+0.008×ln(K2O) –1.374
Figure 11. a) MFW diagram, black squares are taken from Ohta and Arai (2007), b) Combined A–CN–K and CIA diagram (Shao et al. 2012).
The Al2O3 is taken immobile for the comparison
between the altered rocks and fresh rock. The element gains and losses were determined by normalized the Al2O3 content of altered samples
to Al2O3 content of fresh rock (KU19). According to
the normalized plots the samples enriched in SiO2
between 13–60 % and enriched in K2O between 6–
47 % (Figure 13). Small amount of enrichment in some of the samples considered to be immobile. MgO and Fe2O3 are enriched in chlorite bearing drillhole samples while they are lost in the chlorite deficient samples. The smectite rich samples H335 and H336 are also lost in Fe2O3 and MgO during alteration. The Na2O is lost in all the samples while CaO is lost in outcrop samples and is enriched in drillhole samples. Enrichment of CaO is probably
due to the secondary calcite in drillhole samples which is also determined by XRD.
Figure 12. Zr–Al2O3 and Zr–Sc binary plots showing
linear trends passing from the origin.
Cs and Rb are gained with K2O. On the other hand, Sr is behaved as CaO and enriched (Figure 14). The immobile elements displays less than 21 % variation. The variations are 21 % for Ga, 20 % for Hf, 14 % for Sc and 17 % for Th. On the other hand, Ga is two fold enriched and Zr is 25 % lost in H335. Th is 31 % lost in H353. Ta displays small enrichment in some of the samples. Y is gained in drilhole samples while it is lost in outcrop samples. Mo shows a very scattered plot. Cu, Zn are immobile in most of the drillhole samples while they are totally lost in outcrop samples. Pb is enriched in all the samples. As, Sb and Au are considerably enriched in all the altered samples while the enrichment is significant in smectite rich samples, especially in samples 36m, H335 and H336.
Table 5. Corelation coefficients of immobile elements.
TiO2 Al2O3 Sc Ga Hf Nb Ta Th V W Zr Y
TiO2 1.00 Al2O3 0,78 1.00 Sc 0,82 0,92 1,00 Ga 0,79 0,87 0,94 1,00 Hf 0,42 0,75 0,54 0,41 1,00 Nb ‐0,18 ‐0,61 ‐0,68 ‐0,58 ‐0,42 1,00 Ta 0,24 0,19 0,15 0,31 ‐0,21 ‐0,12 1,00 Th ‐0,31 0,29 0,15 0,17 0,30 ‐0,51 0,01 1,00 V 0,60 0,80 0,81 0,70 0,56 ‐0,59 ‐0,24 0,19 1,00 W 0,48 0,68 0,72 0,57 0,39 ‐0,54 0,04 0,49 0,60 1,00 Zr 0,82 0,93 0,97 0,89 0,52 ‐0,62 0,19 0,19 0,85 0,80 1,00 Y ‐0,75 ‐0,57 ‐0,66 ‐0,83 ‐0,08 0,21 ‐0,46 0,26 ‐0,41 ‐0,09 ‐0,59 1,00 Figure 13. Diagram showing mobility of major elements. Figure 14. Diagram showing mobility trace elements.
5.2. Water geochemistry and activity diagrams
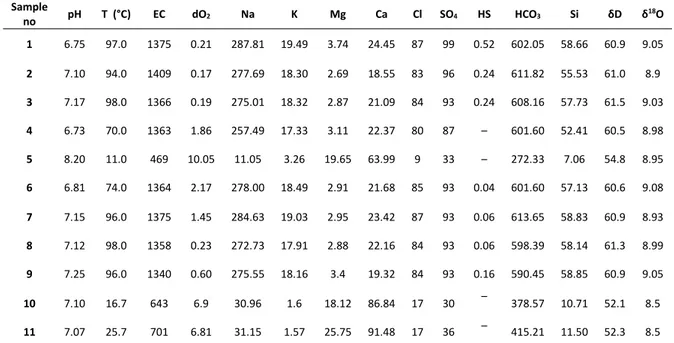
Physical, chemical, O and H isotopic data of waters from Hisaralan geothermal field is given in Table 6. The surface temperatures of the thermal springs are in the range of 70‐98 °C and EC values are vary between 1340‐1409 μS/c. The thermal waters belong to the Na–HCO3 facieses while cold spring
waters belong to the Ca–HCO3 type. Low chloride
content indicates shallow circulation for Hisaralan geothermal waters (Mutlu, 2007). Sındırgı geothermal waters plot on the immature waters and not attain a water rock equilibrium (Mutlu, 2007). Cation geothermometers are doubtful for immature waters (Giggenbach, 1998). So the silica geothermometers were used to determine the reservoir temperature. Geothermal fluids saturated with respect to quartz over 180 °C while at lower temperatures chalcedony or amorphous silica is oversaturated (Arnorsson, 1975). The silica solubility is governed by amorphous silica and/or chalcedony. The proposed temperature range is between 110 to 150 °C for Sındırgı geothermal waters (Mutlu, 2007). The chalcedony geothermometer agree well with mineral equilibrium calculations and
around 120 °C for Sındırgı geothermal waters (Mutlu and Kılıç, 2009). The thermal water element activities were plotted on activity diagrams for the purpose of investigate mineral‐fluid equilibrium in Hisaralan geothermal field. The diagrams were selected on the basis of clay mineralogy and temperature of drillhole and outcrop samples. The thermal waters are in eqilibrium with Na and Ca–montmorillonite in the diagrams prepared for aCa2+/a2H and aNa+/aH+ against aH4SiO4. (Figure 15a, b;
Tardy, 1971). According to clay mineralogy of Hisaralan geothermal field montmorillonite and illite are separate phases anda does not display a continious serie. So the water samples can be plotted on the diagram of aK+/aH+ against aH4SiO4
prepared for discrete illite and montmorillonite (Figure 15c; Garrels, 1984). The thermal waters plot on the montmorillonite field. On the other hand, the binary diagrams which are prepared for activities at 100 ⁰C and 1 bar conditions are plotted on the kaolinite field (Figure 11d, Merino, 1975). It is concluded that montmorillonite has been formed below 100 °C.
Figure 15. (a, b) The plot of activities of geothermal waters at 25 °C (Tardy, 1971); (c) Mineral stability diagram taken from Garrels (1984); (d) Mineral stability diagrams at 100 °C (Merino, 1975).
Table 6. Physical chemical and isotopic data of waters from Hisaralan geothermal field. 1, 2, 3, 4, 6,7, 8 and 9: Thermal waters. 5: river water 10‐11: cold spring waters. 5.3. Isotope Studies
The δD and δ18O values of altered samples are
given in Table 7. δD values are plotted against the δ18O values of the altered samples as well as
thermal waters in Figure 16. The O and H isotope values of thermal waters fall between the Global Meteoric Water Line (GMWL) and Marmara Meteoric Water Line (MMWL). This indicates a meteoric origin for Hisaralan geothermal waters. Table 7. δD and δ18O values of altered samples. Sample No δD δ18O 48m –83 3.4 190m –90 2.2 254m –82 2.0 296m –90 –0.9 436m –89 0.5 H335 –72 3.7 H350 –84 7.2 KA –96 2.2 KU –91 2.2 Clay fraction of HS–2 drillhole samples 48m, 190m, 254m, 296m and 436m from deeper levels to the shallower parts and outcrop samples H335, H350, KA and KU were studied. The drillhole samples δ18O values increases with depth. δ18O value of 296m is
lower than 436m and 296m has also the lowest δ18O value. This is probably due to the small
amount of smectite content of 436m (see Figure 5). The δ18O values of 190m, 254m, KA and KU are
higher than these two samples and very close to each other. This is probably due to the high amount of swelling layers of I–S in these samples. Higher amount of illite in I–S should be due to the increasing temperature and/or illite crystalinity with increasing depth. The smectite and I–S dominated sample 48 and H335 has the highest δ18O value. The higher oxygen isotope ratio of
smectite dominant samples should be due to the lowest formation temperature of smectite (Marumo, 1989). The δD values range from –71 and –65 ‰ and the δ18O values +4,5 and +6,1 ‰
of smectite in Noboritsu active geothermal system points to crystallisation at lower temperatures between 100–150 °C (Marumo et al. 1995). The δD and δ18O values for H335 confirm a low formation
temperature for highly smectite bearing sample.
The highest δ18O value belongs to the halloysite
bearing sample H350 and this indicates the lowest Sample
no pH T (°C) EC dO2 Na K Mg Ca Cl SO4 HS HCO3 Si δD δ
18O 1 6.75 97.0 1375 0.21 287.81 19.49 3.74 24.45 87 99 0.52 602.05 58.66 60.9 9.05 2 7.10 94.0 1409 0.17 277.69 18.30 2.69 18.55 83 96 0.24 611.82 55.53 61.0 8.9 3 7.17 98.0 1366 0.19 275.01 18.32 2.87 21.09 84 93 0.24 608.16 57.73 61.5 9.03 4 6.73 70.0 1363 1.86 257.49 17.33 3.11 22.37 80 87 – 601.60 52.41 60.5 8.98 5 8.20 11.0 469 10.05 11.05 3.26 19.65 63.99 9 33 – 272.33 7.06 54.8 8.95 6 6.81 74.0 1364 2.17 278.00 18.49 2.91 21.68 85 93 0.04 601.60 57.13 60.6 9.08 7 7.15 96.0 1375 1.45 284.63 19.03 2.95 23.42 87 93 0.06 613.65 58.83 60.9 8.93 8 7.12 98.0 1358 0.23 272.73 17.91 2.88 22.16 84 93 0.06 598.39 58.14 61.3 8.99 9 7.25 96.0 1340 0.60 275.55 18.16 3.4 19.32 84 93 0.16 590.45 58.85 60.9 9.05 10 7.10 16.7 643 6.9 30.96 1.6 18.12 86.84 17 30 – 378.57 10.71 52.1 8.5 11 7.07 25.7 701 6.81 31.15 1.57 25.75 91.48 17 36 – 415.21 11.50 52.3 8.5
formation temperature. Even H350 has high illite content which is inferred from the XRD peaks, the plot is very close to the kaolinite line. It is indicated that halloysite probably falls to the right side of supergene line (demonstrated by the arrow) and is formed by low temperature meteoric waters and has a supergene origin.
The fluid temperatures which clay minerals formed were determined for the most pure clay mineral (illite and/or I–S) bearing samples (296m and KU). The oxygen isotope ratios of fluid in equilibrium with illite at 200 and 250 °C for sample
296m and 175–200 °C for KU was calculated by using illite‐water fractionation factor (α) and the equation is as follows: 103 ln (α)=2.39*106/T2 –
3.76 (Sheppard and Gilg, 1996). The hydrogen isotope ratio was calculated by the equation 103ln
(α) = – 20±5. The calculated δ18O and δD values of
fluids in equilibrium with illites are plotted in Figure 16. The fluids are somewhat enriched in δ18O. The enrichment displays a simple water‐rock interaction. Figure 16. δ18O versus δD for HS‐2 drillhole samples and waters from Hisaralan geothermal field. Supergene versus hypogene lines (S/H) from Sheppard et al. (1969) and kaolinite line from Sheppard and Gilg (1996). Global Meteoric water line (δD = 8δ18O + 10) (Craig, 1961). Mediterranean Meteoric Water Line (δD = 8δ18O + 22) (Gat and Carmi,
1970). Close circles presents thermal waters.
5.3.1. Rb‐Sr isotope analyses
The data of illitic clays is given in Table and Rb–Sr isocron diagram is plotted on Figure. Data for four I–S samples shows a linear ship with a slope which corresponds to 17,4±1,9 Ma (MSWD=0.27) with an initial 87Sr/86Sr ratio of 0,70925±0,00077 (Figure 17).
This indicates the pure I‐S of different illite contents were formed synchronously. Table 8: Rb–Sr data of illitic minerals (illite and/or I‐S). Rb (ppm) Sr (ppm) 87Rb/86Sr 87Sr/86Sr 1 258.313 84.40 8.857 0.71157555 2 252.796 43.14 16.962 0.713239014 3 304.105 25,35 34.736 0.717933492 4 393.049 27.68 41.119 0.719395648
Figure 17: Rb–Sr isocron plot for the clay fractions (<2µm) of illites.
6. Discussion
The Hisaralan geothermal field characterized by dominance of sericitic minerals (illite and/or I‐S) accompanied by adularia and quartz (silicification) .This type of deposits refer to adularia‐sericite (or low sulfidation) and form in geothermal systems near neutral pH, chloride brines in a lateral flow regime high above from a heat source (Heald et al.,1987). The occurrence of adularia and sericite indicate 250 °C temperature due to the feldspar hydrolysis (Hemley and Jones, 1964). There are gold bearing epithermal quartz veins close to the geothermal field (Yılmaz et al., 2013). Some of these veins extent up to the Hisaralan geothermal field. It is concluded that the fossil hydrothermal
alteration in geothermal field is
contemporaneously developed and effected by these epithermal systems. The Rb–Sr ages of 17.4 ± 1.9 Ma is compatible with the Ar‐Ar ages 18.3 ± 0.2 Ma of the Kızıltepe mineralization from quartz adularia veins near Hisaralan(Yılmaz et al., 2013). The clay mineralogy of Hisaralan geothermal field is characterized by a vertical distribution. R3 I‐S ,discrete illite and chlorite are the dominant clay minerals in the deeper parts of the volcanic sequence. Smectite and R2 I‐S are dominant clay minerals from 120 m up to the surface. In addition, the percent of expandable component of I–S and amount of smectite progressively increase getting close to the surface. The fossil hydrothermal alteration occurred in two stages. The first one, propylitic alteration is a weak or incipient alteration and characterized by epidote, chlorite, carbonates, albite and pyrite (Hemley and Jones, 1964). The mineral assemblage of the propylitic alteration consists of chlorite, calcite, and pyrite in Hisaralan geothermal field. Chlorite was formed by pervasive alteration. The mineral assemblage forms at small w/r ratio in rock dominated system and bulk composition is change very little from the primary rock (Reed, 1997) . Epidote is common in low CO2 systems while calcite is abundant in high
CO2 (Elders et al., 1978). Fluids higher in CO2 leads
to calcite instead of epidote (Browne and Ellis, 1970). Thus, a high CO2 system was prevailed
during hydrothermal alteration in Hisaralan.
Calcite may be occurred by the altering fluid which
introduced bicarbonate to the system
(Hedenquist, 1990). The chlorite chemistry can not be used as geothermometer but the high amount of Fe/Mg is an indicative of high temperature occurrence of chlorite at 250 ⁰C . The formation of discrete illite gives a temperature range higher than 230 °C (Reyes, 1990). Chlorite should probably be formed higher than this temperature.
In the second stage, propyllitic alteration was postdated by sericitic alteration (illite and/or I–S). Sericitic minerals occur by transformation of albite as well as volcanic glass. The silicification and secondary quartz is associated with illite. The illitisation of Na‐plagioclase requires K+ which can
be provided by chloritization of biotite or dissolution of K‐feldspar (Sanidine). On the other hand, illitic minerals (illite and/or I–S) can be seen in the micro cracks of the altered dacitic pyroclastics as veinlets.
The last stage of alteration is characterized by modern precipitates as dioctahedral smectite (probably montmorilonite), halloysite, and hematite. Alteration to montmorillonite occurs at temperatures 100–120 °C (Henley and Ellis, 1983). Low temperature hydrothermal dioctahedral smectites has been referred close to the surface of the geothermal fields (Cole, 1988; Mizoto, 1998; Mas, 2003;). On the other hand, synthesis of dioctahedral smectite is achieved under elevated temperatures (Tomita, 1993). The activity diagrams indicate that geothermal waters are in equilibrium with smectite below 100 °C while kaolinite should be formed above 100 °C. The smectite rich surface and shallow level drillhole samples which contains high amount of smectite are compatible with the geothermal water in equilibrium with smectite.. The formation of both smectite and hematite has been precipitated from geothermal fluids. There is no evidence of transformation from plagioclase or volcanic glass and ıt is also supported by SEM. On the other hand, halloysite is formed by supergene meteoric fluids of low temperature in microcracks of the altered rocks. This is supported by O and H isotop analysis which is plotted close to the supergene/hypogene kaolinite line despite the high amount of illite minerals.
The smectite bearing samples also show a considerabile enrichment in As, Sb and Au in regard to other alteration products.
The hydrogen and oxygen isotope studies reveal that smectite is formed at much lower temperatures than illite. The δ18O values of the
HS‐2 drillhole samples decrease with increasing depth. The isotope data also reveal occurrence of halloysite from meteoric waters. 7. Conclusions The Hisaralan geothermal field exposed to at least three stages of hydrothermal alteration. The two stages are coeval and cogenetic with Early
Miocene volcanism. Illite , I–S and chlorite are the dominant alteration minerals of these phases. The first stage of alteration is prophyllitic alteration and represented by chlorite and calcite. The second stage of alteration is sericitic alteration and represented by illite, illite rich I–S, quartz and adularia. Propylitic alteration is postdated by sericitic alteration. The Rb‐Sr analysis reveals the sericitic phase is Early Miocene and directly related to the volcanism.
The last stage of hydrothermal alteration is related to the present day geothermal waters. The activity diagrams in equilibrium with smectite among the other clay minerals and lack of any relation of smectite with other minerals indicates direct precipitation from solutions. The high amount of As content in smectite is also an indication for smectite. The hematite is probably associated with smectite and represents oxidizing conditions close to the surface. The tabular halloysite is a supergene alteration product and precipitated from low temperature meteoric waters.
The conjunction of Simav graben and IBTZ and existence of smectite in these lines can be used as exploration tool for finding new geothermal waters nearby the Hisaralan (Sındırgı) district. Acknowledgemends We are thankful to TÜBİTAK for financial support by the project 109Y171. The authors are greatful to Turkish Petroleum (TP) for providing the drillhole datum and samples.
References
Aagaard, P. and Helgeson, H.C., 1983. Activity/composition relations among silicates and aqueous solutions:II, Chemical and thermodynamic consequences of ideal mixing of atoms on homological sites in montmorillonites, illites, and mixed‐layer clays. Clays and Clay Minerals, 31, 207‐ 217.
Aja, S.U. and Rosenberg, P.E., 1992.The thermodynamic status of compositionally variable clay minerals: a discussion. Clays and Clay Minerals, 40, 292–299.
Arnorsson, S., 1975. Application of silica geothermometer in low‐temperature hydrothermal areas of Iceland. American Journal of Science, 275, 763–784.
Beaufort, B., Westercamp, D., Legendre, O., & Meunier, A., 1990). The fossil hydrothermal system of Saint Martin, Lesser Antilles: geology and lateral distribution of alterations. Journal of Volcanology and Geothermal Research, 40, 219‐243.
Bethke, C.M., Vergo, N. and Altaner, S.P., 1986 Pathways of smectite illitization: Clays and Clay
Minerals, 34, 125‐ 135.
Bozkurt, E., 2001. Neotectonics of Turkey—a synthesis.
Geodinamica Acta, 14, 3–30.
Brown G. and Brindley G.W., 1980. X‐ray diffraction procedures for clay mineral identification. in: Crystal Structures of Clay Minerals and their X‐ray Identification (G.W. Brindley & G., Brown, editors). Monograph 5. Mineralogical Society, London, 305– 359.
Browne, P.R.L. and Ellis, A.J., 1970. The Ohaki‐ Broadlands hydrothermal area, New Zealand: Mineralogy and related geochemistry. American
Journal of Science, 269, 97–215.
Cathelineau, M. and Nieva, D., 1985. A chlorite solid solution geothermometer. The Los Azufres (Mexico) geothermal system. Contribution to Mineralogy and
Petrology, 91, 235–244.
Clayton, R.N. and Mayeda, T.K., 1963. The use of bromine pentafluoride in the extraction of oxygen from oxides and silicates for isotopic analysis.
Geochimica et Cosmochimica Acta, 27, 43‐52.
Cole, T.G., 1988. The nature and the origin of smectite
in the Atlantic II Deep, Red Sea. Canadian
Mineralogist, 26, 755–763.
Craig, H., 1961.Isotopic variations in meteoric waters.
Science, 133, 1702‐1703. Çoban H., Karacık Z. and Ece Ö.I., 2012. The role of slab roll‐back and extensional collapse on the generation of coexisting early to middle Miocene alkaline and calc‐alkaline back‐arc magmas in western Anatolia extensional province; a record from Simav (Uşak) region, Turkey. Lithos, 140, 119–141.
Ece, Ö. I., Ekinci, B., Schroeder, P.A., Crowe D. and Esenli, F., 2013. Origin of the Düvertepe kaolin– alunite deposits in Simav Graben, Turkey: Timing and styles of hydrothermal mineralization. Journal
of Volcanology and Geothermal Research. 255, 57–
78.
Ece, Ö .I. and Schroeder, P.A., 2007. Clay mineralogy and chemistry of the halloysite and alunite deposits in the Turplu area, Balıkesir, Turkey. Clays and Clay
Minerals, 55, 18–36.
Elders, W.A., Hoagland, J.R. and Olson, E.R., 1978. Hydrothermal mineralogy and isotopic geochemistry in Cerro Prieto geothermal field, III, Practical Appication, Geothermal Sources Concil,
Transactions, 2, 177–179.
Ercan, T., Çevikbaş, A., Günay, E., Ateş, M., Can, B., Küçükayman, A. And Erkan, M., 1984. Bigadiç çevresinin (Balıkesir) jeolojisi ve magmatik kayaçların petrolojisi, Türkiye Jeoloji Kurumu
Bülteni, 5, 75–85.
Erkul, F., Helvacı, C. and Sözbilir, H., 2005. Evidence for two episodes of volcanism in the Bigadiç borate basin and tectonic implications for western Turkey.
Geological Journal, 40, 545–570.
Essene, E.J. and Peacor, D.R., 1995. Clay mineral thermometry. A critical perspective. Clays and Clay
Minerals, 43, 540–553.
Garrels, R. M., 1984. Montmorillonite/illite stability diagrams. Clays and Clay Minerals, 32, 161–166.
.Gat, J.R. and Carmi, I., 1970. Evolution in the isotopic composition of atmospheric waters in the Mediterrenean Sea area. Journal of Geophysical
Research, 75, 3039–3048.
Giggenbach, W.F., 1988. Geothermal solute equilibria. Derivation of Na – K – Ca – Mg geoindicators.
Geochimica et Cosmochimica Acta, 52, 2749–2765.
Grant., J.A., 1986. The isocon diagram: A simple solution to Gresens’ equation for metasomatic alteration. Economic Geology, 81, 1976‐1982.
Gresens R.L., 1967. Composition–volume relationship of metasomatism. Chemical Geology, 2, 47–65.
Harvey, C.C., Browne, P.R., 1991. Mixed‐layer clay geothermometry in the Wairakei geothermal field, New Zealand. Clays and Clay Minerals, 39, 614–621.
Heald, P., Foley, N.K. and Hayba, D.O., 1987. Comparative anatomy of volcanic‐hosted epithermal deposits: acid‐sulphate and adularia – sericite types. Economic Geology, 82, 1–26.
Hedenquist, J.W., 1990. The thermal and geochemical structure of theBroadlands‐Ohaaki geothermal system, New Zealand. Geothermics, 19, 151–185.
Helvacı, C., 1995. Stratigraphy, mineralogy and genesis of the Bigadiç borate deposits, western Turkey,
Economic Geology, 90, 1237–1260.
Hemley, J.J. and Jones, W.R., 1964. Chemical aspects of hydrothermal alteration with emphasis on hydrogen metasomatism. Economic Geology, 59, 538–569.
Henley, R. W. and Ellis, A. J., (1983). Geothermal systems ancient and modern: A geochemical review. Earth‐Science Reviews, 19, 1–50.
Horton, D.G., 1985. Mixed layer illite/smectite as a paleotemperature indicator in the Amethyst vein system, Creede district, Colorado, USA.
Contributions to Mineralogy and Petrology, 91, 17l‐
179.
Inoue, A., Meunier, A. and Beaufort, D. 2004. Illite‐ smectite mixed‐layer minerals in felsic volcaniclastic rocks from drill cores, Kakkonda, Japan. Clays and
Clay Minerals, 52, 66–84.
Inoue, A., Kohyama, N., Kitagawa, R. and Watanabe, T., 1987. Chemical and morphological evidence for the
conrvesion of smectite to illite. Clays and Clay
Minerals, 35, 111–120.
Inoue, A. and Utada M., 1983 .Further investigations of a conversion series of dioctahedral mica/smectites in the Shinzan hydrothermal alteration area, northeast Japan. Clays and Clay Minerals, 31, 401.
Keller, W. D., Reynolds, R.C. and Inoue, A., 1986.
Morphology of clay minerals in the smectite–to–
illite conversion series by scanning electron microscopy. Clays and Clay Minerals, 34, 187–197.
Ludwig, K., 1996. Isoplot, Version 2.9. U.S. Geol. Surv., Open-file, Rep, 91–445.
MacLean W.H. and Kranidiotis P., 1987. Immobile elements as monitors of mass transport in hydrothermal alteration: Phelps Dodge massive sulfide deposit, Matagami. Economic Geology, 82, 951–962.
Martinez‐Serrano, R.G., Dubois, M., 1998. Chemical variations in chlorite at the Los Humeros geothermal system, Mexico. Clays and Clay
Minerals, 46, 615–628.
Marumo, K., 1989. Genesis of kaolin minerals and pyrophyllite in Kuroko deposits of Japan: Implications for the origins of the hydrothermal fluids from mineralogical and stable isotope data,
Geochimica et Cosmochimica Acta, 53, 2915–2924.
Marumo, K., Longstaffe, F. J. and Matsubaya, O., 1995 Stable isotope geochemistry of clay minerals from fossil and active hydrothermal systems, southwestern Hokkaido, Japan. Geochimica et
Cosmochimica Acta, 59, 2545–2559.
Mas, A., Guisseau, D., Patrier Mas P., Beaufort, D., Genter, A., Sanjuan, B., Girard J.P., 2006. Clay minerals related to the hydrothermal activity of the Bouillante geothermal field (Guadeloupe), Journal
of Volcanology and Geothermal Research, 158, 380–
400.
Mas, A., Patrier, P., Beaufort, D. and Genter, A., 2003. Clay‐mineral signatures of fossil and active hydrothermal circulations in the geothermal system of the Lamentin Plain, Martinique. Journal of